
Research article · 2025 · Full text
International Journal of Geography Geology and EnvironmentAssessing environmental quality across industrial landscapes: A statistical comparison of pollution levels in different zones
Volume 7(12) · Pages 28–32 · DOI: 10.22271/27067483.2025.v7.i12a.457 ↗
Research areasHeavy metals in environmentWater Quality and Pollution AssessmentMine drainage and remediation techniques
Abstract
Author-writtenThis study evaluates the environmental quality of industrial and non-industrial areas by conducting a comparative investigation of air, water, and soil factors. The data were gathered by standardized environmental monitoring protocols, concentrating on principal pollutants including particulate matter (PM2.5 and PM10), gaseous emissions (NO₂, SO₂, CO), heavy metals (lead, mercury, cadmium), and nutritional components in soil. We used descriptive statistics and independent t-tests to look at the variations in pollution levels between places. The findings indicate markedly elevated concentrations of air pollutants in industrial zones, with PM10, PM2.5, NO₂, SO₂, and CO levels exhibiting substantial statistical significance (p<0.01). Water quality tests show that industrial locations have higher levels of heavy metals, BOD, and COD, as well as lower pH levels than non-industrial areas. The examination of soil quality shows that industrial areas have more heavy metals and less nutrients. The study shows that industrial activities put a lot of stress on the ecosystem and stresses the need for tougher pollution controls, better planning for long-term industrial growth, and continuing monitoring of the environment to protect public and ecological health.
Summary
Source-checkedPlain-language reading of the full paper, prepared with AI and checked against the text. Each point links to the authors' own words.
Why it matters
- Rapid industrialization and urban growth have significantly altered industrial landscapes, often leading to environmental degradation. View evidence ↗
- Industrial stressors typically manifest as degraded air and water quality, soil contamination, reduced biodiversity, and increased public health risks. View evidence ↗
- Statistical analysis is essential for comparing pollution intensity across different zones to provide evidence-based insights for environmental interventions. View evidence ↗
The question
- The study aims to evaluate and compare the environmental quality of industrial versus non-industrial areas by investigating air, water, and soil factors. View evidence ↗
What they did
- The researchers measured air pollutants (CO, NO2, SO2, PM2.5, PM10), water quality indicators (COD, pH, lead, mercury, cadmium), and soil parameters (nutrients, heavy metals, and pH). View evidence ↗
What they found
- Industrial areas had significantly higher particulate matter levels than non-industrial areas, with PM10 at 75.4±10.2 µg/m³ vs 35.6±7.5 µg/m³ and PM2.5 at 45.3±8.9 µg/m³ vs 22.1±5.4 µg/m³ (p<0.01). View evidence ↗
- Gaseous pollutants were significantly higher in industrial zones, specifically NO2 (105.7±15.3 ppb), SO2 (90.4±12.1 ppb), and CO (3.2±0.5 ppm) compared to non-industrial zones (p<0.01). View evidence ↗
- Water in industrial areas contained significantly higher concentrations of heavy metals: lead (12.8±3.2 µg/L), mercury (8.6±2.7 µg/L), and cadmium (5.9±1.4 µg/L) compared to non-industrial areas (p<0.01). View evidence ↗
- Industrial water showed lower pH (6.4±0.8 vs 7.2±0.6, p=0.02) and significantly higher BOD (42.5±8.3 mg/L) and COD (78.3±10.1 mg/L) than non-industrial water (p<0.01). View evidence ↗
- Soil in industrial areas had significantly higher levels of lead (150.2±25.3 mg/kg) and cadmium (75.4±14.7 mg/kg) compared to non-industrial areas (p<0.01). View evidence ↗
- Industrial soil was significantly more acidic, with a pH of 5.6±0.9 compared to 6.8±0.7 in non-industrial areas (p<0.01). View evidence ↗
What it means
- The authors conclude that there is an immediate need for better regulatory enforcement, improved waste management, and continuous monitoring to reduce pollution at the source. View evidence ↗
- The authors recommend strengthening green buffer zones, adopting cleaner technologies, and implementing sustainable industrial planning to mitigate environmental impacts. View evidence ↗
Visual summary
3 visualsIllustrations explain the paper; charts are replotted from the paper's own table values.
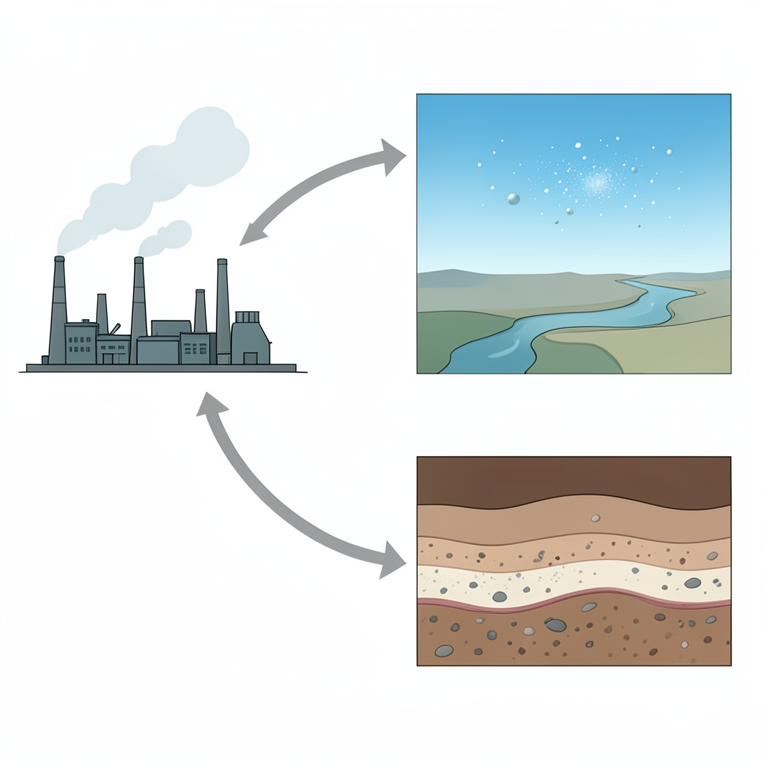
Environmental Monitoring Framework
AI-generated conceptual illustration (Industrial landscape with air, water, and soil components). It explains the idea and does not show study data.
View source evidence ↗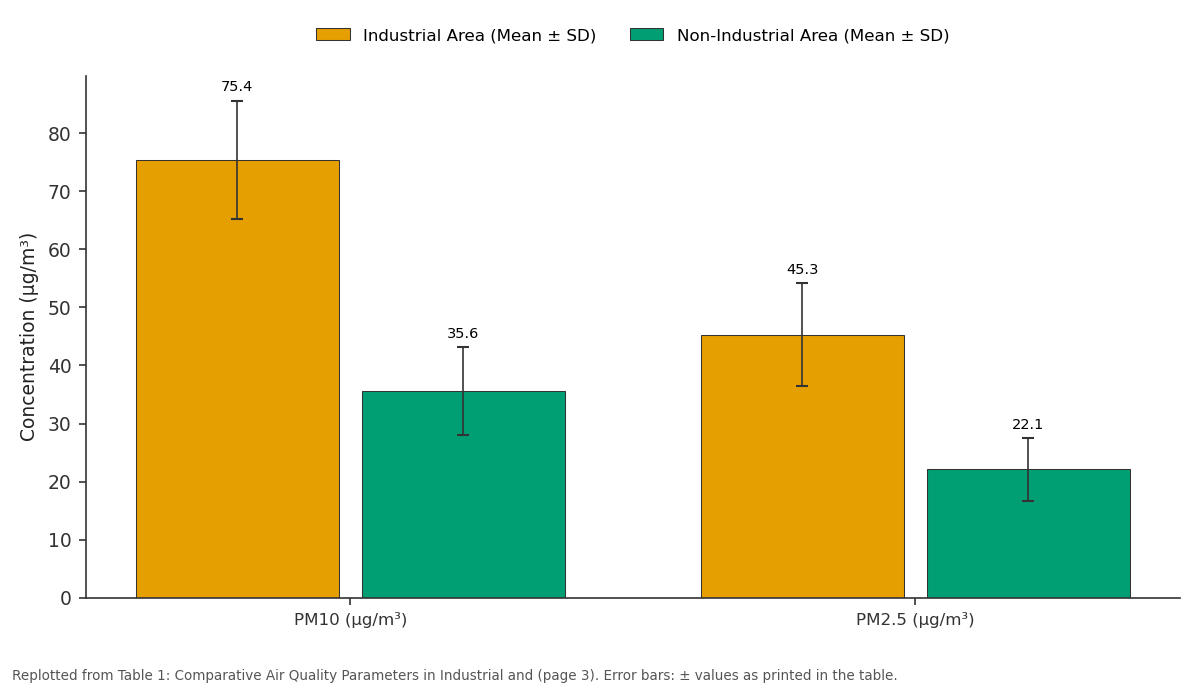
Industrial Area (Mean ± SD) and Non-Industrial Area (Mean ± SD): PM10 (µg/m³) vs PM2.5 (µg/m³)
Replotted from Table 1 (page 3) of the original paper. Every bar is the paper's own table value.
View source evidence ↗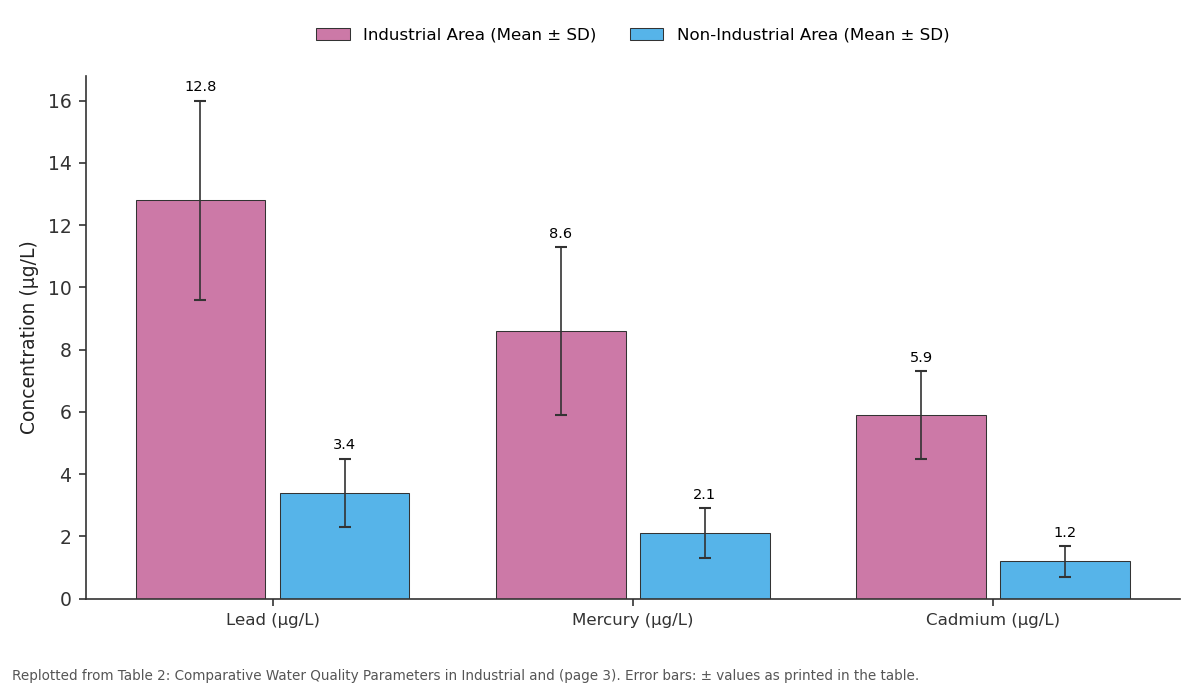
Industrial Area (Mean ± SD) and Non-Industrial Area (Mean ± SD): Lead (µg/L) vs Mercury (µg/L) vs Cadmium (µg/L)
Replotted from Table 2 (page 3) of the original paper. Every bar is the paper's own table value.
View source evidence ↗Figures & tables
From the original paper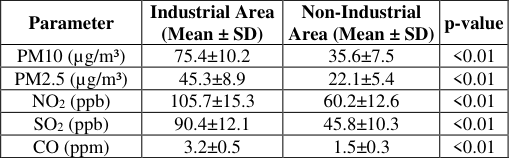 Table 1
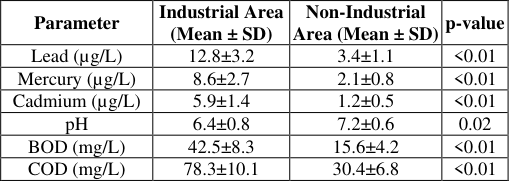 Table 2
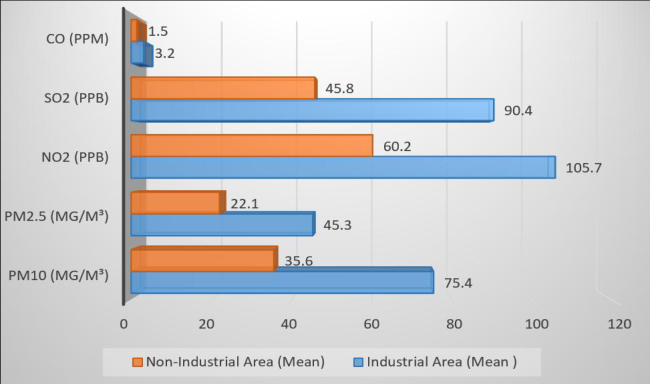 Figure 1
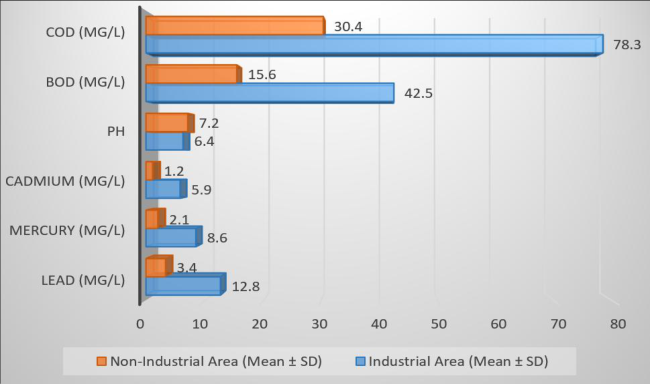 Figure 2
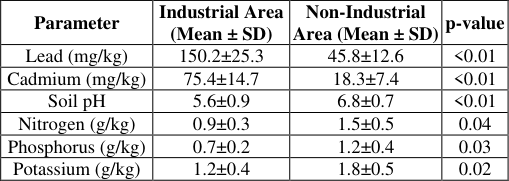 Table 3
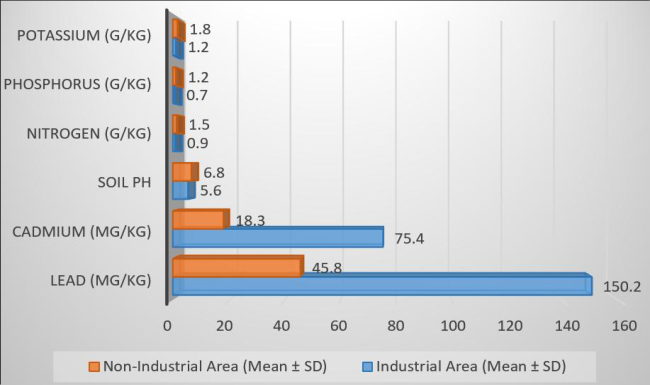 Figure 3
Introduction
Industrial landscapes are some of the most active but also the most susceptible to the environment in today's economy. Rapid industrialization, urban growth, and a growing need for manufactured goods have changed these locations a lot, often at the expense of the environment. The ecology around industrial areas, like manufacturing hubs, chemical corridors, mining belts, and mixed-use industrial estates, feels different amounts of stress when industries group together. These stressors show up as worse air and water quality, contaminated soil, less biodiversity, and higher dangers to public health. So, it's important to know how good the environment is in and around these industrial areas in order to plan for sustainable development and protect the health of the population. To figure out how good the environment is in industrial areas, you need to use a lot of data. Traditional environmental assessments frequently look at one pollutant or event at a time, but new research shows that we need to do evaluations that are systematic, comparable, and based on statistics. Researchers can figure out how bad the damage is and what kind it is in different areas by monitoring pollution levels including particulate matter (PM), sulfur dioxide (SO₂), nitrogen oxides (NOₓ), heavy metals in soil and water, and noise levels. These metrics help find places where pollution is bad, show how pollution spreads over time, and show how industrial activities affect local ecosystems. Statistical analysis aids in identifying correlations, detecting fluctuations, and comparing pollution intensity across several zones, yielding evidence-based insights for intervention. A comparison of pollution levels by zone is especially crucial now that people are more worried about the environment and laws are getting tougher. Industrial regions are not usually the same all over; separate zones may have different types of industries, follow different rules for compliance, or be closer to homes and natural resources. So, comparing these zones statistically helps us understand how different types of industries, sizes of operations, and levels of enforcement of rules affect the environment. These kinds of research also help politicians decide which areas to clean up first, how to improve monitoring, and how to design pollution-control laws that work for each area. This study on measuring environmental quality in industrial areas seeks to give a complete and statistically sound picture of pollution levels in different industrial areas. The study aims to produce meaningful insights for environmental managers, regulatory agencies, and industrial stakeholders by combining environmental monitoring with statistical methods. The ultimate goal is to create a framework that can help industrial development that is good for the environment and public health.
Review of Literature
Thu, Pham et al., (2026) [3] . The fast growth of cities, industries, and agriculture has resulted to more pollution in the air, water, and soil. This has harmed ecosystems and public health. This study evaluates the effects of environmental pollution in the coastal regions of Hai Phong, Vietnam, influenced by climate change, and suggests adaption strategies to promote sustainable development. The study employs the MIKE 21 modeling system (SW, FM, Ecolab) to simulate wave propagation, hydrodynamics, and the dispersion of pollutants (DO, BOD5, COD, TSS, Fe, and Coliform) throughout the ecosystem of the study area. The main findings of the study are (1) calibrating and validating wave, hydrodynamic, and water quality models to find the right parameter sets; (2) looking at how pollutants from major coastal industrial zones in Hai Phong will affect the area under climate change scenarios; and (3) creating an environmental pollution risk zoning map to find high-risk areas and suggest ways to adapt to make sure the study area's ecosystem continues to grow. Our results give important information that can help with pollution management in coastal ecosystems, lessen the effects of climate change, and encourage sustainable development in Hai Phong's coastal area. Cate, Mia. (2025) [2] . Industrialization, although crucial to economic advancement, has become a significant factor in environmental degradation. This study offers a thorough evaluation of industrial pollution, concentrating on the categories of pollutants emitted by many sectors and their effects on air, water, and soil ecosystems. The research classifies industrial pollutants into three principal categories: airborne emissions (such as sulfur dioxide, nitrogen oxides, and particulate matter), waterborne effluents (including heavy metals, chemical colors, and organic waste), and solid trash (comprising slag, plastics, and hazardous residues). The study shows how unregulated industrial discharge has had bad effects on the ecosystem by looking at pollution hotspots through local case studies, such as well-known events near the Bhairab River. For example, the Bhairab River has been polluted for a long time by the textile and tannery industries, which has made the water quality worse, harmed aquatic biodiversity, and caused major health hazards to the population. The effects go beyond surface water; they also affect soil fertility by leaching hazardous substances and risk groundwater quality by letting industrial poisons seep through. The results show that we need to act quickly to stop the long-term effects of industrial pollution on ecosystems and human health. This means using integrated pollution control strategies, stronger enforcement of regulations, and community-based environmental monitoring. Vashist, Mallika et al., (2024) [14] . In recent years, urban trees have become a successful nature-based way to lower air pollution levels that are rising because of urbanization and industry. This study seeks to evaluate the synergistic impact of urban trees on air quality enhancement by integrating real-time PM 2.5 monitoring with the i-Tree Eco model. The monitoring took place during both busy and quiet times, in both the tree alley and a road section without trees, in the industrial regions of the northwestern part of the National Capital Territory of Delhi, India. Using the diameter at breast height values of the tree species in the study region, the i-Tree Eco model was run to find out how well the trees could lower PM 2.5 levels. Both methods showed that urban trees may greatly lower the levels of PM 2.5 that come from driving. Consequently, it is recommended that tree plantations be incorporated into air pollution management methods in metropolitan areas characterized by elevated traffic volumes. This study investigates the preliminary correlation between trees and air quality in Delhi; however, additional research that includes measurements of local wind speed and direction might yield a more thorough comprehension of the impact of trees on air quality in severely polluted urban environments. Stefan, Sabina et al., (2013) [12] . This research aims to examine the impact of local and atmospheric circumstances on the dispersion of contaminants. Two distinct locations in Romania were selected for measurement campaigns: Surlari (44° 34', 26° 19'), situated within a forest and adjacent to a lake, and Magurele (44° 21', 26° 2'), a suburban region characterized by predominant anthropogenic activities. The same tools were used to measure PM10, NO, CO, NO 2 , and ozone at both sites. The measurements took place over 14 days in the summer of 2012. The comparison of the pollutant concentration data sets has revealed significant disparities between the two sites, particularly with surface ozone. Air quality is largely affected by natural sources of ozone and nitrogen oxides, which are caused by the surrounding environment. The lake and forest near Surlari affect the amount of ozone in the air, whereas traffic and other human activity affect the amount of SO 2 in the air in Magurele. The highest mass concentration values are almost the same for both sites, although the values at Magurele are more spread out. According to national air quality regulations, the levels of gaseous pollutants and particle matter were in the best range during the campaigns. Nikolova, Mariyana et al., (2007) [10] . Landscape characteristics affect river basin processes in numerous ways, and they may also affect environmental security and some related limitations, like extreme natural disasters, in different ways. The intricate characteristics of landscape structure and dynamics necessitate the application of a systematic, rigorous framework for their examination, specifically the DPSIR (Driving forces, Pressures, State, Impacts, and Responses) model. This method can be used at many levels of the systems, especially for environmental assessments of river basins. The goal of this study is to look at how landscape affects the PSI (Pressure, State, and Impact) relationships by using a system of landscape and hazard indicators and some tools for evaluation, such as Automated Geospatial Watershed Assessment (AGWA) and Analytical Tools Interface for Landscape Assessment (ATtILA).
Research Methodology
When data gathering started in industrial regions, the main things that were looked at were the quality of the air, water, and soil. We checked the air quality by measuring CO, NO 2 , SO 2 , and particulate matter (PM2.5 and PM10). Water quality tests looked at things like chemical oxygen demand (COD), pH, and levels of heavy metals like lead, mercury, and cadmium. To check the quality of the soil, scientists looked at the quantities of nutrients (potassium, nitrogen, and phosphorus), the presence of heavy metals, and the pH of the soil. We used descriptive statistics, such as mean, median, and standard deviation, to summarize the concentrations of pollutants for statistical analysis. T-tests were used to compare the levels of pollutants in both industrial and nonindustrial areas. Table 1 shows how the air quality in industrial and nonindustrial areas is different. The results clearly reveal that pollution levels are much greater in industrial areas. Industrial zones exhibited far higher average levels of particulate matter (PM2.5) and PM10 (75.4±10.2 µg/m³ and 45.3±8.9 µg/m³, respectively) than non-industrial areas. The p-values were less than 0.01, which means that the results were very statistically significant. In industrial areas, concentrations of nitrogen dioxide (NO 2 ), sulfur dioxide (SO 2 ), and carbon monoxide (CO) were also much higher than in non-industrial areas (105.7±15.3 ppb for NO 2 , 90.4±12.1 ppb for SO 2 , and 3.2±0.5 ppm for CO). The p-values for each group were less than 0.01. Table 2 shows that the quality of water is very different in industrial and non-industrial areas. There were a lot more heavy metals in industrial areas than in places that weren't industrial. The levels of lead, mercury, and cadmium were 12.8±3.2 µg/L, 8.6±2.7 µg/L, and 5.9±1.4 µg/L, respectively. There was a substantial statistical significance because the p-values for all three heavy metals were less than 0.01. The pH levels in industrial areas (6.4±0. As seen in Table 3, soil quality is very different in industrial and non-industrial areas. Industrial areas had far higher levels of lead (150.2±25.3 mg/kg) and cadmium (75.4±14.7 mg/kg) than non-industrial areas. In the first case, the pvalues for both lead and cadmium were less than 0.01, which means they had a very strong effect. The soil pH in industrial areas (5.6±0.9) was lower than in non-industrial areas (6.8±0.7), which means the soil was more acidic. This is shown by a p-value less than 0.01. There were fewer nutrients in industrial areas than in non-industrial areas.
| Parameter | Industrial Area (Mean ± SD) | Non-Industrial Area (Mean ± SD) | p-value |
|---|---|---|---|
| Lead (mg/kg) | 150.2±25.3 | 45.8±12.6 | <0.01 |
| Cadmium (mg/kg) | 75.4±14.7 | 18.3±7.4 | <0.01 |
| Soil pH | 5.6±0.9 | 6.8±0.7 | <0.01 |
| Nitrogen (g/kg) | 0.9±0.3 | 1.5±0.5 | 0.04 |
| Phosphorus (g/kg) | 0.7±0.2 | 1.2±0.4 | 0.03 |
| Potassium (g/kg) | 1.2±0.4 | 1.8±0.5 | 0.02 |
Table text extracted from the original PDF; superscript letters are shown inline. The original table image is below.
View original table image
| Parameter | Industrial Area (Mean ± SD) | Non-Industrial Area (Mean ± SD) | p-value |
|---|---|---|---|
| Lead (µg/L) | 12.8±3.2 | 3.4±1.1 | <0.01 |
| Mercury (µg/L) | 8.6±2.7 | 2.1±0.8 | <0.01 |
| Cadmium (µg/L) | 5.9±1.4 | 1.2±0.5 | <0.01 |
| pH | 6.4±0.8 | 7.2±0.6 | 0.02 |
| BOD (mg/L) | 42.5±8.3 | 15.6±4.2 | <0.01 |
| COD (mg/L) | 78.3±10.1 | 30.4±6.8 | <0.01 |
Table text extracted from the original PDF; superscript letters are shown inline. The original table image is below.
View original table image
| Parameter | Industrial Area (Mean ± SD) | Non-Industrial Area (Mean ± SD) | p-value |
|---|---|---|---|
| PM10 (µg/m³) | 75.4±10.2 | 35.6±7.5 | <0.01 |
| PM2.5 (µg/m³) | 45.3±8.9 | 22.1±5.4 | <0.01 |
| NO2 (ppb) | 105.7±15.3 | 60.2±12.6 | <0.01 |
| SO2 (ppb) | 90.4±12.1 | 45.8±10.3 | <0.01 |
| CO (ppm) | 3.2±0.5 | 1.5±0.3 | <0.01 |
Table text extracted from the original PDF; superscript letters are shown inline. The original table image is below.
View original table image
Data Analysis and Interpretation
Along with this, the amounts of nitrogen (0.9±0.3 g/kg), phosphorus (0.7±0.2 g/kg), and potassium (1.2±0.4 g/kg) were reduced. The p-values for nitrogen, phosphorus, and potassium were 0.04, 0.03, and 0.02, in that order. These findings show how pollution from factories makes soil less fertile, which can cause problems including less nutrient availability and greater heavy metal contamination.
Conclusion
The comparative analysis of environmental quality between industrial and non-industrial zones unequivocally illustrates the significant influence of industrial activity on air, water, and soil conditions. Industrial locations regularly showed much higher levels of main air pollutants such PM10, PM2.5, NO₂, SO₂, and CO. This shows that the air is quite polluted and could be bad for people's health. Water quality tests also showed that industrial areas had greater levels of heavy metals, higher BOD and COD values, and lower pH levels. This shows that there is a lot of chemical pollution and stress on the local water bodies. Soil quality in industrial areas was marked by higher levels of heavy metals and lower levels of nutrients. This further proves that industrial emissions and waste disposal techniques have caused a lot of damage to the environment. The statistical results, especially the constantly significant p-values, show that these differences are not random but are instead linked to industrial operations in a systematic way.
The report emphasizes the immediate necessity for enhanced regulatory enforcement, superior industrial waste management, and consistent environmental monitoring to alleviate pollution at its origin. To lessen the impact on the environment, we can make green buffer zones stronger, encourage cleaner technology, and include sustainable industrial planning. In the end, protecting the quality of the environment in industrial areas is important for both ecological sustainability and the health and well-being of current and future communities.
Figures and tables from the paper
References
15 in the original paper- Amsalu E, Wang T, Li H, Liu Y, Wang A, Liu X, et al. Acute effects of fine particulate matter (PM2.5) on hospital admissions for cardiovascular disease in Beijing, China: a time-series study. Environ Health. 2019;18(1):1-12. doi:10.1186/s12940-019-0506-2.
- Cate M. Assessment of industrial pollution. 2025.
- Chawla H, Singh SK, Haritash AK. Reversing the damage: ecological restoration of polluted water bodies affected by pollutants due to anthropogenic activities. Environ Sci Pollut Res Int. 2024;31(1):127-143. doi:10.1007/s11356-023-31295-w.
- Goyal P, Gulia S, Goyal SK. Identification of air pollution hotspots in urban areas-an innovative approach using monitored concentrations data. Sci Total Environ. 2021;798:149143. doi:10.1016/j.scitotenv.2021.149143.
- Gupta A, Bherwani H, Gautam S, Anjum S, Musugu K, Kumar N, et al. Air pollution aggravating COVID-19 lethality? Exploration in Asian cities using statistical models. Environ Dev Sustain. 2021;23(5):6408-6417. doi:10.1007/s10668-020-00878-9.
- Hama SM, Kumar P, Harrison RM, Bloss WJ, Khare M, Mishra S, et al. Four-year assessment of ambient particulate matter and trace gases in the Delhi NCR region of India. Sustain Cities Soc. 2020;54:102003. doi:10.1016/j.scs.2019.102003.
- Lu JG. Air pollution: a systematic review of its psychological, economic, and social effects. Curr Opin Psychol. 2020;32:52-65. doi:10.1016/j.copsyc.2019.06.024.
- Mainka A, Fantke P. Preschool children health impacts from indoor exposure to PM2.5 and metals. Environ Int. 2022;160:107062. doi:10.1016/j.envint.2021.107062.
- Neo EX, Hasikin K, Mokhtar MI, Lai KW, Azizan MM, Razak SA, et al. Towards integrated air pollution monitoring and health impact assessment using federated learning: a systematic review. Front Public Health. 2022;10:851553. doi:10.3389/fpubh.2022.851553.
- Nikolova M, Nedkov S, Semmens D, Iankov S. Environmental quality and landscape risk assessment in Yantra River Basin. In: Use of Landscape Sciences for the Assessment of Environmental Security. Dordrecht: Springer; 2007. p. 202-217.
- Serafini MM, Maddalon A, Iulini M, Galbiati V. Air pollution: possible interaction between the immune and nervous system? Int J Environ Res Public Health. 2022;19(23):16037. doi:10.3390/ijerph192316037.
- Stefan S, Radu C, Belegante L. Analysis of air quality in two sites with different local conditions. Environ Eng Manag J. 2013;12(2):371-379. doi:10.30638/eemj.2013.046.
- Thu P, Tri D, Nguyen H. Assessing coastal industrial pollution and climate change impacts through integrated modeling for sustainable management in Hai Phong, Vietnam. Nat Environ Pollut Technol. 2026;25(1):D1795. doi:10.46488/NEPT.2026.v25i01.D1795.
- Vashist M, Kumar T, Singh S. Assessment of air quality benefits of vegetation in an urban-industrial region of India by integrating air monitoring with i-Tree Eco model. Clean Soil Air Water. 2024;52(1):e202300198. doi:10.1002/clen.202300198.
- Yadav SK, Mishra RK, Gurjar BR. Assessment of the effect of the judicial prohibition on firecracker celebration at the Diwali festival on air quality in Delhi, India. Environ Sci Pollut Res Int. 2022;29(57):8624786259. doi:10.1007/s11356-021-17695-w.