
Research article · 2025 · Full text
International Journal of Biology SciencesThree-phased commercial culture system: A revolutionary model (3p3c) for sustainable and profitable aquaculture
Volume 7(12) · Pages 85–91 · DOI: 10.33545/26649926.2025.v7.i12b.529 ↗
Research areasAgricultural Systems and PracticesAquaculture Nutrition and GrowthInnovations in Aquaponics and Hydroponics Systems
Abstract
Author-writtenThe financial sustainability of aquaculture depends on two important aspects, production and profitability. The diminishing profit margin of farmers in agriculture and the reducing per capita land due to the burgeoning population is pivotal to trigger, a resource-specific and species-specific approach to explore the full potential of aquaculture systems. Different models to explore the production potentials of different culture systems, techniques, and species under culture, are essentially required to ensure production and profit efficiency leading to income and cost-effectiveness in aqua farming. The integration of different techniques or resources or trophic levels and intensive practices may be the key future efforts to ensure sustainability such integration has been tested by Regional Research and Training Centre (RRTC) Motipur of ICAR- Central Institute of Fisheries Education (CIFE) Mumbai and named as 3 phase 3 cycle (3P3C) Model. This model for mixed farming of fish is with 3 different phases leading 3 cycles of production in a year. In the first phase, nursery rearing is done in nursery ponds. Then, it is followed by the phase-out culture of seed to grow out stocking under intensive farming of the biofloc based culture. Finally grow out farming of carps and catfish together in mix farming in pond is done. It has led three to five times more production per year from the same area of land and water in an efficient manner. The model is useful for both the condition of flood and drought and even for overwintering of the low temperature.
Summary
Source-checkedPlain-language reading of the full paper, prepared with AI and checked against the text. Each point links to the authors' own words.
Why it matters
- Decreasing profit margins in agriculture and shrinking land availability per person are driving the need for more resource- and species-specific aquaculture approaches. View evidence ↗
- Traditional pond aquaculture is vulnerable to climate risks, including crop loss from monsoon floods and poor growth or disease during winter. View evidence ↗
- Intensive methods like biofloc can increase water and land use efficiency by 20 times or more compared to traditional methods. View evidence ↗
What they did
- The trial utilized three earthen ponds for 90-day nursery rearing, four 50,000-liter concrete tanks for biofloc rearing, and five ponds (four of 1600 sq. m and one of 900 sq. m) for mixed farming. View evidence ↗
- The experiment began with the stocking of 1.2 million mixed carp spawn and 65,000 Pangasius fry in the nursery phase. View evidence ↗
- Each culture phase was planned for 90 days, although the final grow-out phase was extended to 108 days to meet market demand. View evidence ↗
What they found
- Carps showed their highest growth in the nursery phase, with a weight gain of 11,400% and a specific growth rate (SGR) of 5.27%. View evidence ↗
- The mixed farming system produced a total of 51,908 kg of marketable fish, consisting of 6,338 kg of carp and 45,570 kg of pangasius. View evidence ↗
- The system achieved a productivity of 4.41 kg/sq. m per cycle, which translates to an estimated 13.24 kg/sq. m per year across three cycles. View evidence ↗
- A single cycle operation cost Rs. 3,808,400 and generated Rs. 5,963,400 in revenue, resulting in a net profit of Rs. 2,155,000. View evidence ↗
- The authors forecast an annual profit of Rs. 6,465,000 if three cycles are operated per year. View evidence ↗
What it means
- The model is recommended as a solution for overwintering fish in North India, where extremely low temperatures typically hinder growth. View evidence ↗
Figures & tables
From the original paper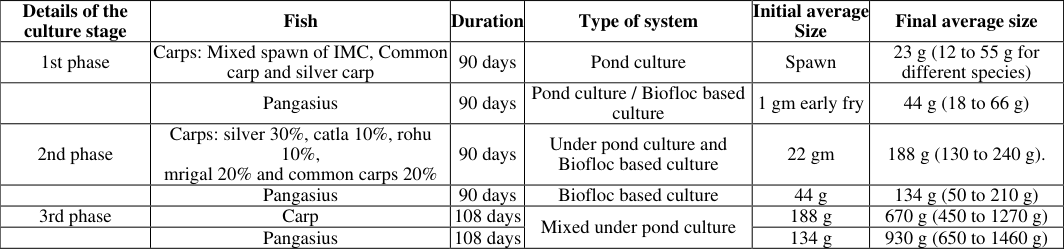 Table 1
 Table 2
 Table 3
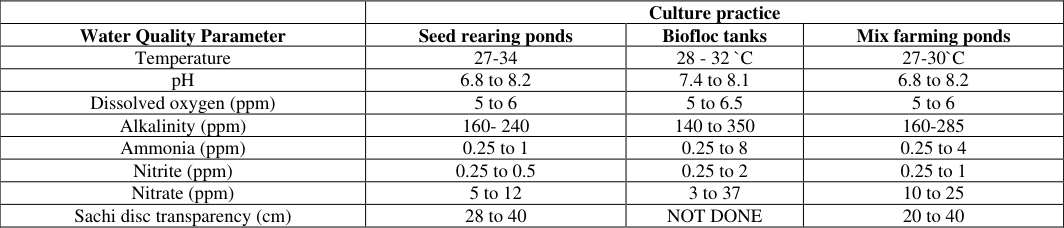 Table 4
 Table 5
 Table 6
 Table 7
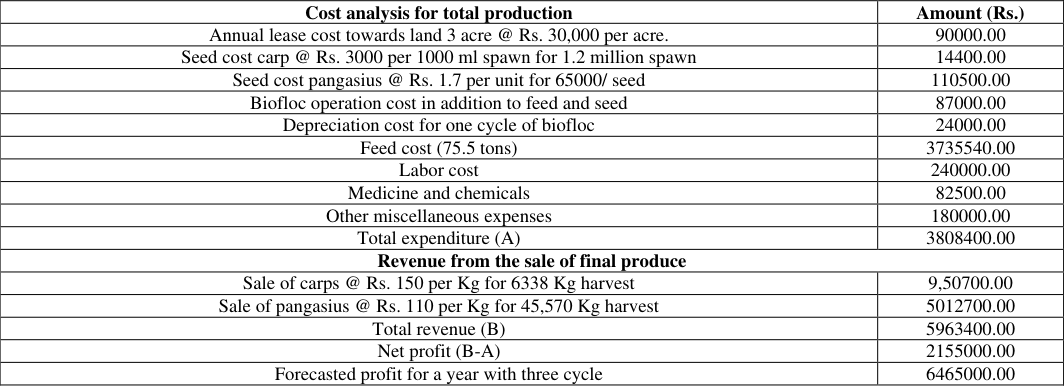 Table 8
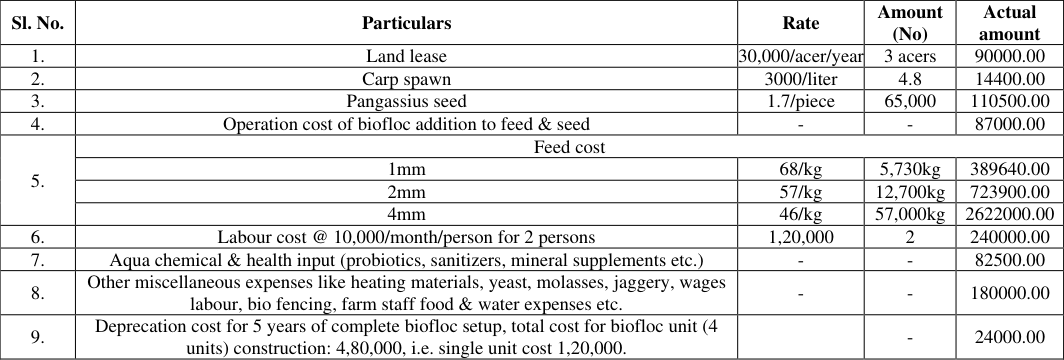 Table 9
Introduction
Aquaculture is being forecasted as the future quality nutrition provider for humans. It is the fastest-growing sector among all food production sectors (James et al., 2017). The importance of aquaculture gets more emphasis due to the bourgeoning population and reduced per capita land. It is going to be an employment engine in rural and urban areas due to its resource and technical plasticity and production efficiency. However, in the last two decades, decreasing per capita land, increasing price of the feed ingredients and other input costs, vulnerability to an extreme climate like drought and flood have raised questions on its sustainability. Therefore, the demand for climate resilient cost-effective production with improved production efficiency is being felt by the farmers. Hence, three major keys of aquaculture have production efficiency, cost-effectiveness, and sustainability are being held together, through the integration (Jamu and Piedrahita, 1917) [7] , may be of different techniques or resources or trophic levels and can be essentially viewed as a major option. Such integrations may be explored in form of different models. So that the production potentials of different culture systems, techniques and species under culture, maybe optimally utilized. These models will ensure production and profit efficiency and will lead to more income from the same piece of land and water. Additionally, it will infuse costeffectiveness in aqua farming. Carp culture in mainly practiced in Asian countries. Carps are the backbone of fin fish aquaculture practice in India and neighboring countries. The three Indian Major Carps, Catla, Rohu, Mrigal and three other exotic carps viz., silver carp, Grass carp, and Common carp contribute over 85% of the aquaculture production of the country (Ayyappan and Jena, 2003) [4] . The polyculture of carps is most preferred, where the trophic integration is practiced With the 6 to 8 selected carp species among Indian Major Carps and Chinese carps. The average production of such polyculture comes to be 10 ton per hectare in a year i. e with average productivity of 1 Kg per sq. meter. But the practical production being witnessed at the farm level lies in the range of 4 to 10 tons per hectare per year. Another fish being practiced due to its high production rate in the region is pangasius sp. It is commonly called as river or silver stripped Catfish, Sutchi catfish. This fish is endemic to the Mekong basin. It exhibits fast growth when cultured with a good feed and environment. It is third most important freshwater fish group within the aquaculture sector. Being an air-breathing fish, it can tolerate low Dissolved Oxygen (DO) content as low as 0.05 -0.10 ppm in the water and can be cultured in ponds, biofloc tanks, cages or pens. Its ability to adapt to different culture practices and production at higher stocking density are the major attraction of culturists.
The major challenge being faced in such production is the prolonged culture period for a crop almost a year. The wide seasonal variation during it from summer to monsoon and the winter lead many environmental challenges. Monsoonbased floods lead to the major risk of the entire crop being washed away during heavy rain flooding. Successively, winter poses the risk of poor growth and vulnerability to disease and mortality. However, the dependence of inland water on monsoon-based rain-fed systems gets the additional risk of uncertainty due to drought. The summer season leads to water loss from ponds and if it is followed by the poor monsoon, then it triggers drought. This creates a shift in groundwater table and so the cost-effective use of water becomes a major concern in such areas and time. Therefore, pond culture and other traditional methods of agriculture and fish culture becomes profit poor and more prone to climate induced vulnerabilities. Thus, the reduced per capita land, poor production, reduced profit and climate induced risk creates doldrum in rural income and employment. So, a large number of marginal farmers are being forced to convert in daily wages labor or migrate to the urban area in search of employment.
Pond culture is very old conventionally practiced method of fish culture globally. Pond culture require more land, the same is not available now with more than 90% rural population seeking employment. The diminishing profit margin in agriculture and reduced per capita land has set forth the way for intensive methods of aquaculture production such as biofloc. Where water and land use efficiency are being raised even 20 times or more through the intensive method. It can be operated in a small piece of land without changing land contour with specific infrastructure support. Biofloc ensures better waste management with help of microbial growth the waste of system is converted to protein-based biomass. It may be consumed by fish. Thus, the feed efficiency is increased.
The techniques can be used to raise the phased-up seed for pond-based grow-out culture. It reduces the loss of seed and increases the survival rate of fish. The overall production increases from the pond and the culture period are reduced with the integration of pond and biofloc based culture. Integration of carp culture with catfish culture and intensive biofloc based farming with pond culture has huge potential to increase the production of fish and to minimize the waste from aquatic systems. Such an integrated farming model of fish is Novel and tested at Regional Research and Training Centre (RRTC) Motipur. The Model is with 3 different phase's culture, such as in the first phase; nursery rearing is done in the pond and tank-based culture. In the 2nd phase, the phasing of seed is done to grow the bigger size seed for pond-based mix farming. The second phase stocking is done under intensive farming of the biofloc based culture. Finally, 3rd phase grow out farming of carps and catfish together in mixed farming in the pond is done. Integration of culture has been named as three phases and three cycles (3P3C) model. The model has been developed and trial has been done on farmer's ponds at a different place and for different phases with objective to access its production efficiency and cost-effectiveness.
Material and Methods
Material and Methods
Site Selection
The trials for the integrated culture of carp and pangasius in mixed farming under pond and biofloc based system was planned. The nursery rearing of pangasius and carp seed were done separately in the pond at Naj Aqua farm Thansingh Moujee District Begusarai. The area of 2,760 Sq. meter were divided in two for nursery rearing of carps and pangasius fish spawn and early fry respectively. The second phase rearing of seed was done at Biofloc unit Kanhauli Vaishali Bihar. The third phase mix farming of carps and pangasius cat fishes were done at Naj Aqua farm in earthen Ponds. The site was selected based on available facility and consent of the farmers.
Experimental Units
The three earthen ponds were used for nursery rearing of the seed for 90 days. Where the pond with 660 sq. meter and 800 sq. meter were used for the rearing of pangasius early fry collected from Naihati west Bengal and pond with 1100 sq. area were used for the rearing of carp's spawn collected from Bahery Darbhanga. The four concrete cement tanks were used for biofloc based second phase rearing of the nursed seed with 50,000 Liter water capacity each. The mixed farming of the carps and pangasius were done in 4 experimental ponds with 1600 sq. meter area each and one with 900 sq. meter. Total 65,000 Pangasius fry were used in the study for nursery. Similarly, the nursery was stocked with 1.2 million mixed carp's spawn. For the entire experimental period stocking capacity was tried to be kept at a lower side (≤ 1kg/m 3 ).
Design of Experiment and Culture Stage
Experiment was designed with the objective, to evaluate the production efficacy of different phase and culture techniques at the farm level. There were three culture phases of culture as detailed in Table 1. The first phase of nursery rearing was done in pond separately for carps and pangasius and similarly, the second phase was done separately under biofloc units for phase-out of seed to zero-point size (around 150 gm size). The third phase of grow-out mixed farming was done in earthen ponds. The three phases of culture were planned earlier for 90 days duration for each stage. However, the 3 rd phase was extended up to 108 days to catch the market demand for sale. The experimental duration was for 1 year including time for harvest and transfer of seed and fish to market. Details of species composition, the initial average size stocking, and the final average size harvest at the different stage is given also in Table 1.
| Details of the culture stage | Fish | Duration | Type of system | Initial average Size | Final average size |
|---|---|---|---|---|---|
| 1st phase | Carps: Mixed spawn of IMC, Common carp and silver carp | 90 days | Pond culture | Spawn | 23 g (12 to 55 g for different species) |
| Pangasius | 90 days | Pond culture / Biofloc based culture | 1 gm early fry | 44 g (18 to 66 g) | |
| 2nd phase | Carps: silver 30%, catla 10%, rohu 10%, mrigal 20% and common carps 20% | 90 days | Under pond culture and Biofloc based culture | 22 gm | 188 g (130 to 240 g). |
| Pangasius | 90 days | Biofloc based culture | 44 g | 134 g (50 to 210 g) | |
| 3rd phase | Carp | 108 days | Mixed under pond culture | 188 g | 670 g (450 to 1270 g) |
| Pangasius | 108 days | 134 g | 930 g (650 to 1460 g) |
Table text extracted from the original PDF; superscript letters are shown inline. The original table image is below.
View original table image
Source of Seed
For nursery rearing, 1.2 million carp spawns were collected from Mithla Hatchery Bahery Darbhanga and stocked in 1100 sq. ft./area. The pangasius early fry 1 gm (1000 Line) were collected from Naihati Kolkata West Bengal. These nursery reared seeds were used in second stage for seed phase out culture and gradually the phased-out seed were used for mix farming in third stage.
Feed and Feeding Methods
For carp nursery rearing stage, the pond-based culture was done and pond were well fertilized by cow dung compost (600 Kg) and mustard oil cake (20 Kg) 3 days before stocking of spawn. After stocking of spawn 5 Kg Mustard oil cake and 40 Kg, cow dung slurry was applied daily for earlier 10 days to ensure mixture zooplankton. Later on, the moist 2 mm pellet (10 Kg) and mustard oil cake (10 Kg) mix was applied divided in four times ration daily for a period of 1 month. Later 2 mm moisten pellets were applied at a 3% ration of total biomass. For nursery rearing of pangasius, the early fries were stocked in the well managed and fertilized pond. The feeding of 2 mm pellet and MOC were done four times in a day at a rate of 12% ration at starting days, which gradually of a period of 15 days reduced to 5%.
During the seed phase-out culture, fishes were fed with 2 mm commercial pellets, during first 40 days and later on the 4 mm commercial pellets were used till 90 days culture. In biofloc based second stage of seed phase-out culture, no manuring or fertilization were practiced, only commercial pellets were fed ad libitum. In the third stage of grow-out fish production in mixed farming, the 4 mm commercial pellets with 28% crude protein were fed for earlier 78 days at 3% ration in two feed frequencies. Later on, mixed feeding of 4 mm pellets with 28% and 24% crude protein were done at ratio of 1: 1 in the same ration and frequency. Finally, after 90 days only 24% protein commercial pellets were fed at 2% ration.
Feed Composition
The nutritional details of commercial pellets and the MOC were used for fish feeding during the farm experimental trial is detailed in (Table No. 3). The 6 samples of pellets in the different lots were taken and analyzed for the proximate composition. The samples of all feed in three different stages of farming were done for every 100 bags. The 4 mm pellets were in 40 Kg and 2 mm in 20 Kg bag size. The proximate composition of the experimental feed was determined using the standard methods of AOAC (1995) [2] for moisture, crude protein (CP), fat, crude fiber (CF), and total ash (TA). Moisture was determined by drying samples in an oven at 102 o C till constant weight. The CP and fat content were determined using an automated Kjeldahl (Kelplus, PELICAN, India) and Soxhlet apparatus (Model SD2, 1045, PELICAN, India), respectively. The TA content was determined by burning the samples in a muffle furnace (WIT; C and L Tetlow, Australia) at 550 o C for 6 h. The CF of the diets was determined by Fibre tech (Tulin equipment, India).
Growth Sampling/Monitoring of Fish Growth
Growth Sampling was done at intervals of 30 days to assess the body weight of the fishes. Fishes were starved overnight prior to sampling. 50 randomly selected fish from each pond or tank was collected (n = 50), anesthetized by using clove oil (50 μl/L) and the individual body weight was measured using an electronic balance and length by using a measuring scale.
Water Quality Parameter
Water quality parameter of the fish farming was weekly tested in pond-based culture of first phase i.e nursery rearing and in Biofloc based second phase culture. Daily water quality parameters were analyzed by using the test kit. The seven parameters temperature, dissolved oxygen, PH, alkalinity, total ammonia, nitrite, and nitrate were tested to ensure the proper water quality. For biofloc based culture additionally, total dissolved solids (TDS) and floc density were tested. For pond-based culture level of plankton was tested with secchi disk. The water temperature was measured using a thermometer (MERCK, Germany), water pH by pH probe (HANNA Instruments, Singapore), and salinity with a refractometer (Atago, Tokyo, Japan). Dissolved oxygen concentration, alkalinity (APHA, 2005) [3] . Ammonia-N, nitrite-N, nitrate-N were determined using a commercial test kit (Spectroquant NOVA-MERCK, Germany).
Economic Analysis
Trial was performed in the field at the farmer's level, so all input parameters were recorded, and these were clubbed into two groups: variable costs, which included land lease costs, seed costs, feed costs, operational costs for biofloc units, labour medicine, & other miscellaneous costs, etc. Additionally, fixed costs of capital & construction were taken as depreciation, as total cost divided by one crop, with an assumption of the life of infrastructure created. Data on total production, and sell prices were taken as an average price, during the selling period. Economic parameters like total venue, net profit per crop. Benefits cost ratio (BCR), total revenue & profit yearly per & crops were analyzed, as per the as mention below:
Total input cost: Total input cost was calculated as sum of, lease cost, seed cost, feed cost, operational cost of biofloc, labour, medicine, other miscellaneous cost including the deprecation cost of infrastructure for a crop (Cost detailed in Table. 9).
Total Revenue: It is some of total production multiplied by respective sell price species wise.
Growth Performance and Feed Utilization
Parameters related to growth and nutrient utilization were calculated using standard formula. The growth, weight gain% and SGR of fishes under different growth phase were calculated for Carps and Pangassius.
Weight gain (%) = [(final weight-initial weight)/initial weight] ×100; SGR (%) = [ln (Final weight) -ln (Initial weight)/ [no. of days] ×100; Feed conversion ratio (FCR) = {feed consumption (g on dry weight basis)/body weight gain (g on wet weight basis)}.
Statistical
The Statistical analysis for the different feed performances and the growth parameters of the fish, were done by funding mean & normality. The mean average values were analyzed using one-way analysis of variance (ANOVA) via SPSS 16.0 for Windows. All data presented in the text, figures, and tables are means ± standard error and statistical significance for all statistical tests were set at (p<0.05).
Results
The present study was carried out in three phase of nursery rearing, seed phase out and final table size fish grow-out phase. Earlier two stages were carried out for 90 days period and the third stage were carried out for 108 days. The water quality parameter and growth parameter and feed performance parameters like FCR, FCE were studied. The overall production and economic analysis were performed to understand the efficiency of the 3P3C Model.
Phases of Culture
The obtained stocking (Kg/ cubic meter) of the farm trial for different phases of culture was calculated and is presented in (Table No. 2). The initial stocking density for the nursery phase was not done for spawn and for pangasius it was 0.04 (Kg/m 3 ). Similarly, the initial stocking density for seed phase out the culture of 90 days was 0.32 (Kg/m 3 ) for carps and 11.32 (Kg/m 3 ) for pangasius and it was 0.37(Kg/m 3 ) for carps and 1(Kg/m 3 ) for pangasius in final table size growout phase of mix farming. The final stocking density during the harvest was calculated to access the carrying capacity of the system. It was recorded 2.0 (Kg/m 3 ) for carps and 1.6 (Kg/m 3 ) for pangasius in nursery rearing. Similarly, in seed phasing, it was 1.4 (Kg/m 3 ) in ponds for carps and 34.84 (Kg/m 3 ) in Biofloc tanks for pangasius and 12 (Kg/m 3 ) for mix carps and pangasius Biofloc based rearing. The final stocking density of the grow-out culture was 0.87 (Kg/m 3 ) for carps, 6.24 (Kg/m 3 ) for pangasius, and together in mix farming, it was 7.11 (Kg/m 3 ).
Commercial Feed Pellets and the Moc Proximate Composition
After the proximate composition analysis of the commercial pellet and mustard oil cake used in the farm trial, crude protein, fat, moisture, ash, and fiber percentage in 2 mm size were, 32%, 5%, 12%, 7%, and 8% respectively. Similarly, crude protein and the 4 mm pellets had 28% crude protein, 4% lipid, 11% moisture 7% crude fiber, and 8% ash content.
Exclusively the 4 mm pellets of low crude protein 24% and 12% were used in the late stage of mixed farming to reduce the ammonia load being released from the system. The MOC used in nursery rearing was for increasing zooplankton production as well as a feed for baby fish. MOC had 34% crude protein and 6% fat. 13% moisture and 8% fiber (Table 3).
| Feed Composition | Crude Protein (%) | Fat (%) | Moisture (%) | Ash (%) | Fibre (%) |
|---|---|---|---|---|---|
| 2 mm | 32±0.06 | 5±0.03 | 12± 0.14 | 7±0.11 | 8±0.13 |
| 4 mm | 28±0.08 | 4±0.03 | 11±0.12 | 8±0.08 | 7± 0.21 |
| MOC | 34±0.05 | 6±0.02 | 13±0.14 | 6.±0.12 | 8±0.11 |
Table text extracted from the original PDF; superscript letters are shown inline. The original table image is below.
View original table image
Water Quality Parameter
The studied water quality parameter was found to be in the normal range at most of the time. However, the occasional surges in ammonia were noticed in Biofloc tanks and pondbased mix farming (Table 4). Ammonia and nitrite were found to be at higher side at the later stage of the biofloc tank-based culture. Each stage was carried out for 90 days period. Excluding occasional surges in ammonia in the pond ammonia and nitrite were found to be higher side at the later stage of the biofloc tank-based culture.
| — | Culture practice | — | — |
|---|---|---|---|
| Water Quality Parameter | Seed rearing ponds | Biofloc tanks | Mix farming ponds |
| Temperature | 27-34 | 28 - 32 `C | 27-30`C |
| pH | 6.8 to 8.2 | 7.4 to 8.1 | 6.8 to 8.2 |
| Dissolved oxygen (ppm) | 5 to 6 | 5 to 6.5 | 5 to 6 |
| Alkalinity (ppm) | 160- 240 | 140 to 350 | 160-285 |
| Ammonia (ppm) | 0.25 to 1 | 0.25 to 8 | 0.25 to 4 |
| Nitrite (ppm) | 0.25 to 0.5 | 0.25 to 2 | 0.25 to 1 |
| Nitrate (ppm) | 5 to 12 | 3 to 37 | 10 to 25 |
| Sachi disc transparency (cm) | 28 to 40 | NOT DONE | 20 to 40 |
Table text extracted from the original PDF; superscript letters are shown inline. The original table image is below.
View original table image
Growth Parameter
The growth parameter studied such as weight gain% and specific growth rate were found to be highest in the nursery phase for carps. Weight gain% and specific growth rate of 11,400% and 5.27% respectively were reported in the nursery phase which gradually decreased in the later stage. The percentage of survival was quite low 8% in the nursery phase, 78% in the seed phase out and 80% in the final grow-out stage. The total production of 2300 Kg was achieved in the nursery phase and finally grow out mix farming recorded the 6338 Kg production. The FCR obtained in the nursery and seed phase-out seed phase were 1.19 and 1.81 respectively (Table 5). Similarly, pangasius received the best growth rate in terms of weight gain percentage in the nursery stage. Grow out stage-specific growth rate was found to be 2.15. However, the biofloc based tank rearing of seed for phase-out given average SGR 1.23 (Table 6). The overall production of 45,570 Kg was obtained in the mixed farming system (Table 7). However, the highest stocking density was achieved in tank-based rearing under a Biofloc based system (Table 2). During the trial average, FCR recorded were 1.29 and 1.44 in nursery and seed phase-out rearing respectively (Table 6).
| Overall production details | Values |
|---|---|
| Carps production (Kg) | 6338.00 |
| Pangassius production (Kg) | 45570.00 |
| Total production (Kg) | 51908.00 |
| Total area under culture (Sq. m) ) | 11760.00 |
| Over all total feed used (Kg) | 75430.00 |
| Overall FCR for entire farm as one operation | 1.45 |
| Per unit area production efficacy (Kg per Sq. metre ) | 4.41 |
| Production efficacy for 3 Cycle operation in a year (Kg per Sq. meter) | 13.24 |
Table text extracted from the original PDF; superscript letters are shown inline. The original table image is below.
View original table image
| Stage of culture | WG% | SGR% | Survival | Initial Biomass | Final Biomass | Feed consumed | FCR | FCE |
|---|---|---|---|---|---|---|---|---|
| Nursery rearing S1 | 4300.00 | 4.20±0.29 | 0.86 | 65.30 | 2464.00 | 3100.00 | 1.29 | 0.77 |
| Seed phase out G1 | 204.55 | 1.23±0.02 | 0.93 | 2464.00 | 6968.00 | 6300.00 | 1.40 | 0.71 |
| Grow out G2 | 594.02 | 2.15+0.19 | 94.23 | 6968 | 45570 | NA | NA | NA |
Table text extracted from the original PDF; superscript letters are shown inline. The original table image is below.
View original table image
| Stage of culture | Weight gain (WG%) | SGR% | Survival | Initial Biomass | final Biomass | Feed Consumed | FCR | FCE |
|---|---|---|---|---|---|---|---|---|
| Nursery rearing S1 | 11400 | 5.27± 0.31 | 8% | 14.8 | 2300 | 2730 | 1.19 | 0.83 |
| Seed phase out G1 | 717.39 | 2.34±0.09 | 78% | 340 | 2218 | 3400 | 1.81 | 0.55 |
| Grow out G2 | 256.383 | 1.27+0.2 | 80.16 | 2218 | 6338 | NA | NA | NA |
Table text extracted from the original PDF; superscript letters are shown inline. The original table image is below.
View original table image
| Stage of culture | Carps (Kg/m3) | Pangasius (Kg/m3) | Mixed farming (Kg/m3) |
|---|---|---|---|
| Initial stocking densities | |||
| Nursery phase (S) | ND | 0.04 | Not done |
| Phase out seed (G1) | 0.31 | 11.32 | Not done |
| Grow-out culture (G2) | 0.37 | 1 | 1.37 |
| Final stocking densities | |||
| Nursery phase (S) | 2.0 | 1.62 | 0 |
| Phase out seed (G1) | 1.4 | 34.84 | 12 |
| Grow-out culture (G2) | 0.87 | 6.24 | 7.11 |
Table text extracted from the original PDF; superscript letters are shown inline. The original table image is below.
View original table image
Production
The final stage of mixed farming of carp and pangasius gave better results in terms of growth and production efficiency. The total production of marketable size carp was 6338 Kg and pangasius 51,908 Kg. Overall productivity obtained for 90 days cycle was 4.41 and for the 3 cycles of the operation may give 13.24 Kg/ sq. m area per year production. However, the overall FCR for one farm cycle was 1.44 (Table No. 7).
Cost and Profit Analysis
The cost analysis for total production was done by considering the annual lease cost towards land, seed of carp, pangasius seed, biofloc operational cost, depreciation cost of biofloc set up, feed, labour, medicine, and chemicals, and other miscellaneous items Rs. 90,000, Rs.14, 400, Rs. 110,500, Rs. 87,000, Rs.24,000, Rs. 2980,000, Rs. 240,000, Rs. 82,500, Rs.180,000 respectively. Thus, the total expenditure amounted Rs. 3808,400 for one cycle operation. However, the revenue from sale of final produce of grow out phase were Rs. 950,700 from sale of carps and Rs. 5012,700 from sale of pangasius amounting total revenue of Rs. 5963,400. Thus, the net calculated profit was Rs. 2155,000 for a crop and the forecasted profit per year for 3 cycle of operation was Rs. 6465,000.
Discussion
The farm trial of integration of three phases of nursery rearing, seed phase-out, and final table size fish grow-out phase was planned to get the improved production efficiency and income of the farmers. Therefore, along with growth parameters, overall production, and economic analysis were performed to understand the efficiency of the 3P3C Model. The integration of different aquaculture practices such as biofloc and pond and mixed farming of carps and pangasius gave the way to operate the culture at its higher carrying capacity in terms of stocking density. The calculated stocking densities are presented in Table No. 2. The final stocking density during the harvest was calculated to access the carrying capacity of the system. It was recorded 2.0 (Kg/m 3 ) for carps and 1.6 (Kg/m 3 ) for pangasius in nursery rearing, which was the impact of better management practice in ponds. Similarly, the biofloc gave overall better production of seed phasing, it was 1.4 (Kg/m 3 ) in ponds for carps, 34.84 (Kg/m 3 ) in Biofloc tanks for pangasius and 12 (Kg/m 3 ) for mix carps and pangasius biofloc based rearing. The final stocking density of the grow-out culture was 0.87 (Kg/m 3 ) for carps, 6.24 (Kg/m 3 ) for pangasius, and together in mixed farming, it was 7.11 (Kg/m 3 ). The integration led to better use of feed and utilization of feed-based primary production by carps. After the proximate composition analysis of the commercial pellet and mustard oil cake used in the farm trial, the evaluated crude protein, fat, moisture, ash, and fiber percentage reflected the optimal nutritional quality of feed used. Exclusively the 4 mm pellets of low crude protein 24% and 12% were used in the later stage of mixed farming to reduce the ammonia load being released in the system for better water quality. Proximate composition was done to test the commercially supplied feed to confirm that given species of feed is fixed as per the details provide. All water quality parameters were found to be in the normal range most of the time. The fortnightly water exchange performed in mixed farming was aimed at the release of additional organic load. The excess plankton and organic load in the general ponds system limit production of pangasius but in the present study, it was under control due to the integration of carp (Anderson, 1987) [1] . Generally during the conventional pond-based culture, the fingerling is raised to table size fish so for almost more than half of the period the entire pond or culture system remains under its maximum potential. Therefore, the present study was targeted to use the optimum culture potential throughout the year. So, the three phases of culture like nursery rearing, seed phase-out, and final table size fish grow were integrated under different practices of semiintensive pond culture and intensive Biofloc based culture. To ensure the maximum sustainable production, carps and pangasius were under mixed farming aquaculture. The mixed farming gave the encouraging result in terms of the waste from pangasius feed became the direct feed for bottom-dwelling carps and released ammonia along with such waste gave the boost to plankton production. The later was well utilized by the planktivorous fishes like silver carps. In the growth parameter, the bottom-dwelling carps and the silver carps had better growth. Another advantage noticed that in mixed farming continuous vertical movement of pangasius led the better circulation of water and oxygen levels by breaking thermal stratification in ponds. Because in carp ponds thermal stratification leads to dissolved oxygen problems and fish loss (Chowdhury et al., 2014) [5] . The growth and feed performance parameters studied FCR and FCE were found better and support weight gain in a different phase of culture.
The growth parameter such as weight gain% and specific growth rate were found to be highest in the nursery phase for carps and pangasius. Similarly, the grow-out stagespecific growth rate was found to be 2.15 for pangasius. However, pangasius the Biofloc based tank rearing of seed for phase-out given average SGR 1.23 and better survival. Studied SGR in different phase shows the higher SGR at the early life stage of fishes. However, the better survivals indicate advantage of biofloc based seed rearing. The overall production of pangasius (45,570 Kg) obtained in the mixed farming system is an indication of better production potential under the system. However, the highest stocking density was achieved in tank-based rearing under a Biofloc based system. The final stage of mixed farming of carp and pangasius had given better results in terms of growth and production efficiency. As detailed in Table No.7, the total production of marketable size fish was 51,908 Kg (included carp 6,338 Kg and pangasius 45,570 Kg). Overall productivity obtained for 108 days was 4.41 and for the 3 cycles of the operation may give 13.24 Kg/ sq. m area production. However, the overall FCR for one farm cycle was 1.44 9 (Table No. 7). It clearly emphasizes upon production efficiency of the integrated system. The efficiency on yearly basis increased 5 to 6 times compared to conventional cultural practices. Thus, it gives impetus to increase farmers' profit to an average of five times from the same land and infrastructure. The experimental trial was done at the farmer's level in form of a demonstration. There were no capitals or fixed costs associated to be considered. So, for the fixed asset either lease amount for a cycle of operation and the depreciation on fixed infrastructure was considered along with other operating costs such as seed, feed, labor, medicines and chemicals, and other miscellaneous costs. The total expenditure for one cycle of operation was 38.08 lakhs. The major revenue obtained 59. 63 lakh rupees were from the sale of table-size fish after pond-based mix farming. It resulted in a net profit of 21.55 lakh rupees from one cycle operation. However, it may be forecasted that 3 such cycles in the 3P3C model, will result in around 64.65 lakhs rupees profit from the same area per year (Table No. 8). Thus, it is evident that production and profit efficiency from the same area can be raised to around 5 times and the 3P3C model may work as a key for increasing farmer's income in the country. Cost analysis for total production Amount (Rs.) Annual lease cost towards land 3 acre @ Rs. 30,000 per acre. 90000.00 Seed cost carp @ Rs. 3000 per 1000 ml spawn for 1.2 million spawn 14400.00 Seed cost pangasius @ Rs. 1.7 per unit for 65000/ seed 110500.00 Biofloc operation cost in addition to feed and seed 87000.00 Depreciation cost for one cycle of biofloc 24000.00 Feed cost (75.
Conclusion
The 3 phase 3 cycle (3P3C) Model for mixed fish farming is with 3 different phases. In the first phase nursery rearing is done in nursery ponds. Then it is followed by the phase-out culture of seed to grow out stocking under intensive farming of the biofloc based culture. Finally grow out farming of carps and catfish together in mix farming in a pond is done. Each of the three phases is for three months and so the 3 cycles of the operation are repeated in grow-out giving the three crops in a year. The model helps to be useful for both the condition of flood and drought. In the flood-prone and drought uncertain areas, the flood, and drought periods can be surpassed in the intensive culture mode. Similarly, it gives a better solution for overwintering of the extremely low temperature in North India. As the winter season is quite unproductive in respect to fish culture as fish drop eating and finally the growth and health of fish get compromised. The phased-out seed for growing out through Biofloc will create a production boost in the open area of wetlands, in pens, cages, or even in large bodies such as reservoirs.
Acknowledgement
AcknowledgementWe put our sincere acknowledgement and thanks to Mr. Abhishek Kumar Kanhauli for Biofloc tank-based infrastructure and Mr. Ekramul, Naj Aqua for extending the pond facility for the trial. We put our thanks and gratitude to the Director ICAR -CIFE Mumbai for time-to-time support and facility.
Figures and tables from the paper
| Cost analysis for total production | Amount (Rs.) |
|---|---|
| Annual lease cost towards land 3 acre @ Rs. 30,000 per acre. | 90000.00 |
| Seed cost carp @ Rs. 3000 per 1000 ml spawn for 1.2 million spawn | 14400.00 |
| Seed cost pangasius @ Rs. 1.7 per unit for 65000/ seed | 110500.00 |
| Biofloc operation cost in addition to feed and seed | 87000.00 |
| Depreciation cost for one cycle of biofloc | 24000.00 |
| Feed cost (75.5 tons) | 3735540.00 |
| Labor cost | 240000.00 |
| Medicine and chemicals | 82500.00 |
| Other miscellaneous expenses | 180000.00 |
| Total expenditure (A) | 3808400.00 |
| Revenue from the sale of final produce | |
| Sale of carps @ Rs. 150 per Kg for 6338 Kg harvest | 9,50700.00 |
| Sale of pangasius @ Rs. 110 per Kg for 45,570 Kg harvest | 5012700.00 |
| Total revenue (B) | 5963400.00 |
| Net profit (B-A) | 2155000.00 |
| Forecasted profit for a year with three cycle | 6465000.00 |
Table text extracted from the original PDF; superscript letters are shown inline. The original table image is below.
View original table image
| Sl. No. | Particulars | Rate | Amount (No) | Actual amount |
|---|---|---|---|---|
| 1. | Land lease | 30,000/acer/year | 3 acers | 90000.00 |
| 2. | Carp spawn | 3000/liter | 4.8 | 14400.00 |
| 3. | Pangassius seed | 1.7/piece | 65,000 | 110500.00 |
| 4. | Operation cost of biofloc addition to feed & seed | - | - | 87000.00 |
| 5. | Feed cost | |||
| 1mm | 68/kg | 5,730kg | 389640.00 | |
| 2mm | 57/kg | 12,700kg | 723900.00 | |
| 4mm | 46/kg | 57,000kg | 2622000.00 | |
| 6. | Labour cost @ 10,000/month/person for 2 persons | 1,20,000 | 2 | 240000.00 |
| 7. | Aqua chemical & health input (probiotics, sanitizers, mineral supplements etc.) | - | - | 82500.00 |
| 8. | Other miscellaneous expenses like heating materials, yeast, molasses, jaggery, wages labour, bio fencing, farm staff food & water expenses etc. | - | - | 180000.00 |
| 9. | Deprecation cost for 5 years of complete biofloc setup, total cost for biofloc unit (4 units) construction: 4,80,000, i.e. single unit cost 1,20,000. | - | 24000.00 |
Table text extracted from the original PDF; superscript letters are shown inline. The original table image is below.
View original table image
References
7 in the original paper- Anderson JM. Production and decomposition in aquatic ecosystems and implications for aquaculture. In: Moriarty DJW, Pullin RSV, editors. Detritus and microbial ecology in aquaculture. Manila, Philippines: ICLARM; 1987. p. 1-420.
- AOAC. Official methods of analysis. 16th ed. Arlington (VA), USA: Association of Official Analytical Chemists; 1995.
- APHA, AWWA, WEF. Standard methods for the examination of water and wastewater. 21st ed. Washington (DC), USA: American Public Health Association; 2005. p. 258-259.
- Ayyappan S, Jena JK. Grow-out production of carps in India. Journal of Applied Aquaculture. 2003;13(34):251-282.
- Chowdhury AS, Hasan K, Alam K. The use of an aeration system to prevent thermal stratification of water bodies: pond, lake and water supply reservoir. Applied Ecology and Environmental Sciences. 2014;2(1):1-7. doi:10.12691/aees-2-1-1.
- Anderson JL, Asche F, Garlock T, Chu J. Aquaculture: Its role in the future of food and international food security. Frontiers of Economics and Globalization. 2017;17:159-173. doi:10.1108/S1574871520170000017011.
- Jamu DM, Piedrahita RH. Aquaculture pond modelling for the analysis of integrated aquaculture/agriculture systems: fishpond organic matter and nitrogen dynamics. Interim work plan, DAST Study 5. Data analysis and synthesis. Fourteenth annual technical report; 1917.