
Research article · 2025 · Full text
International Journal of Geography Geology and EnvironmentAssessment of Radon Gas Concentrations in Groundwater in Rural Kufa
Volume 7(12) · Pages 25–27 · DOI: 10.22271/27067483.2025.v7.i12a.454 ↗
Research areasRadioactivity and Radon MeasurementsGroundwater and Isotope GeochemistryRadioactive contamination and transfer
Abstract
Author-writtenThis study assessed radon gas concentrations in groundwater in rural Kufa, Iraq, to evaluate potential radiological risks to the local population. Radon is a radioactive gas that is naturally produced when uranium-238 decays through radium-226. It is a chemically inert substance, stable in water, and has the capacity to migrate out of rocks and soils into ground water. Humans are primarily exposed by ingestion and inhalation, respectively. Ingestion by supplying an exposome of internal radiation dose organs, whereas inhalation is recognized as the major pathway wherein radon is translocated from water to the indoor air compartment during domestic activities, such as drinking, cooking, and bathing. Radon exposure increases the risk of contracting lung cancer, which is how the temptation of radon in drinking water is considered both a direct health risk and an indirect health risk. Ground water samples have been collected from few shallow and medium-depth wells (total samples - 15). Well discharge pipes were used to build tight containers for water collection, by preventing radon loss from the container. The RAD7 device measurements of radon concentrations made using the Wat-250 protocol. The range of radon concentrations was between 2.4 and 4.2 Bq/L with an average of 3.2 Bq/L and this variation was due to local lithology, uranium content, water–rock interaction, and groundwate flow[7]. Spatial variability was limited, aquifer material contained negligible uranium, and groundwater was not a radiological health risk as shown by all values being substantially below the US EPA guideline of 11.1 Bq/L. The radon concentration in ground water of rural Kufa is safe for domestic use. The study suggests that regular monitoring over time should be performed to identify long-term influences on radon concentrations in the groundwater due to geological or hydrological changes that could expose populations to radon and, therefore, affect health.
Summary
Source-checkedPlain-language reading of the full paper, prepared with AI and checked against the text. Each point links to the authors' own words.
Why it matters
- Radon is a naturally occurring radioactive gas resulting from the decay of uranium-238 via radium-226. View evidence ↗
- Human exposure to radon occurs primarily through two pathways: ingestion and inhalation. View evidence ↗
- Exposure to radon is associated with an increased risk of lung cancer, making its presence in drinking water a direct and indirect health hazard. View evidence ↗
The question
- The study aims to evaluate the concentrations of radon in water wells located in the rural areas of Kufa City. View evidence ↗
What they did
- To prevent radon loss, samples were stored in 250 mL airtight containers without air bubbles. View evidence ↗
- Radon concentrations were measured using the RAD7 system via alpha spectroscopy following the Wat-250 protocol for four cycles per sample. View evidence ↗
What they found
- The measured radon concentrations in the groundwater ranged from 2.4 to 4.2 Bq/L, with an average value of 3.2 Bq/L. View evidence ↗
- The highest radon concentration was 4.2 Bq/L (Sample 9) and the lowest was 2.4 Bq/L (Sample 3). View evidence ↗
- All measured radon levels were significantly lower than the US EPA and WHO guideline limit of 11.1 Bq/L. View evidence ↗
- The narrow range of concentrations suggests low spatial variability and a similar hydrogeological setting across the sampled area. View evidence ↗
- The results indicate that the aquifer materials have low uranium content and conditions that do not favor radon accumulation. View evidence ↗
What it means
- The authors conclude that the groundwater in rural Kufa is safe for domestic use as it meets international safety guidelines. View evidence ↗
- The authors recommend long-term regular monitoring to detect potential changes in radon levels caused by geological or hydrological processes. View evidence ↗
Visual summary
2 visualsIllustrations explain the paper; charts are replotted from the paper's own table values.
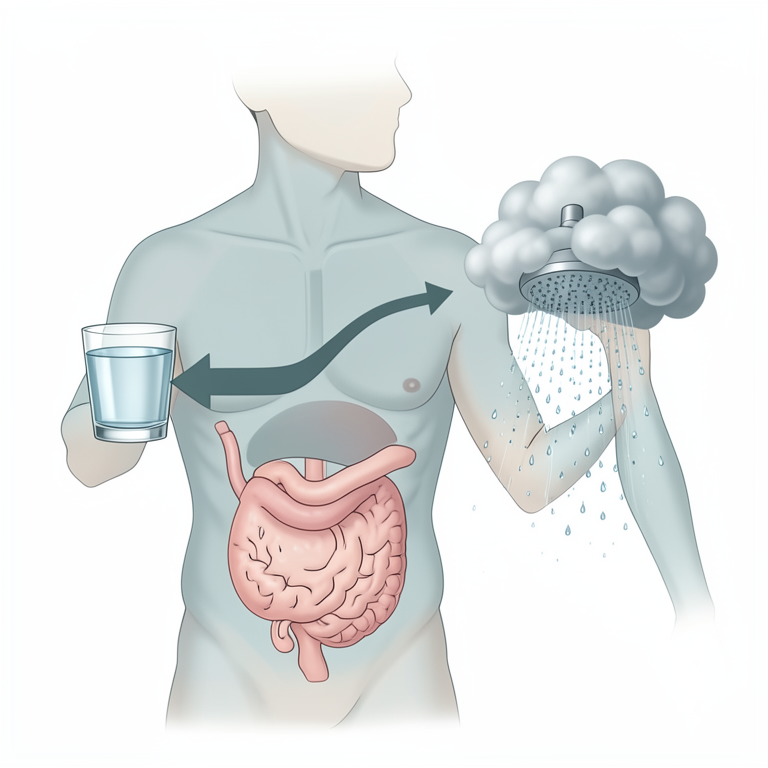
Radon Exposure Pathways
AI-generated conceptual illustration (human respiratory and digestive systems). It explains the idea and does not show study data.
View source evidence ↗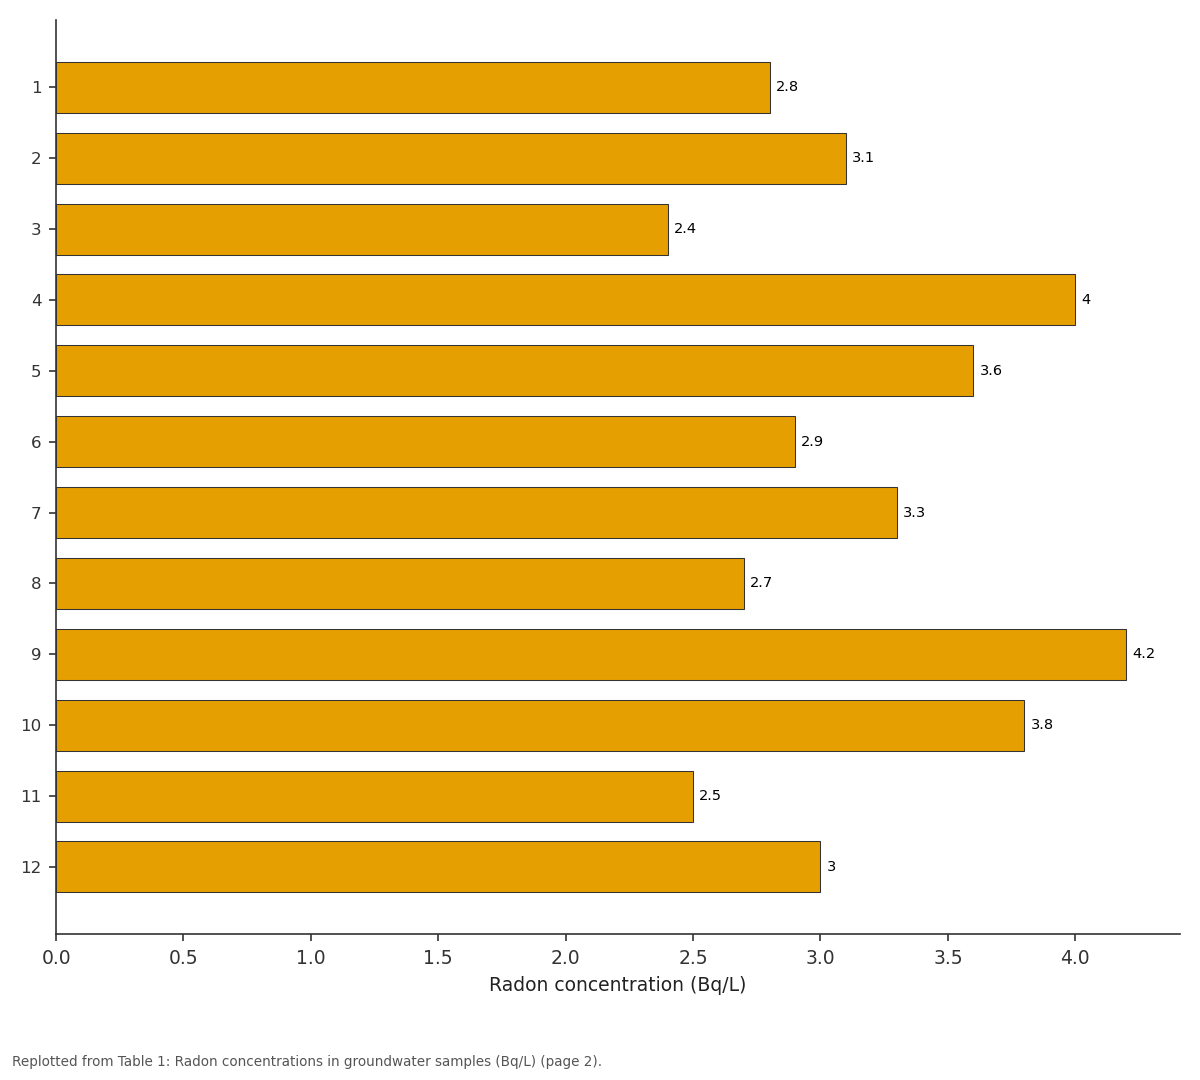
Radon concentration (Bq/L): 1 vs 2 vs 3 vs 4 vs 5
Replotted from Table 1 (page 2) of the original paper. Every bar is the paper's own table value.
View source evidence ↗Figures & tables
From the original paper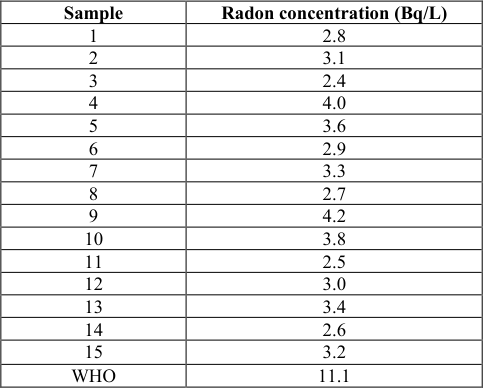 Table 1
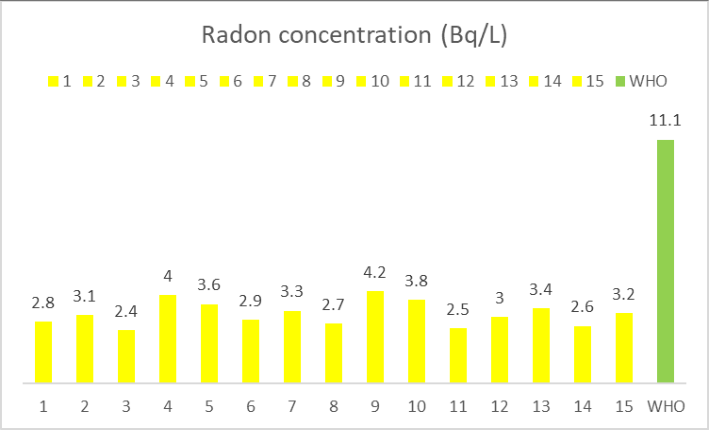 Figure 1
Introduction
Radon is a colorless radioactive noble gas. It is found in the decay of uranium-238 via its daughter product radium-226, which is naturally found in rocks and soil [1] . Radon is chemically inert, which means it leaves no direct trace after falling into groundwater systems, and thus high levels of radon can be found in the water, specifically in areas with uranium-rich sediments. Use of groundwater for domestic activities like drinking, cooking, showering and washing can liberate dissolved radon into the air of the house and raise indoor radon concentrations [1] . There are two paths of human exposure to radon. Ingestion is the first pathway in which radon dissolved in drinking water enters the gastrointestinal tract and provides a radiation dose to internal organs. Inhalation is the second pathway and is the dominant route of exposure. Radon from water can enter the air when water is used, and if radon or its decay products are inhaled into the lungs, they can damage lung tissue and cause lung cancer [2] . For this very reason, radon dissolved in water is a direct and an indirect health hazard. In order to safeguard public health, numerous organizations at world level have set up recommendations values for radon in drinking water. The US Environmental Protection Agency (US EPA) has suggested a maximum contaminant level of 11.1 Bq/L (300 pCi/L) for radon in drinking water supplies. The aim of this limit is to lower ingestion doses and to limit the share of waterborne radon in the indoor air concentrations [3] . Considering these facts, the current study aims to evaluate radon concentrations in water well in rural areas of Kufa City. Based on the comparison between the measured values and the international guideline levels, the results provide an input for scientific basis for environmental and/or public health assessment, indicating whether the groundwater poses any kind of radiological risk to the local population.
Materials and Methods
Study Area The study area is located in Kufa, a rural area that relies on shallow and medium-depth wells to extract groundwater. Groundwater samplesFifteen samples were used for groundwater sampling. To avoid effects of stagnant water, water was taken directly from well discharge pipes after being pumped [4] . Airtight containers of 250 mL without air bubbles were used to minimize loss of radon, and the samples were stored in these containers. Execution of ExperimentsSamples were stabilized prior to the measurement. Closed-air systems (with accumulations of radon that were shaken) The RAD7 analyze systemRAD7 was used to measure the radon concentrations, as heretofore it is effective at discerning radon decay to polonium-218 by the use of alpha spectroscopy [5] . Wat-250 protocol was done for four cycles for each sample. Humidity was controlled using desiccants. Values were reported in Bq/L.
Results and Discussion
We focus on radon activity concentrations and the probable radiological hazard in terms of water uptake by evaluating 15 groundwater samples. Radon concentrations were found to range between 2.4 and 4.2 Bq/L with an average of 3.2 Bq/L, indicating low spatial variability among sampled wells and suggesting limited contribution of radon from geological formations to groundwater in the study area. Sample 9 has the maximum radon concentration (4.2 Bq/L), while the lowest value (2.4 Bq/L) was detected in a sample 3. These fluctuations are often ascribed to local lithological variations, uranium content of the aquifer rocks, rock-water interaction time, and flow conditions of groundwater. Nonetheless, even the peak value observed falls significantly short of the guideline. All radon concentrations measured fell orders of magnitude below the guideline limit 11.1 Bq/L [6] set for drinking water in the United States Environmental Protection Agency and adopted by the World Health Organization [8] . This suggests that radon in the groundwater from the study area does not represent a radiological risk when it comes to drinking or breathing radon (from domestic water use such as showering and cooking) in the groundwater. In general terms, the results indicate that radon concentrations in the examined groundwater samples are well below health risk limits and exceedance of international drinking water standards. These results justify the radiological protection of the groundwater for domestic use whilst reiterating the need for continued monitoring at appropriate time intervals with regards the long-term safety [7] (particularly in cases where groundwater abstractions rates or land use conditions change). The radon concentrations in the groundwater samples is narrow between 2.4 and 4.2 Bq/L, hinting low spatial variation and similar hydrogeological setting. This indicates a low source uranium content from the aquifer materials and groundwater conditions that are not conducive to radon accumulation. All measured values are years below the international guideline limit of 11.1 Bq/L, which suggests no radiological hazard fall with the use of drinking water. The small sample-to-sample differences are clearly local geological factors like water rock interaction time, and shallow groundwater flow conditions. Observed radon levels are low, especially compared with values reported elsewhere, particularly in granitic or uranium-rich formations. In general, radon does not present a radiological risk for the groundwater, however, continua monitoring is recommended in order to guarantee the safety in the long term [8][9][10][11][12] .
Conclusion
Radon in groundwater of rural Kufa. The readings are all safe and pass international safety guidelines. You can ignore radon exposure while drinking groundwater. It is suggested to have regular monitoring that needs to be performed at longer term to check for the long-term geological or hydrological processes that could be followed by the detectable change in the level of radon.
Figures and tables from the paper
| Sample | Radon concentration (Bq/L) |
|---|---|
| 1 | 2.8 |
| 2 | 3.1 |
| 3 | 2.4 |
| 4 | 4.0 |
| 5 | 3.6 |
| 6 | 2.9 |
| 7 | 3.3 |
| 8 | 2.7 |
| 9 | 4.2 |
| 10 | 3.8 |
| 11 | 2.5 |
| 12 | 3.0 |
| 13 | 3.4 |
| 14 | 2.6 |
| 15 | 3.2 |
| WHO | 11.1 |
Table text extracted from the original PDF; superscript letters are shown inline. The original table image is below.
View original table image
References
12 in the original paper- Przylibski TA. Radon-222 in groundwater of the Sudety Mountains (SW Poland). Environmental Geology. 2005;48(3):354-365.
- Al-Tamimi MH, Abumurad KM, Kullab MK. Radon levels in different water sources in Jordan. Radiation Measurements. 2001;34(1-6):497-500.
- Kozłowska B, Walencik A, Dorda J, Zipper W. Radon concentration in groundwater of the Upper Silesian Coal Basin, Poland. Journal of Environmental Radioactivity. 2009;100(11):1055-1060.
- Vaupotič J, Riggio A, Santulin M. Radon in drinking water in Slovenia. Journal of Environmental Radioactivity. 2010;101(9):723-727.
- Kávási N, Somlai J, Jobbágy V, Kovács T, Nagy K. Radon concentration of water in the Balaton Highland and Bakony region, Hungary. Radiation Measurements. 2009;44(5-6):491-494.
- Gillmore GK, Phillips PS, Denman AR, Gilbertson DD. Radon in the Chalk aquifer of the UK. Journal of Environmental Radioactivity. 2001;53(1):1-14.
- Tayyeb ZA, Kinsara AR, Farid SM. Radon concentrations in water and its health implications in western Saudi Arabia. Journal of Environmental Radioactivity. 2005;82(1):101-110.
- Jobbágy V, Somlai J, Kovács T, Szeiler G, Kovács J. Radon concentration of water in Hungary. Radiation Measurements. 2007;42(3):491-495.
- Somlai J, Tokonami S, Ishikawa T, Vancsura P, Gaspar M, Jobbágy V, Kovács T. Radon-222 concentrations of water in the Balaton Highland and Bakony region of Hungary. Radiation Measurements. 2007;42(3):491495.
- Asikainen M, Kahlos H. Natural radioactivity of drinking water in Finland. Health Physics. 1979;37(1):77-83.
- Wanty RB, Gundersen LCS. The use of radon-222 as a tracer of groundwater discharge into lakes and rivers. Journal of Geophysical Research. 1991;96(B6):1007510087.
- Michel J. Sources of radon-222 in natural waters. Radiation Protection Dosimetry. 1987;18(1):35-39.