
Research article · 2025 · Full text
International Journal of Biology SciencesSeasonal insights: How acute phase proteins affect mastitis in Karan Fries cows
Volume 7(12) · Pages 01–04 · DOI: 10.33545/26649926.2025.v7.i12a.517 ↗
Research areasMilk Quality and Mastitis in Dairy CowsAnimal health and immunologyAnimal Behavior and Welfare Studies
Abstract
Author-writtenThe present investigation was undertaken to evaluate the association between season and mastitis severity (both clinical and subclinical) on acute phase protein (APP) levels in Karan Fries cows by assessing Serum Amyloid A (SAA) and Haptoglobin (Hp) concentrations in plasma and milk. A total of 92 cows were screened for subclinical and clinical mastitis, from which 12 cows from each category were selected for detailed analysis. The acute phase proteins (SAA and Hpt) in plasma and milk were higher in K.F cows infected with clinical or subclinical mastitis depicted seasonal variations with summer being the most vulnerable for the development of mastitis (P
Summary
Source-checkedPlain-language reading of the full paper, prepared with AI and checked against the text. Each point links to the authors' own words.
Why it matters
- Bovine mastitis is an inflammatory condition of the mammary gland that causes tissue damage and changes the properties of milk. View evidence ↗
- Identifying specific biomarkers for early mastitis detection is critical to reducing disease severity and preventing financial losses in the dairy industry. View evidence ↗
- Serum Amyloid A (SAA) and haptoglobin (Hp) are highly sensitive acute phase proteins (APPs) in cattle, with blood levels potentially increasing over 100-fold during acute inflammation. View evidence ↗
The question
- The study aimed to evaluate the levels of APPs in the plasma and milk of Karan Fries cows with subclinical (SCM) and clinical mastitis (CM), specifically investigating how seasonal changes affect these markers. View evidence ↗
What they did
- The study screened 92 Karan Fries cows for mastitis at the Livestock Research Centre of NDRI in Karnal, Haryana. View evidence ↗
- Data analysis was performed using an unpaired t-test via GraphPad Prism software. View evidence ↗
What they found
- Plasma SAA concentrations were significantly higher in the summer (30.61 ± 1.82 µg/ml) compared to the thermoneutral (24.59 ± 1.50 µg/ml) and winter (25.47 ± 2.60 µg/ml) periods. View evidence ↗
- Plasma haptoglobin (Hpt) showed a similar but less pronounced seasonal trend, with a slight increase in summer (1.34 ± 0.30 mg/ml) compared to thermoneutral (0.95 ± 0.21 mg/ml) and winter (0.94 ± 0.21 mg/ml) seasons. View evidence ↗
- Across all seasons, cows with clinical mastitis consistently exhibited higher levels of SAA and haptoglobin than those with subclinical mastitis. View evidence ↗
- Plasma SAA levels increased during the summer for both groups, rising from 21.51 ± 1.65 µg/ml to 27.45 ± 1.95 µg/ml in SCM cows and from 27.66 ± 1.22 µg/ml to 33.78 ± 2.25 µg/ml in CM cows. View evidence ↗
- Plasma haptoglobin increased in the summer from 0.56 ± 0.08 mg/ml to 0.62 ± 0.06 mg/ml in SCM cows and from 1.33 ± 0.31 mg/ml to 2.06 ± 0.26 mg/ml in CM cows. View evidence ↗
- Milk APPs followed a similar trend, with haptoglobin increasing from 7.43 ± 1.05 mg/ml to 11.83 ± 1.57 mg/ml in SCM cows, and SAA increasing from 0.53 ± 0.02 µg/ml to 0.63 ± 0.02 µg/ml in CM cows from thermoneutral to summer periods. View evidence ↗
What it means
- The authors conclude that SAA and haptoglobin are reliable biomarkers for distinguishing between clinical and subclinical mastitis and for assessing the impact of seasonal heat stress. View evidence ↗
- The authors recommend integrating APP measurements into standard diagnostic and herd health protocols to enable earlier detection and better management of mastitis losses. View evidence ↗
Visual summary
1 visualsIllustrations explain the paper; charts are replotted from the paper's own table values.
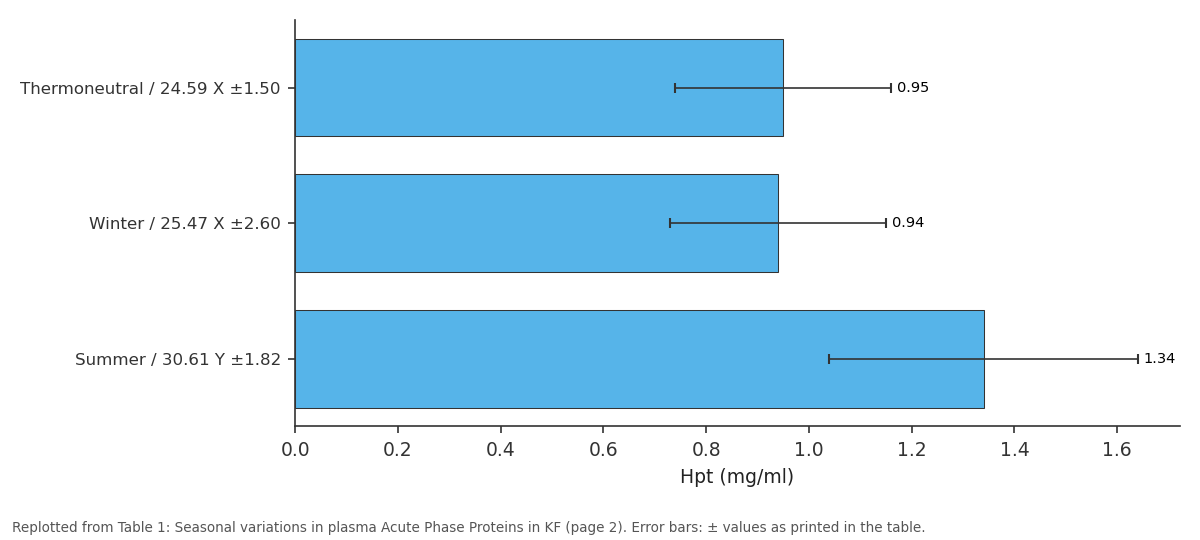
Hpt (mg/ml): Thermoneutral / 24.59 X... vs Winter / 25.47 X ±2.60 vs Summer / 30.61 Y ±1.82
Replotted from Table 1 (page 2) of the original paper. Every bar is the paper's own table value.
View source evidence ↗Figures & tables
From the original paper Table 2
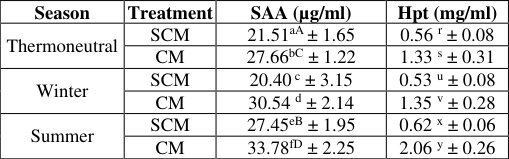 Table 3
 Table 1
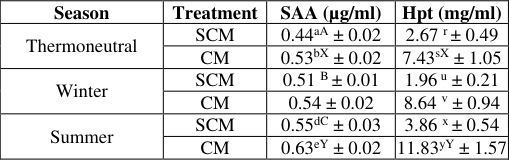 Table 4
Introduction
Bovine mastitis is an inflammatory disorder of the mammary gland parenchyma, commonly associated with pathological damage to glandular tissues and alterations in the physicochemical properties of milk (Ali et al., 2022) [2] . Intramammary infections further contribute to milk quality deterioration by increasing somatic cell counts and altering cellular composition (Wever and Emanuelson, 1989) [21] , along with elevating inflammatory mediators such as leukotrienes (Rose et al., 1989) [15] and interleukins (Shuster and Kehrli, 1993) [19] . These alterations may occur before or right after the occurrence of clinical symptoms. In order to give therapeutic intervention at an earlier stage and reduce the severity of the disease as well as major financial losses to the dairy sector, it is imperative to identify particular mastitis biomarkers for early identification. Following tissue damage, a number of systemic events take place, chief among them the acute phase response (APR), which is brought on by the damaged tissue's macrophages or blood monocytes. According to Gruys et al., (2005) [7] , these cells produce a range of mediators, mostly cytokines and other proinflammatory chemicals such as interleukin-1 (IL-1), interleukin-6 (IL-6), and tumor necrosis factor-alpha (TNF-). Metabolic changes that increase the production of acute phase proteins (APPs), a class of plasma proteins mostly produced by the liver's hepatocytes, are the most prominent modifications associated with APR (Ceciliani et al., 2012) [3] . APP concentration can be affected by any kind of disease, edema, or inflammation, as well as any associated trauma or stress (Murata et al., 2004) [12] . Increased permeability during mastitis causes the blood-milk barrier to change, allowing immune cells, inflammatory mediators, and plasma proteins to seep into the mammary gland and milk. The existence of APPs in milk implies a self-regulating relationship between SCC and APP (Wellnitz et al., 2012) [20] . Amyloid A and haptoglobin (Hp) are the most sensitive APPs in cattle; their blood concentrations can increase by over 100 times, particularly in response to acute inflammation (Eckersall et al., 1999) [5] . Measuring Hp in milk could be a helpful method for analyzing inflammatory activity inside the mammary gland and an early sign of mastitis because it is created inside the gland (Hiss et al., 2004) [8] . The current study aims to assess APPs in the milk and plasma of Karan Fries cows with SCM and CM, and to investigate the seasonal effects, which could serve as helpful markers for early SCM diagnosis.
Materials and methods:
92 Karan Fries cows were first examined for clinical or subclinical mastitis at the Livestock Research Centre (LRC) of NDRI in Karnal, Haryana. The milk from these cows was tested for subclinical mastitis using the modified California Mastitis Test (mCMT). Cows with clinical mastitis were identified by their clinical symptoms. Twelve clinical and twelve subclinical KF cows were chosen from a total of 92 animals. Each cow's jugular vein was punctured to extract blood samples (~10 ml) into a sterile, heparinized vacutainer. Centrifugation at 3000 rpm for 15 minutes was used to separate the plasma. Composite milk samples (representing all four quarters) were taken from cows affected by SCM and CM. For the purpose of analyzing acute phase proteins, a portion of whole milk and skim milk (obtained following centrifugation at 3000 rpm for 20 minutes at 4°C) were kept at -20°C. The normal protocols were followed when performing the bacteriological analyses. The level of SAA in milk and plasma was determined using the "Bovine SAA ELISA kit" (catalogue No. E0023Bo) from Bioassay Technology Laboratory.
Haptoglobin in milk and plasma was measured using Bioassay Technology Laboratory's "Bovine Hp ELISA kit" (catalogue No. E0022Bo). Staphylococcus aureus was isolated using MSA (Mannitol salt agar) and E. coli was isolated using EMB agar for microbiological analyses. TM Media Company and Hi-Media were the suppliers, respectively. An unpaired t-test was used to evaluate the data using the GraphPad Prism software.
Result and Discussion
Microbiological analysis revealed that Staphylococcus aureus was the most frequently isolated bacterium in the examined milk samples. [11] demonstrated that Serum Amyloid A (SAA) and Lipopolysaccharide Binding Protein (LBP) concentrations in lactating dairy cows increased markedly when hyperthermia was induced using an electric blanket, indicating that heat stress can elevate acute phase protein levels. Hpt concentrations showed a seasonal trend similar to SAA, though the changes were less pronounced, with only a slight rise observed in summer (1.34 ± 0.30 mg/ml) compared with the thermoneutral (0.95 ± 0.21 mg/ml) and winter (0.94 ± 0.21 mg/ml) seasons. According to Sejian et al., (2018) [18] , haptoglobin is commonly used as an indicator of health status and inflammatory response in livestock and is considered a useful marker of metabolic adjustment under heat stress. Nevertheless, studies remain inconsistent regarding the effect of high temperatures on its plasma levels in cattle. Some researchers have found no influence of environmental temperature on haptoglobin concentration (Wijffels et al., 2024) [23] , while others have reported reductions in heat-stressed animals (Kim et al., 2018) [9] , indicating that heat stress does not always elevate this acute phase protein. [22,4] also observed elevated haptoglobin in dairy heifer calves and cows exposed to heat stress, followed by a significant decline back to baseline once the heat stress subsided, reflecting a resolution of the heat-induced inflammatory response. Values with different superscripts in different seasons for both parameters differ significantly at 5% level. Milk acute phase proteins exhibited a pattern similar to that of plasma APPs. Milk SAA levels were notably elevated during the summer (0.59 ± 0.02 µg/ml) compared with the other seasons. Likewise, milk haptoglobin concentrations showed a substantial rise in the summer (7.85 ± 1.69 mg/ml), exceeding the values recorded in both the thermoneutral and winter periods. [16,13,17,6] .
Conclusion
This research clearly demonstrates that Serum Amyloid A and Haptoglobin levels in both plasma and milk are significantly affected by the severity of mastitis and seasonal changes in Karan Fries cows. Clinical mastitis consistently resulted in higher concentrations of Acute Phase Proteins (APP) compared to subclinical mastitis throughout all seasons, indicating a strong correlation between APP responses and the intensity of the disease. Seasonal evaluations indicated that heat stress during the summer further increased APP levels, underscoring the relationship between environmental stressors and inflammation of the mammary gland. These results emphasize the diagnostic importance of SAA and Hp as dependable biomarkers for differentiating between clinical and subclinical mastitis, as well as for evaluating the physiological effects of seasonal heat stress. Integrating APP measurement into standard diagnostic and herd health management protocols may enable earlier detection, enhance therapeutic decision-making, and improve the management of mastitis-related losses in dairy production systems.
Figures and tables from the paper
| — | Thermoneutral | Winter | Summer |
|---|---|---|---|
| SAA (µg/ml) | 0.48 B ±0.02 | 0.53 B ±0.01 | 0.59 C ±0.02 |
| Hpt (mg/ml) | 5.05 ±1.05 | 5.30 ±1.34 | 7.85 ±1.69 |
Table text extracted from the original PDF; superscript letters are shown inline. The original table image is below.
View original table image
| Season | Treatment | SAA (µg/ml) | Hpt (mg/ml) |
|---|---|---|---|
| Thermoneutral | SCM | 21.51aA ± 1.65 | 0.56 r ± 0.08 |
| CM | 27.66bC ± 1.22 | 1.33 s ± 0.31 | |
| Winter | SCM | 20.40 c ± 3.15 | 0.53 u ± 0.08 |
| CM | 30.54 d ± 2.14 | 1.35 v ± 0.28 | |
| Summer | SCM | 27.45eB ± 1.95 | 0.62 x ± 0.06 |
| CM | 33.78fD ± 2.25 | 2.06 y ± 0.26 |
Table text extracted from the original PDF; superscript letters are shown inline. The original table image is below.
View original table image
| — | Thermoneutral | Winter | Summer |
|---|---|---|---|
| SAA (µg/ml) | 24.59 X ±1.50 | 25.47 X ±2.60 | 30.61 Y ±1.82 |
| Hpt (mg/ml) | 0.95 ±0.21 | 0.94 ±0.21 | 1.34 ±0.30 |
Table text extracted from the original PDF; superscript letters are shown inline. The original table image is below.
View original table image
| Season | Treatment | SAA (µg/ml) | Hpt (mg/ml) |
|---|---|---|---|
| Thermoneutral | SCM | 0.44aA ± 0.02 | 2.67 r ± 0.49 |
| CM | 0.53bX ± 0.02 | 7.43sX ± 1.05 | |
| Winter | SCM | 0.51 B ± 0.01 | 1.96 u ± 0.21 |
| CM | 0.54 ± 0.02 | 8.64 v ± 0.94 | |
| Summer | SCM | 0.55dC ± 0.03 | 3.86 x ± 0.54 |
| CM | 0.63eY ± 0.02 | 11.83yY ± 1.57 |
Table text extracted from the original PDF; superscript letters are shown inline. The original table image is below.
View original table image
References
23 in the original paper- Alberghina D, Piccione G, Casella S, Panzera M, Morgante M, Gianesella M. Effect of season on blood metabolites and haptoglobin in dairy cows during postpartum. Arch Anim Breed. 2013;56:354-359. doi:10.7482/0003-9438-56-035.
- Ali A, Mir MUR, Ganie SA, Mushtaq S, Bukhari SI, Alshehri S, et al. Milk compositional study of metabolites and pathogens in bovine milk affected with subclinical mastitis. Molecules. 2022;27:8631.
- Ceciliani F, Ceron JJ, Eckersall PD, Sauerwein H. Acute phase proteins in ruminants. J Proteome. 2012;75:4207-4231.
- Cheng J, Min L, Zheng N, Fan C, Zhao S, Zhang Y, et al. Sudden cooling alleviates inflammatory responses in heat-stressed dairy cows: iTRAQ proteomic analysis. Int J Biometeorol. 2018;62:177-182. doi:10.1007/s00484-017-1439-5.
- Eckersall PD, Duthie S, Safi S, et al. Automated haptoglobin assay: albumin interference prevention. Comp Haematol Int. 1999;9:117-121.
- Grönlund U, Waller KP, Eckersall PD, Hogarth C, Hultén C. Haptoglobin and serum amyloid A in milk and serum during induced S. aureus mastitis. J Dairy Res. 2003;70:379-386. doi:10.1017/S0022029903006484.
- Gruys E, Toussaint MJM, Niewold TA, Koopmans SJ. Acute phase reaction and proteins. J Zhejiang Univ Sci B. 2005;6:1045-1056.
- Hiss S, Mielenz M, Bruckmaier RM, Sauerwein H. Haptoglobin in blood & milk after endotoxin; mammary Hp mRNA expression. J Dairy Sci. 2004;87:3778-3784.
- Jo JH, Nejad JG, Peng DQ, Kim HR, Kim SH, Lee HG. Indicators of metabolomics & milk miRNA in heatstressed Holsteins. Animals. 2021;11:722. doi:10.3390/ani11030722.
- Koch F, Otten W, Sauerwein H, Reyer H, Kuhla B. Mild heat stress immune adaptation in lactating cows. J Dairy Sci. 2023;106:3008-3022. doi:10.3168/jds.202222520.
- Al-Qaisi M, Horst EA, Mayorga EJ, Goetz BM, Abeyta MA, Yoon I, et al. Saccharomyces cerevisiae effects on heat-stressed cows. J Dairy Sci. 2020;103:12158.
- Murata H, Shimada N, Yoshioka M. Acute phase proteins in veterinary diagnosis. Vet J. 2004;168:28-40.
- Otsuka M, Sugiyama M, Ito T, Tsukano K, Oikawa S, Suzuki K. Serum amyloid A in mastitis diagnosis via latex agglutination. J Vet Med Sci. 2020;83:329-332. doi:10.1292/jvms.20-0550.
- Pyörälä S, Eckersall PD, Orro T, Fitzpatrick J, Simojoki H, Hovinen M. Acute phase proteins in naturally occurring mastitis. Vet Rec. 2011;168:535. doi:10.1136/vr.d1120.
- Rose DM, Giri SN, Wood SJ, Cullor JS. Leukotriene B4 in K. pneumoniae mastitis pathogenesis. Am J Vet Res. 1989;50:915-918.
- Sadek K, Saleh E, Ayoub M. Blood & milk biomarkers for mastitis diagnosis. Trop Anim Health Prod. 2016;49:431-437. doi:10.1007/s11250-016-1190-7.
- Safi S, Nowrouzian I, Bolourchi M, Jafarzadeh SR, Khoshvaghti A. Acute phase proteins in subclinical mastitis. Vet Clin Pathol. 2009;38:471-476. doi:10.1111/j.1939-165X.2009.00156.x.
- Sejian V, Bhatta R, Gaughan JB, Dunshea FR, Lacetera N. Review: animal heat stress adaptation. Animal. 2018;12(Suppl 2):s431-s444. doi:10.1017/S1751731118001945.
- Shuster DE, Kehrli ME. Cytokine production in endotoxin mastitis. Am J Vet Res. 1993;54:80-84.
- Wellnitz O, Bruckmaier RM. Innate immune response of bovine udder. Vet J. 2012;192:148-152.
- Wewer P, Emanuelson U. Somatic cell count influences in bovine quarters. Acta Vet Scand. 1989;30:465-474.
- Wickramasinghe HKJP, Stepanchenko N, Oconitrillo MJ, Silva JVV, Goetz BM, Abeyta MA, et al. Diurnal heat stress effects in dairy heifers. Iowa State Univ Anim Ind Rep. 2021;17:13828. doi:10.31274/air.11927.
- Wijffels G, Sullivan ML, Stockwell S, Briscoe S, Pearson R, Li Y, et al. Inflammatory markers in feedlot cattle under heat load vs feed restriction. Int J Biometeorol. 2024;68:211-227. doi:10.1007/s00484023-02584-3.