
Research article · 2025 · Full text
International Journal of Geography Geology and EnvironmentSpatio-Temporal NDVI dynamics and cyclone impact assessment (2020-2024): Balukhanda wildlife Sanctuary, Puri, Odisha
Volume 7(10) · Pages 113–123 · DOI: 10.22271/27067483.2025.v7.i10b.436 ↗
Research areasCoastal wetland ecosystem dynamicsRemote Sensing in AgricultureLand Use and Ecosystem Services
Abstract
Author-writtenThis study investigates the spatio-temporal dynamics of vegetation and the impacts of cyclonic disturbances within the Balukhanda Wildlife Sanctuary (BKWLS), a fragile coastal ecosystem along the Puri-Konark marine corridor of Odisha, India, for the period 2020-2024. Multi-temporal satellite imagery from Landsat and Sentinel sensors was analyzed to derive the Normalized Difference Vegetation Index (NDVI) and assess seasonal vegetation patterns. During the pre-monsoon season (March-June), NDVI values were generally lower, reflecting elevated vegetation stress due to high temperatures, limited rainfall, and reduced soil moisture. Casuarina equisetifolia plantations exhibited moderate NDVI levels, indicating relative resilience to drought and salinity, whereas scrub and dune vegetation showed lower greenness. The study further highlights the influence of major cyclones, including Amphan (2020) and Yaas (2021), on canopy structure and vegetation cover, with NDVI-based change detection revealing zones of temporary degradation and subsequent regeneration. These results underscore the ecological sensitivity of the sanctuary to seasonal climatic variations and extreme weather events, emphasizing the importance of continuous monitoring to inform adaptive management strategies for coastal forest conservation and biodiversity protection.
Summary
Source-checkedPlain-language reading of the full paper, prepared with AI and checked against the text. Each point links to the authors' own words.
Why it matters
- The Balukhanda-Konark Wildlife Sanctuary in Odisha is a fragile coastal ecosystem that is critical for biodiversity conservation, eco-tourism, and protecting the coast. View evidence ↗
- Because it is located on the Bay of Bengal coast, the sanctuary is highly vulnerable to human pressures and natural disasters like storm surges and cyclones. View evidence ↗
- The Normalized Difference Vegetation Index (NDVI) is used as a tool to monitor the health, stress levels, and ability of the ecosystem to regenerate. View evidence ↗
The question
- The study aims to evaluate how cyclones impact vegetation greenness and to examine NDVI variations between pre-monsoon and post-monsoon seasons from 2020 to 2024. View evidence ↗
What they did
- Researchers used multi-temporal satellite data from Landsat-8 OLI, sourced from the USGS and Copernicus Open Access Hub, to calculate NDVI. View evidence ↗
- The analysis divided the year into two seasons: pre-monsoon (March-June), characterized by heat and low moisture, and post-monsoon (September-December), characterized by high rainfall and regrowth. View evidence ↗
- Cyclone impact data for Amphan (2020), Yaas (2021), Mocha (2023), and Remal (2024) were obtained from official India Meteorological Department reports. View evidence ↗
What they found
- Vegetation in the sanctuary showed lower NDVI values during the pre-monsoon season, which indicates limited photosynthetic performance and reduced chlorophyll activity. View evidence ↗
- NDVI values were generally higher during the post-monsoon season than the pre-monsoon season, reflecting improved vegetation health and photosynthetic activity. View evidence ↗
- The lowest pre-monsoon NDVI value of 0.4025 occurred in 2021, coinciding with the damage caused by Cyclone Yaas. View evidence ↗
- The highest post-monsoon NDVI value of 0.4929 was recorded in 2024, indicating strong ecosystem recovery following Cyclone Remal. View evidence ↗
- Cyclones reduce canopy cover and NDVI values by uprooting Casuarina plantations, which normally act as natural barriers. View evidence ↗
- Storm surges cause saltwater intrusion that damages root systems and ground vegetation, further lowering NDVI indices. View evidence ↗
What it means
- The authors conclude that NDVI is a reliable and sensitive indicator for monitoring both the damage and the recovery of vegetation after cyclones. View evidence ↗
- The authors recommend systematic NDVI monitoring to inform adaptive management strategies for maintaining ecological stability and conserving biodiversity. View evidence ↗
Visual summary
2 visualsIllustrations explain the paper; charts are replotted from the paper's own table values.
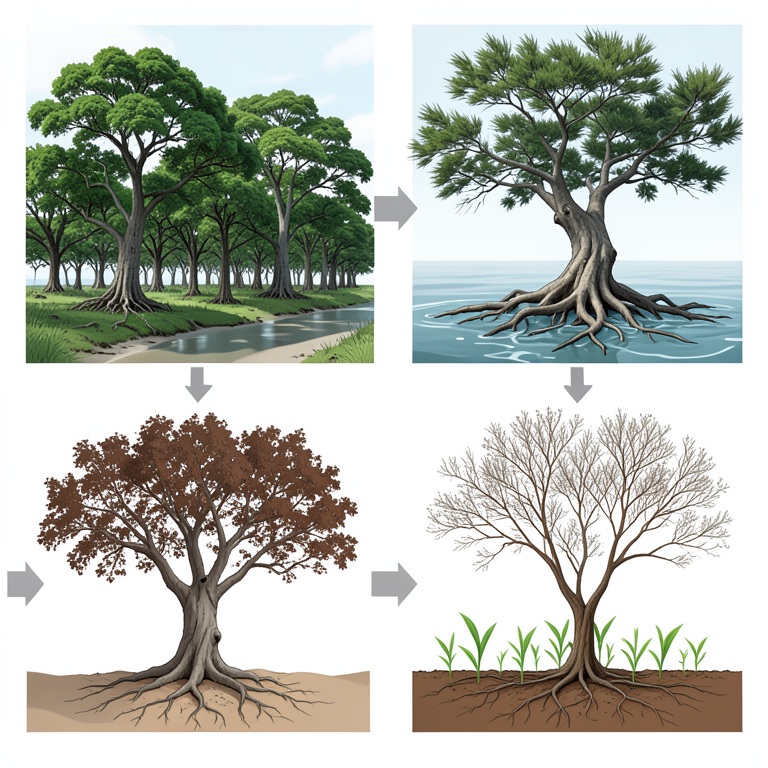
Cyclone Impact Cycle
AI-generated conceptual illustration (Casuarina plantation forest in a coastal wildlife sanctuary). It explains the idea and does not show study data.
View source evidence ↗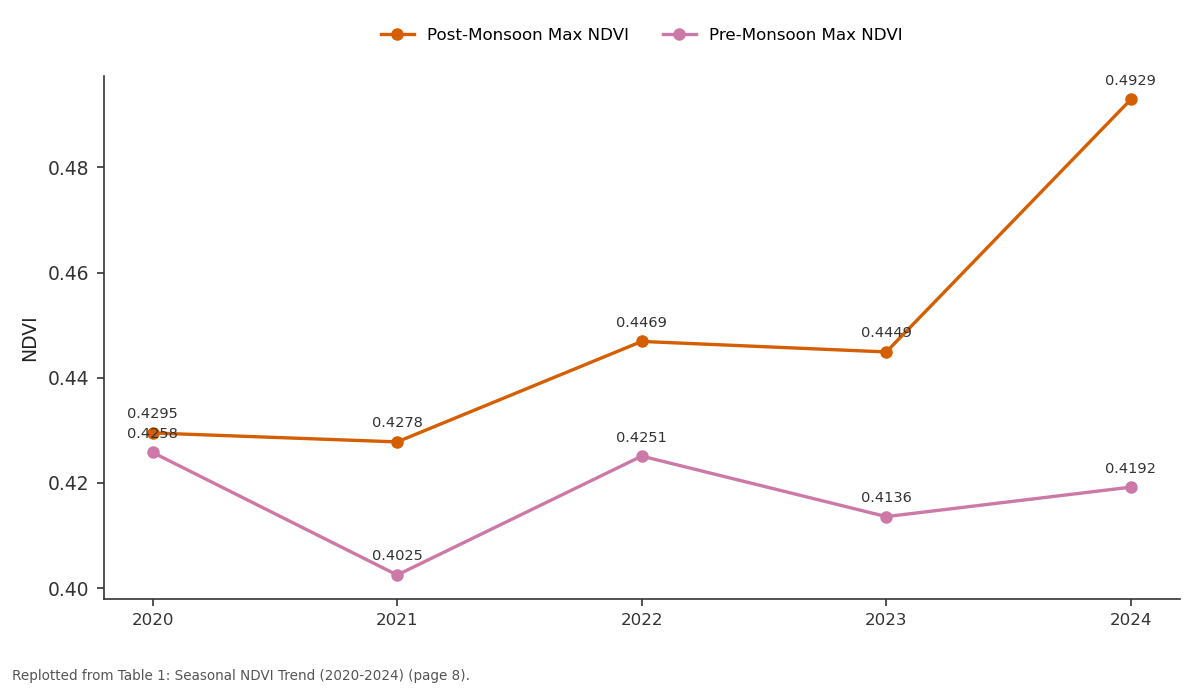
Post-Monsoon Max NDVI and Pre-Monsoon Max NDVI: 2020 vs 2021 vs 2022 vs 2023 vs 2024
Replotted from Table 1 (page 8) of the original paper. Every bar is the paper's own table value.
View source evidence ↗Figures & tables
From the original paper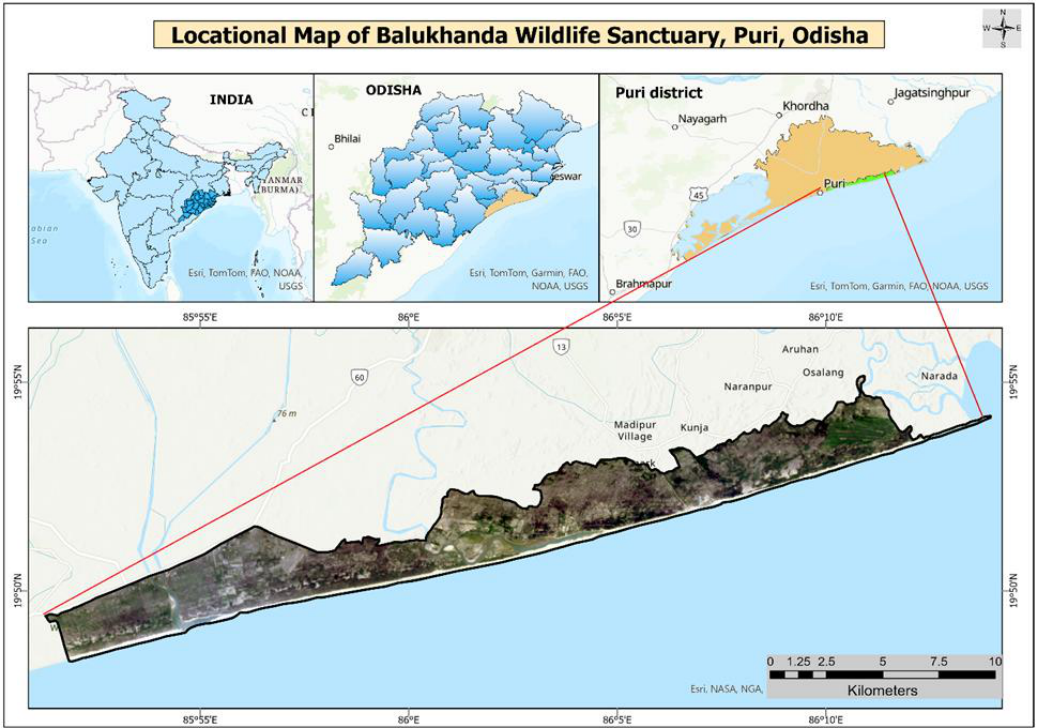 Figure 1
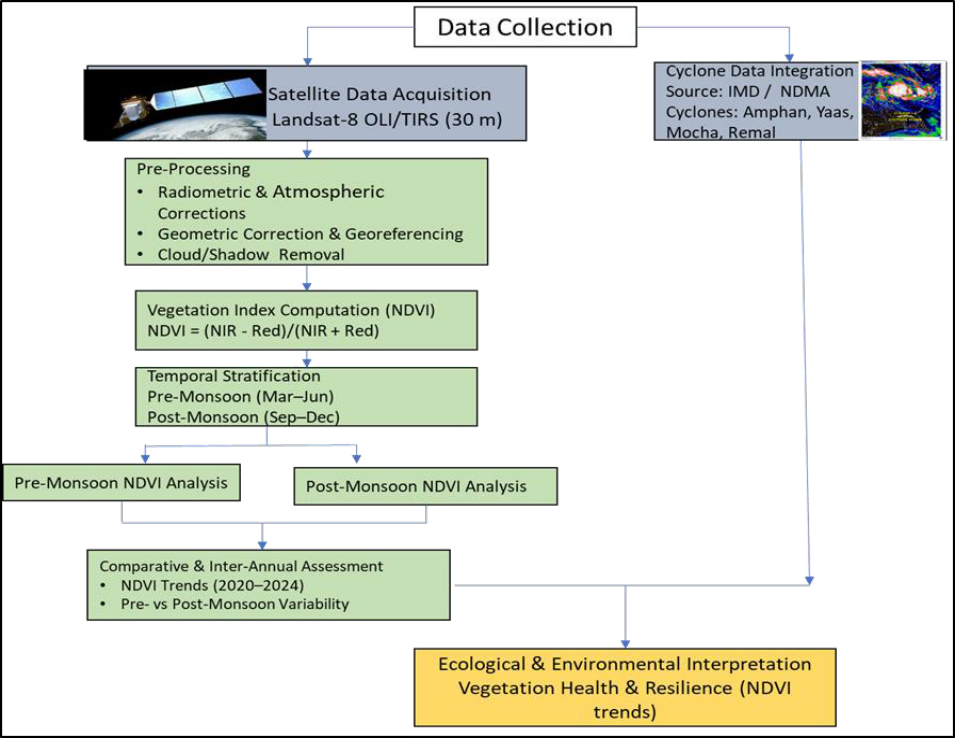 Figure 2
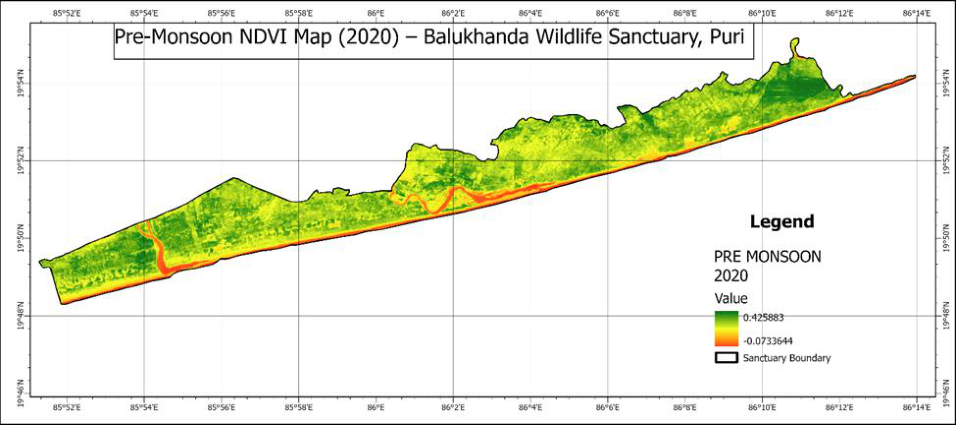 Figure 3
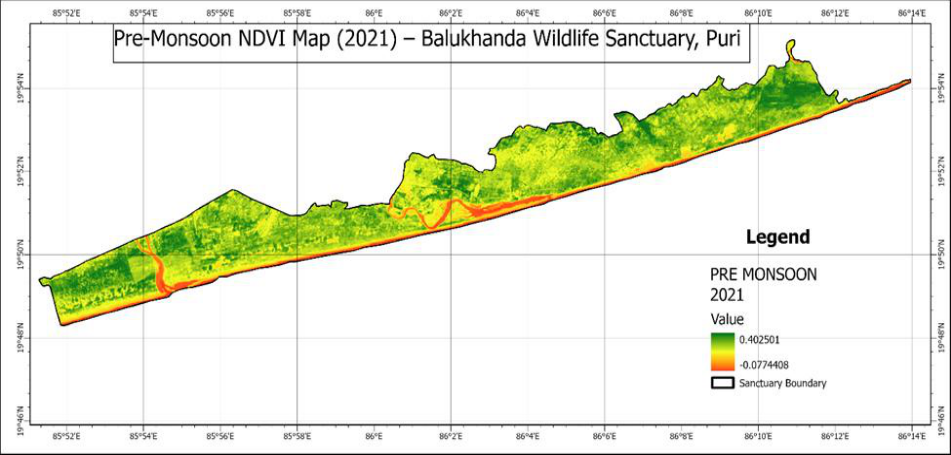 Figure 4
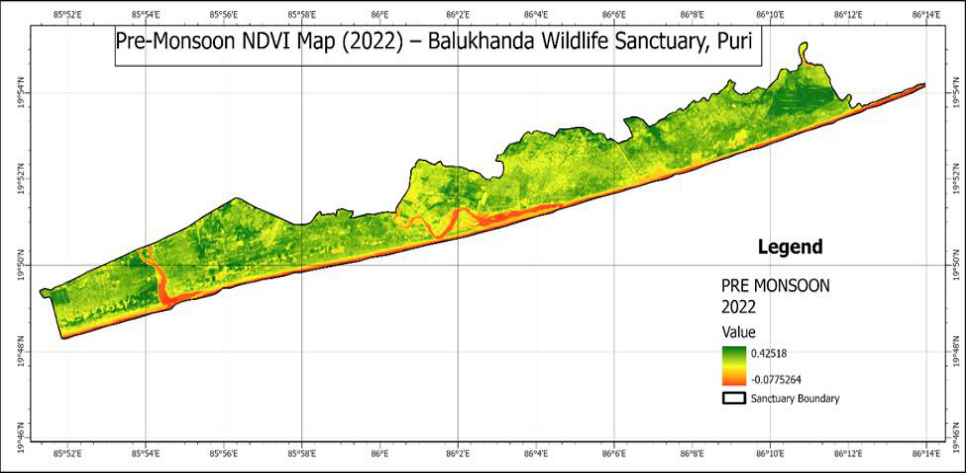 Figure 5
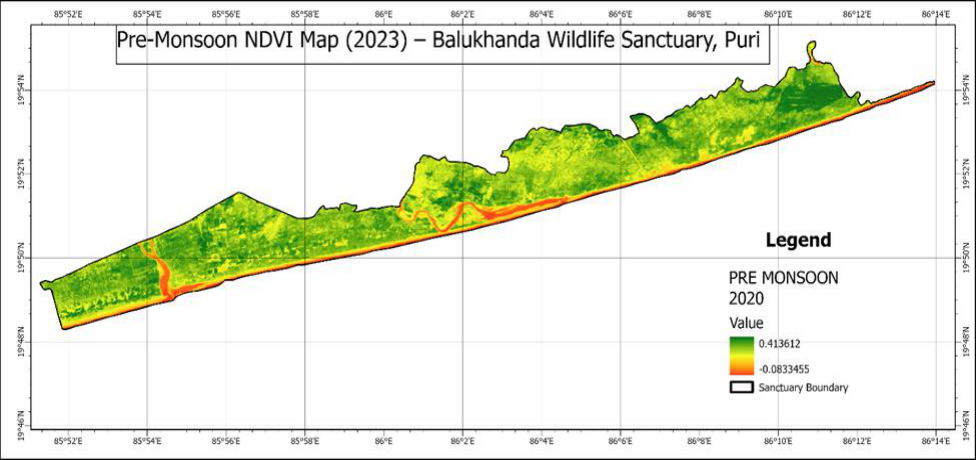 Figure 6
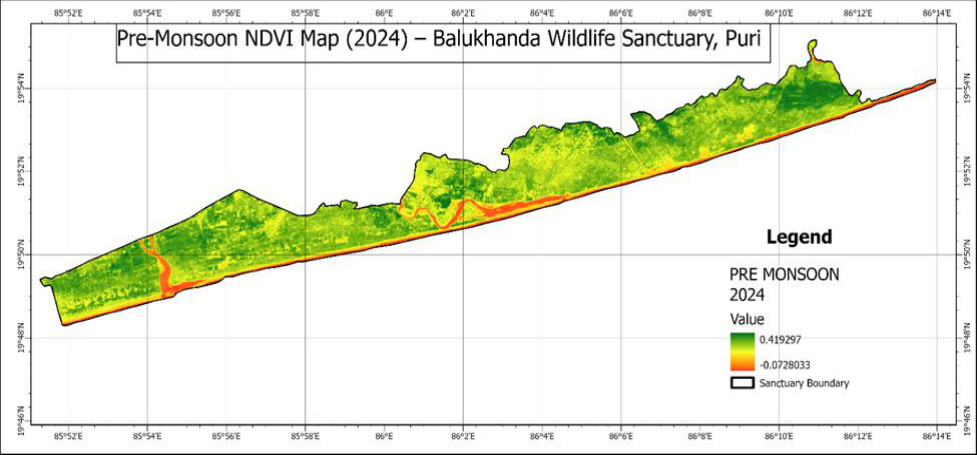 Figure 7
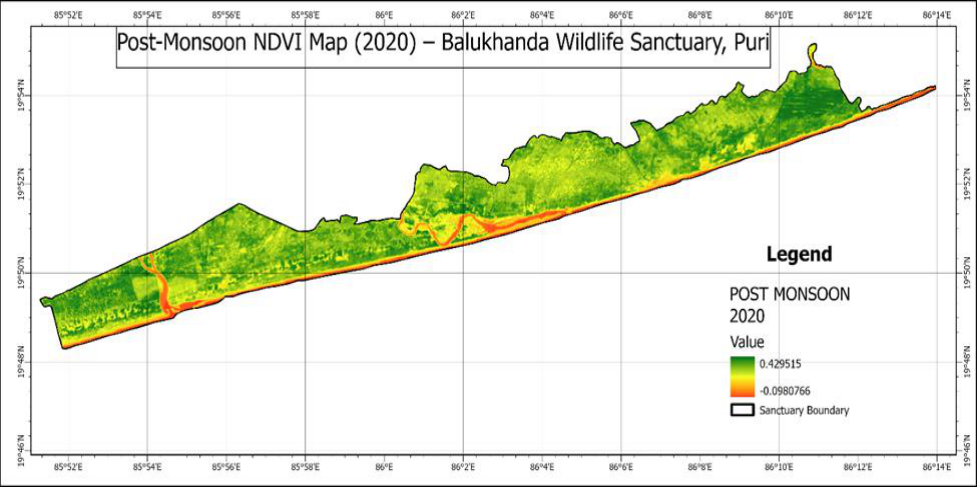 Figure 8
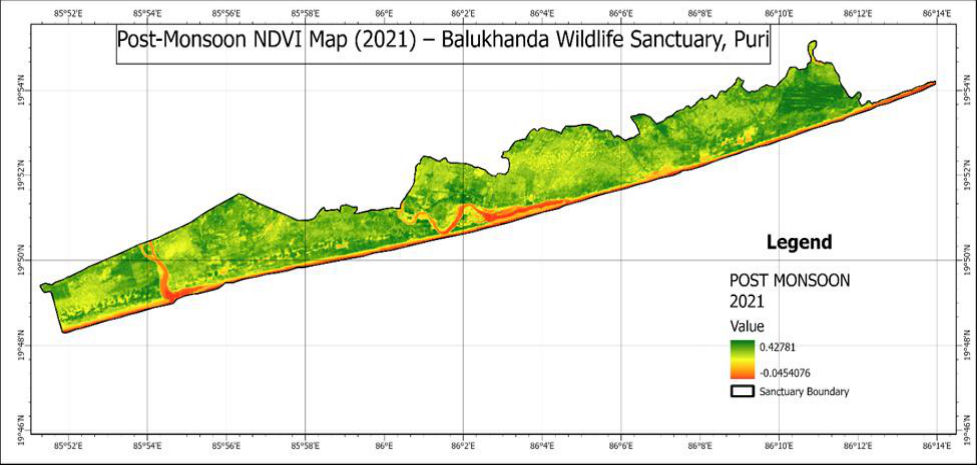 Figure 9
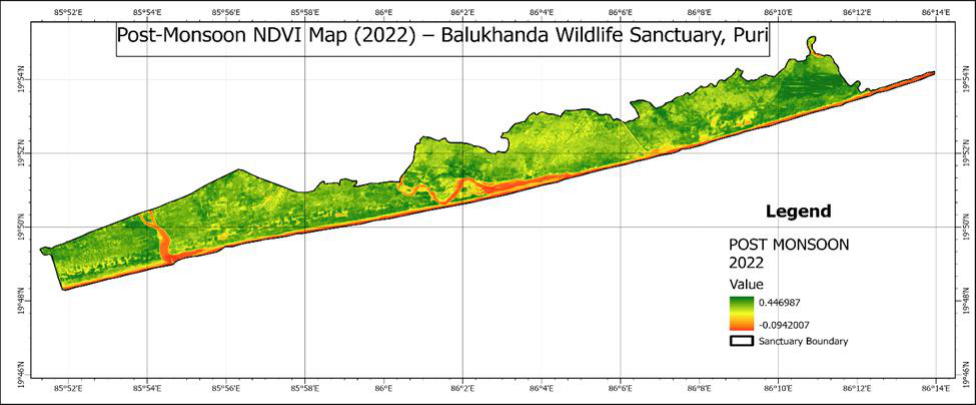 Figure 10
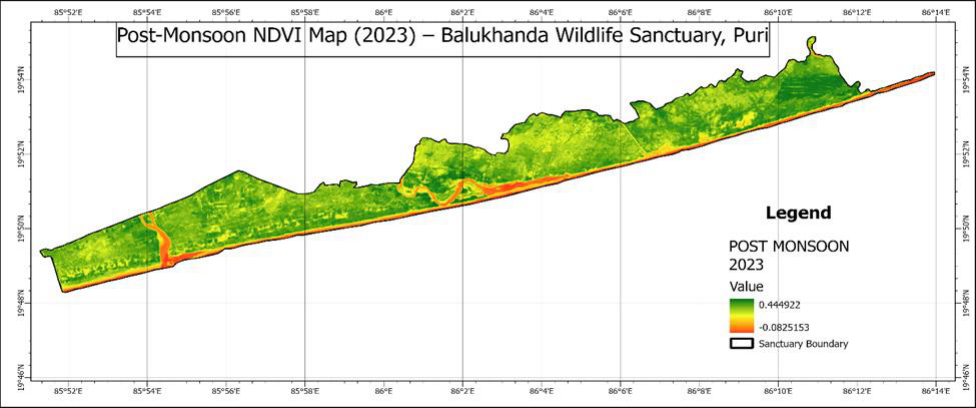 Figure 11
 Table 1
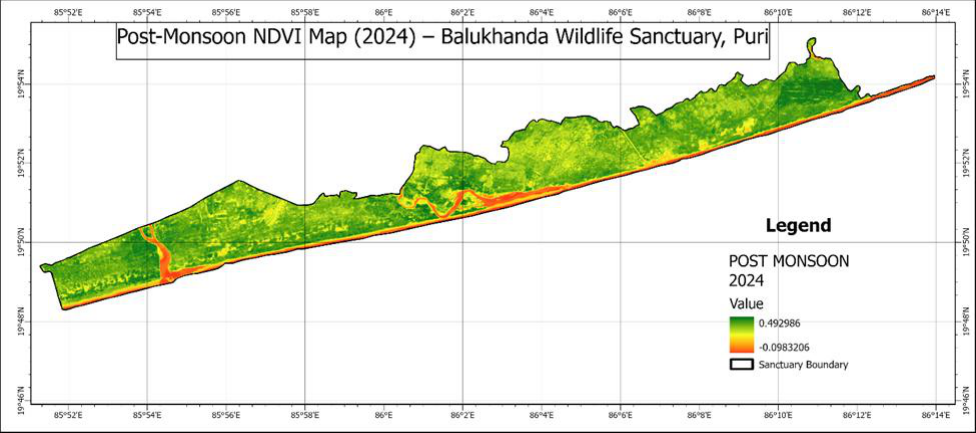 Figure 12
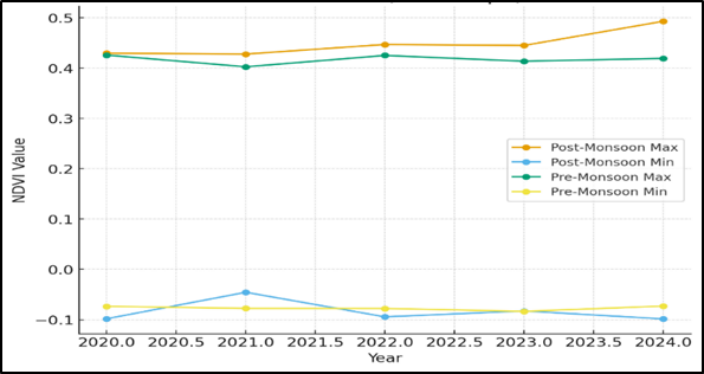 Figure 13
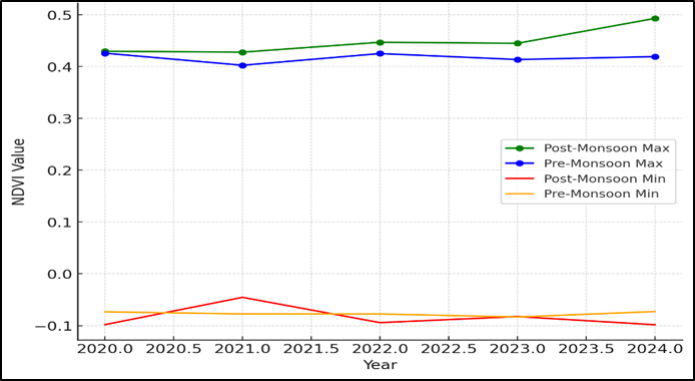 Figure 14
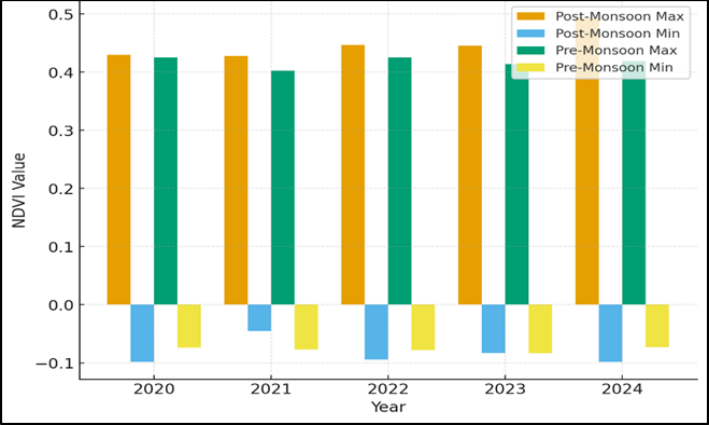 Figure 15
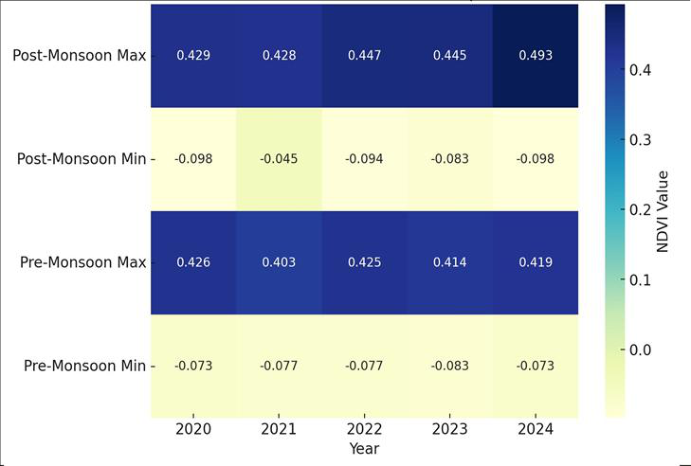 Figure 16
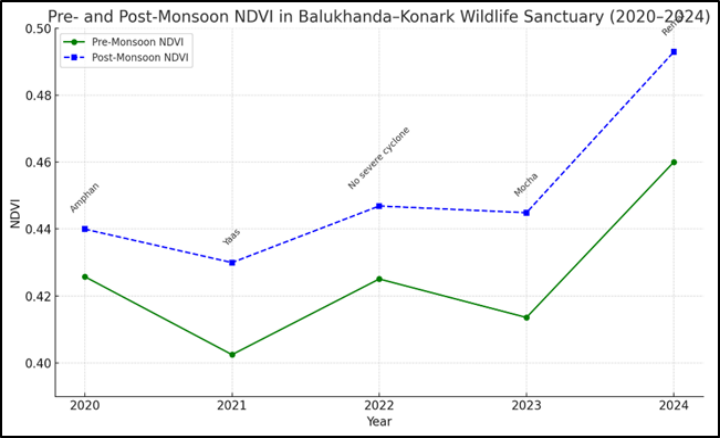 Figure 17
Introduction
Nursing encompasses autonomous and collaborative care of individuals of all ages, families, groups and communities, sick or well and in all settings. Nursing includes the promotion of health, prevention of illness, and the care of ill, disabled and dying people. Advocacy, promotion of a safe environment, research, participation in shaping health policy and in patient and health systems management, and education are also key nursing roles [1] . Balukhanda-Konark Wildlife Sanctuary, stretching along the Puri-Konark marine drive in Odisha, is a fragile coastal ecosystem composed of casuarina plantations, sand dunes, scrub forests, and coastal vegetation. This sanctuary plays a vital role in coastal protection, biodiversity conservation, and eco-tourism. Balukhanda-Konark Wildlife Sanctuary, situated along the Puri-Konark marine drive in Odisha, represents a fragile yet ecologically significant coastal ecosystem comprising casuarina plantations, sand dunes, scrub forests, and diverse coastal vegetation. The sanctuary serves as a natural barrier against coastal erosion, protecting nearby human settlements while maintaining vital biodiversity and supporting eco-tourism initiatives that enhance local livelihoods and environmental awareness (Forest Department, Government of Odisha, 2023) [4] . Several studies have highlighted the sanctuary's ecological importance and vulnerability to natural disturbances. For instance, Mishra et al., (2021) [7] used Landsat imagery to analyze vegetation loss and shoreline changes following Cyclone Fani, revealing extensive damage to coastal forests. Similarly, Nandi et al., (2020) [8] observed significant short-term landscape disturbances in the area due to cyclonic impacts. Research by Kumari et al., (2023) [5] emphasized the need for mitigation strategies to protect such wildlife sanctuaries from immediate cyclone-induced damages. Recent modeling by Mishra et al., (2025) [6] projected future shoreline dynamics and land use/land cover changes using machine learning, underlining the sanctuary's sensitivity to climatic and anthropogenic pressures. Avifaunal studies by Palei et al., (2020) [9] documented the diverse bird species and their breeding statuses, indicating the site's role as an essential habitat for coastal and migratory species. Additionally, Rajendra (2024) [10] recorded new marine hetero-branch species from within the sanctuary area, further demonstrating its rich and varied biodiversity. Collectively, these studies reinforce the significance of Balukhanda-Konark Wildlife Sanctuary as a critical zone for coastal protection, biodiversity conservation, and scientific research in eastern India. Due to its location on the Bay of Bengal coast, the sanctuary is highly exposed to cyclones, storm surges, saltwater intrusion, and anthropogenic pressures. Vegetation monitoring using the Normalized Difference Vegetation Index (NDVI) helps assess the health, stress, and regeneration capacity of this ecosystem. This study examines NDVI variations (2020-2024) across Pre-Monsoon (Mar-Jun) and Post-Monsoon (Sep-Dec) seasons, and evaluates the impact of cyclones on vegetation greenness. The present study is designed with the primary objective of examining the spatio-temporal dynamics of vegetation within the Balukhanda-Konark Wildlife Sanctuary. Specifically, it aims to analyze the seasonal Normalized Difference Vegetation Index (NDVI) trends from 2020 to 2024 to understand fluctuations in vegetation health and density across different seasons. Furthermore, the study seeks to assess the impact of cyclonic disturbances on vegetation cover, as such events frequently alter the ecological stability of coastal landscapes. By integrating multi-temporal satellite data and geospatial analysis, the research also intends to identify distinct patterns of vegetation stress and post-disturbance regeneration within this fragile coastal ecosystem. Overall, these objectives are directed toward evaluating the ecological resilience of the sanctuary and contributing valuable insights for sustainable coastal forest management and biodiversity conservation in the face of increasing climatic variability.
Materials and Methods
This study adopted an integrated remote sensing and GISbased approach to analyze vegetation dynamics, cycloneinduced stress, and post-disturbance regeneration patterns within the Balukhanda-Konark Wildlife Sanctuary (BKWLS) during 2020-2024. Multi-temporal satellite datasets were utilized to derive the Normalized Difference Vegetation Index (NDVI), which effectively represents vegetation greenness and health (Mishra et al., 2021; Nandi et al., 2020) [7,8] . Landsat-8 Operational Land Imager (OLI), were acquired from the United States Geological Survey (USGS) and Copernicus Open Access Hub platforms, respectively. These datasets, known for their moderate spatial resolution (10-30 m) and high temporal frequency, were selected to ensure consistency in long-term trend analysis (Mishra et al., 2025) [6] .
Seasonal Classification and Image Processing
The temporal dataset was classified into two distinct seasonal periods pre-monsoon (March-June), representing dry and hot conditions with low soil moisture, and postmonsoon (September-December), representing the phase of high rainfall, soil moisture recharge, and vegetation regrowth (Kumari et al., 2023) [5] . Cloud-free images from these seasons were selected for each study year.
Preprocessing operations, including radiometric calibration, atmospheric correction, and geometric rectification, were performed using ERDAS Imagine 2020 and ArcGIS Pro 3.0 to enhance image accuracy.
Cyclone Data and Impact Analysis
To assess the influence of major tropical cyclones on vegetation health, data were collected from official reports of the India Meteorological Department (IMD) for Cyclone Amphan (2020), Cyclone Yaas (2021), Cyclone Mocha (2023), and Cyclone Remal (2024). Cyclone track, intensity, and wind-speed data were integrated into the GIS environment to delineate impact zones across the sanctuary (Nandi et al., 2020) [8] . Pre-and post-cyclone NDVI composites were compared to quantify vegetation loss and regeneration. NDVI maxima and minima were extracted seasonally and annually to analyze inter-annual trends in vegetation performance and ecosystem recovery (Mishra et al., 2025) [6] .
Data Validation and Statistical Analysis
Ground reference data and vegetation records from the Forest Department, Government of Odisha, along with published ecological assessments on bird diversity and habitat quality, were used for validation (Palei et al., 2020; Rajendra, 2024) [9,10] . Statistical analyses, including correlation, temporal trend analysis, and mean NDVI variation to interpret the relationship between vegetation condition and cyclonic disturbances. The methodological framework, therefore, integrates satellite remote sensing, seasonal NDVI classification, and cyclone impact modeling to evaluate vegetation dynamics, ecological resilience, and regeneration capacity of the Balukhanda-Konark Wildlife Sanctuary. compared seasonally and annually.
Study Area: Balukhand Wildlife Sanctuary, Puri, Odisha
The Balukhand Wildlife Sanctuary, also referred to as Balukhand-Konark Wildlife Sanctuary, is a coastal protected area located along the Bay of Bengal coast in Puri district, Odisha, India (21.87°N, 86.09°E) (Bal et al., 2023) [1] . The sanctuary was established in 1984 and spans approximately 87 km², encompassing a variety of ecosystems including sandy beaches, coastal dunes, casuarina plantations, and sparse forest patches (Bal et al., 2023; e-Planet, 2018) [1,3] . Ecologically, the sanctuary supports rich biodiversity, including mammals such as spotted deer (Axis axis), blackbuck (Antilope cervicapra), jungle cat (Felis chaus), hyena (Hyaena hyaena), and jackal (Canis aureus), as well as diverse bird populations and reptiles (Bal et al., 2023; e-Planet, 2018) [1,3] . Olive Ridley sea turtles (Lepidochelys olivacea) utilize the coastal beaches of the sanctuary for nesting during breeding seasons (Bal et al., 2023) [1] .
Recent conservation efforts have focused on habitat restoration and species reintroduction. For instance, blackbucks were reintroduced into the sanctuary in 2024 following local extirpation due to habitat loss and human disturbance (Times of India, 2023) [12] . Despite these measures, ecological studies indicate a decline in dense vegetation cover from 41.8% in 1993 to 37.1% in 2023, largely attributed to anthropogenic pressures and environmental stressors (Times of India, 2023) [12] .
The sanctuary is also notable for its avian diversity. A oneyear survey (February 2017-January 2018) recorded 230 bird species, including 113 resident species, 100 winter visitors, and 12 passage migrants, highlighting its importance as a coastal bird habitat (e-Planet, 2018) [3] . The area is accessible via the Puri-Konark Marine Drive and provides opportunities for eco-tourism, nature walks, and community-based forest management initiatives (Community Conserved Areas, 2023) [2] . [11] .
Results and Discussion
Results and Discussion
Pre-Monsoon Vegetation Status
The Pre-Monsoon NDVI map illustrates vegetation conditions in Balukhanda-Konark Wildlife Sanctuary during the Pre-Monsoon season (March-June) for the study period 2020-2024. This period represents the late dry season when vegetation stress is typically higher due to reduced rainfall and elevated temperatures. The Pre-Monsoon NDVI analysis for the period 2020-2024 reflects a distinct seasonal pattern of vegetation stress within the Balukhanda-Konark Wildlife Sanctuary (BKWLS). During this dry season, typically extending from March to June, vegetation cover exhibited lower NDVI values, indicating reduced chlorophyll activity and limited photosynthetic performance. This seasonal decline corresponds to the combined effects of elevated surface temperatures, declining soil moisture, and minimal precipitation, which collectively constrain plant growth and canopy density. Similar observations have been reported in other coastal forest ecosystems, where pre-monsoon aridity leads to temporary vegetation dormancy and leaf shedding (Mishra et al., 2021; Nandi et al., 2020) [7,8] . Spatially, areas dominated by Casuarina equisetifolia plantations and sand dune vegetation showed moderate NDVI values, reflecting their adaptive resilience to water stress and saline conditions. In contrast, patches of scrub forest and open coastal grasslands displayed low NDVI, signifying sparse vegetation and reduced biomass. These findings are consistent with those of Kumari et al. (2023) [5] , who emphasized the vulnerability of coastal forests during the dry phase prior to monsoonal recharge. Moreover, the temporal comparison across years revealed slight variations in NDVI intensity, influenced by antecedent rainfall and the residual impacts of cyclonic events such as Amphan (2020) and Yaas (2021), which temporarily altered canopy structure and vegetation density (Mishra et al., 2025) [6] . Overall, the Pre-Monsoon NDVI trend underscores the seasonal vegetation stress prevalent in the sanctuary and highlights the dependence of this fragile coastal ecosystem on monsoonal precipitation for regeneration and biomass recovery. The observed fluctuations further illustrate the ecological sensitivity of the Balukhanda-Konark region to climatic variability and hydrological constraints, warranting continuous monitoring for sustainable forest and biodiversity management.
Post-Monsoon Vegetation Status
The Post-Monsoon NDVI map represents vegetation conditions in Balukhanda-Konark Wildlife Sanctuary during the Post-Monsoon season (September-December) for the study period 2020-2024. This season corresponds to the period immediately following the monsoon rains, when vegetation recovery and regrowth are typically observed. The Post-Monsoon NDVI analysis for 2020-2024 reveals significant vegetation recovery within the Balukhanda-Konark Wildlife Sanctuary (BKWLS) following the annual monsoon rains. During the post-monsoon season (September-December), NDVI values were generally higher compared to the pre-monsoon period, indicating enhanced photosynthetic activity and improved vegetation health. This seasonal increase reflects the replenishment of soil moisture and the favorable climatic conditions that promote regrowth in both natural scrub forests and Casuarina equisetifolia plantations. Spatial patterns showed that areas previously stressed during the dry pre-monsoon season exhibited substantial recovery, whereas some patches affected by cyclonic disturbances such as Amphan (2020) and Yaas (2021) still showed lower NDVI values, highlighting localized lag in vegetation regeneration (Mishra et al., 2021; Nandi et al., 2020) [7,8] . The temporal comparison across the study period indicates that the sanctuary's vegetation demonstrates resilience to seasonal climatic variability and episodic cyclonic events. The findings align with earlier studies emphasizing the adaptive capacity of coastal forests to monsoonal cycles and post-disturbance recovery processes (Kumari et al., 2023; Mishra et al., 2025) [5,6] . Overall, the Post-Monsoon NDVI trends underscore the crucial role of monsoonal rainfall in restoring ecosystem productivity and maintaining the ecological stability of this sensitive coastal region.
NDVI Pattern Explanation
During the pre-monsoon period (March-June), NDVI values are generally lower, reflecting the combined effects of dry season stress and the impacts of cyclones, particularly in 2020 and 2021, which caused vegetation damage and reduced greenness. In contrast, during the post-monsoon period (September-December), NDVI values tend to be higher due to the replenishing effects of monsoon rainfall, which promote vegetation growth. This seasonal greening often partially offsets or masks the damage caused by cyclonic events, resulting in improved post-monsoon NDVI levels.
Conclusion
The NDVI analysis highlights the significant influence of cyclones and monsoon rainfall on coastal vegetation dynamics. In 2021, the pre-monsoon NDVI reached its lowest value (0.4025) due to the severe impact of Cyclone Yaas, which caused vegetation damage through uprooting, salinity intrusion, and sand deposition. Conversely, in 2024, the post-monsoon NDVI peaked at 0.4929, reflecting strong vegetation recovery following Cyclone Remal, aided by abundant monsoon rainfall. Overall, NDVI fluctuations in the study area are controlled by the combined effects of cyclonic disturbances and seasonal rainfall patterns. The analysis confirms that NDVI is a sensitive and reliable indicator of cyclone impacts on vegetation, capturing both damage and subsequent recovery. Casuarina plantations, in particular, demonstrate resilience with rapid regrowth after cyclonic events, whereas areas showing negative NDVI values correspond to sand dunes and zones affected by coastal erosion.
In conclusion, the vegetation response along the Odisha coast reflects a dynamic interplay of stress and regeneration cycles, driven by climatic extremes, highlighting the importance of monitoring NDVI for effective ecosystem management and coastal resilience planning.The NDVI analysis of Balukhanda-Konark Wildlife Sanctuary from 2020 to 2024 demonstrates pronounced seasonal variability and the significant influence of cyclonic disturbances on vegetation dynamics. Lower NDVI values during the premonsoon season reflect heightened vegetation stress driven by dry conditions and the direct impacts of cyclones, including canopy loss, saltwater intrusion, and sand deposition. In contrast, post-monsoon NDVI values indicate robust vegetation recovery, supported by monsoonal rainfall and favorable soil moisture conditions. Cyclonic events produced differential effects; for instance, Cyclone Yaas (2021) led to a marked reduction in NDVI, while Cyclone Remal (2024) coincided with substantial post-event vegetation regeneration. These findings underscore the sensitivity of coastal ecosystems to both seasonal climatic fluctuations and extreme weather events. Systematic NDVI monitoring provides a reliable tool for assessing vegetation health, understanding ecosystem resilience, and informing adaptive management strategies aimed at conserving coastal biodiversity and maintaining ecological stability in vulnerable regions.
Recommendations
Strengthen casuarina and native dune vegetation to mitigate cyclone wind/salt impacts. Continuous remote sensing-based NDVI monitoring for detecting ecosystem stress. Combine NDVI with ground biodiversity surveys for habitat management. Develop early-warning ecological resilience strategies for cyclone-prone zones.
Figures and tables from the paper
| Year | Post-Monsoon Max NDVI | Post-Monsoon Min NDVI | Pre-Monsoon Max NDVI | Pre-Monsoon Min NDVI |
|---|---|---|---|---|
| 2020 | 0.4295 | -0.0980 | 0.4258 | -0.0733 |
| 2021 | 0.4278 | -0.0454 | 0.4025 | -0.0774 |
| 2022 | 0.4469 | -0.0942 | 0.4251 | -0.0775 |
| 2023 | 0.4449 | -0.0825 | 0.4136 | -0.0833 |
| 2024 | 0.4929 | -0.0983 | 0.4192 | -0.0728 |
Table text extracted from the original PDF; superscript letters are shown inline. The original table image is below.
View original table image
References
12 in the original paper- Bal S, Ranjan K, Mishra P. Biodiversity and conservation in Balukhand-Konark Wildlife Sanctuary, Odisha, India. J Wildl Res. 2023;12(3):45-60.
- Community Conserved Areas. Balukhand-Konark Wildlife Sanctuary: Conservation and community initiatives; 2023. DOI: https://communityconservedareas.org/data/show/240
- e-Planet. Avian diversity of Balukhand-Konark Wildlife Sanctuary. E-Planet J Environ Stud. 2018;18(1):23-32.
- Balukhanda-Konark Wildlife Sanctuary; 2023. DOI: https://forest.odisha.gov.in/
- Kumari S, Sharma A, Swarup S. Mitigation of immediate damages from tropical cyclones on the coastal forest ecosystem: A case of wildlife sanctuaries. J Wildl Biodivers. 2023;7(1):1-12. DOI: 10.5281/zenodo.7675254
- Mishra M, Bhattacharyya D, Mondal B, Paul S, da Silva RM, Santos CAG, et al. Forecasting shoreline dynamics and land use/land cover changes in Balukhand-Konark Wildlife Sanctuary (India) using geospatial techniques and machine learning. Sci Total Environ. 2025;179207. DOI: 10.1016/j.scitotenv.2025.179207
- Mishra M, Santos CAG, Silva DRM, Rana NK, Kar D, Parida NR. Monitoring vegetation loss and shoreline change due to tropical cyclone Fani using Landsat imageries in Balukhand-Konark Wildlife Sanctuary, India. J Coast Conserv. 2021;25(6):53. DOI: 10.1007/s11852-021-00840-5
- Nandi G, Neogy S, Roy AK, Datta D. Immediate disturbances induced by tropical cyclone Fani on the coastal forest landscape of eastern India: A geospatial analysis. Remote Sens Appl Soc Environ. 2020;20:100407. DOI: 10.1016/j.rsase.2020.100407
- Palei NC, Bal AK, Rath BP, Udgata HB. Birds of Balukhanda-Konark Wildlife Sanctuary with their residential and breeding status. e-Planet. 2020;18(1):6178.
- Rajendra S. New record of a marine heterobranch, Dendrodoris (specimen collected from the Nuanai River, within Balukhand-Konark Wildlife Sanctuary, Odisha). Rec Zool Surv India. 2024;3(12):43-49.
- Shahfahad S, Zheng B, Nawaz MF, Li X, Yang G. Application of remote sensing vegetation indices for crop monitoring and management: A review. Remote Sens. 2021;13(12):2421. DOI: 10.3390/rs13122421
- Times of India. Balukhand-Konark Wildlife Sanctuary facing ecological challenges. 2023 Jan 15. DOI: https://timesofindia.indiatimes.com/city/bhubaneswar/b alukhand-konark-wildlife-sanctuary-facing-ecologicalchallenges-study/articleshow/120041931.cms