
Research article · 2025 · Full text
International Journal of Agriculture and Food ScienceComparative Analysis of Marketing Channels and Efficiency in Tomato Agribusiness: A Case Study from Ballia District, Uttar Pradesh
Volume 7(10) · Pages 520–523 · DOI: 10.33545/2664844x.2025.v7.i10h.915 ↗
Research areasAgricultural Economics and PracticesAgricultural Innovations and PracticesSmart Agriculture and AI
Abstract
Author-writtenThis study examines the marketing channels and their efficiency in the tomato agribusiness sector within Ballia district, Uttar Pradesh. Tomato (Solanum lycopersicum) is a high-value, widely cultivated vegetable crop with significant economic importance due to its nutritional value and market demand. The research employed purposive-cum-random sampling to select 100 tomato farmers across different landholding categories, along with wholesalers, distributors, and retailers, to analyze the marketing costs, margins, price spread, producer’s share in consumer rupee, and overall marketing efficiency. Three marketing channels were analyzed: Channel 1 (Producer → Consumer), Channel 2 (Producer → Wholesaler → Retailer → Consumer), and Channel 3 (Producer → Commission Agent → Wholesaler → Retailer → Consumer). The producer sale price remained constant at ₹1900 per quintal across all channels, while marketing costs borne by producers were ₹630 per quintal. The final consumer prices varied, with ₹3000, ₹3200, and ₹3400 per quintal for Channels 1, 2, and 3, respectively. The producer’s share in consumer rupee decreased progressively from 63.33% in Channel 1 to 59.38% in Channel 2 and 55.88% in Channel 3. Correspondingly, marketing efficiency declined from 2.77 to 1.85 and 1.61 across the channels, indicating increased intermediary costs and reduced benefits for producers in longer chains. The study highlights the need for streamlined marketing channels, reduced intermediaries, and improved infrastructure to enhance producer profitability and supply chain efficiency. Policy interventions such as promoting Farmer Producer Organizations and direct marketing can significantly improve farmers’ income and market access in the tomato agribusiness sector.
Summary
Source-checkedPlain-language reading of the full paper, prepared with AI and checked against the text. Each point links to the authors' own words.
Why it matters
- Tomatoes are high-value vegetable crops with significant economic importance driven by market demand and nutritional value. View evidence ↗
- Tomato marketing is challenging because the crop is perishable, prices fluctuate, storage is lacking, and there are many intermediaries. View evidence ↗
- The challenges in the tomato supply chain often lead to lower profit margins for the farmers. View evidence ↗
The question
- The study aims to examine the efficiency of different tomato marketing channels in the Ballia district of Uttar Pradesh. View evidence ↗
What they did
- The research sampled 100 tomato farmers across various landholding sizes, as well as 5 wholesalers, 5 distributors, and 10 retailers. View evidence ↗
- The analysis utilized data collected from the agricultural years 2022 to 2024. View evidence ↗
- The study compared three channels: direct sales to consumers, a chain involving wholesalers and retailers, and a longer chain adding a commission agent. View evidence ↗
- Primary data were gathered using structured personal interviews. View evidence ↗
What they found
- Across all three marketing channels, the producer sale price was ₹1900 per quintal and the producer's marketing costs were ₹630 per quintal. View evidence ↗
- Consumer prices increased as the channel lengthened, rising from ₹3000 in Channel 1 to ₹3200 in Channel 2 and ₹3400 in Channel 3 per quintal. View evidence ↗
- The producer's share of the consumer's payment dropped from 63.33% in the direct channel to 55.88% in the longest channel. View evidence ↗
What it means
- The authors conclude that reducing intermediaries and improving infrastructure are necessary to increase producer profits and efficiency. View evidence ↗
- The authors recommend promoting direct marketing and Farmer Producer Organizations (FPOs) to improve farmer income. View evidence ↗
Visual summary
2 visualsIllustrations explain the paper; charts are replotted from the paper's own table values.
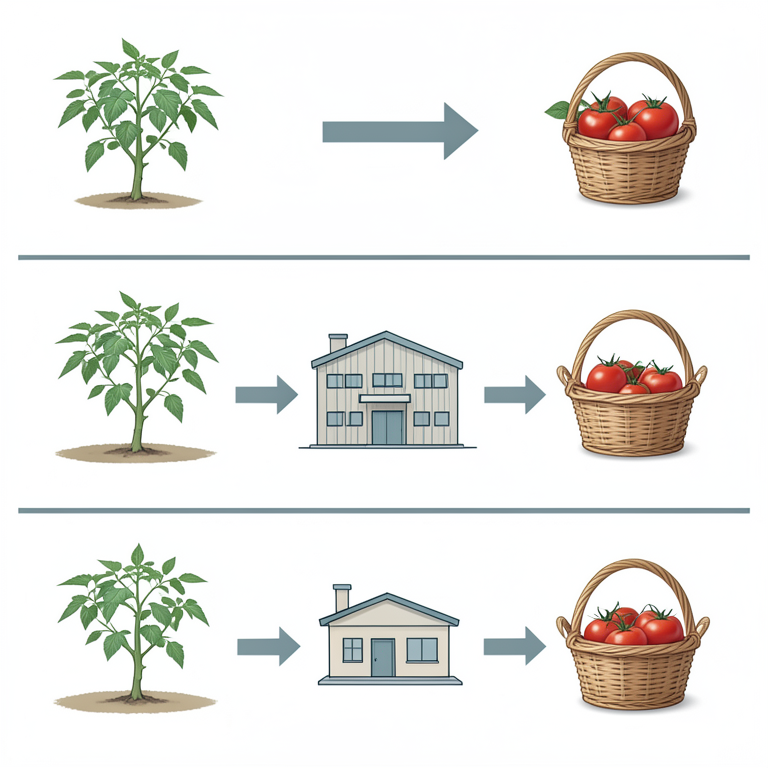
Tomato Marketing Channel Comparison
AI-generated conceptual illustration (Tomato plants and harvested tomatoes in a supply chain). It explains the idea and does not show study data.
View source evidence ↗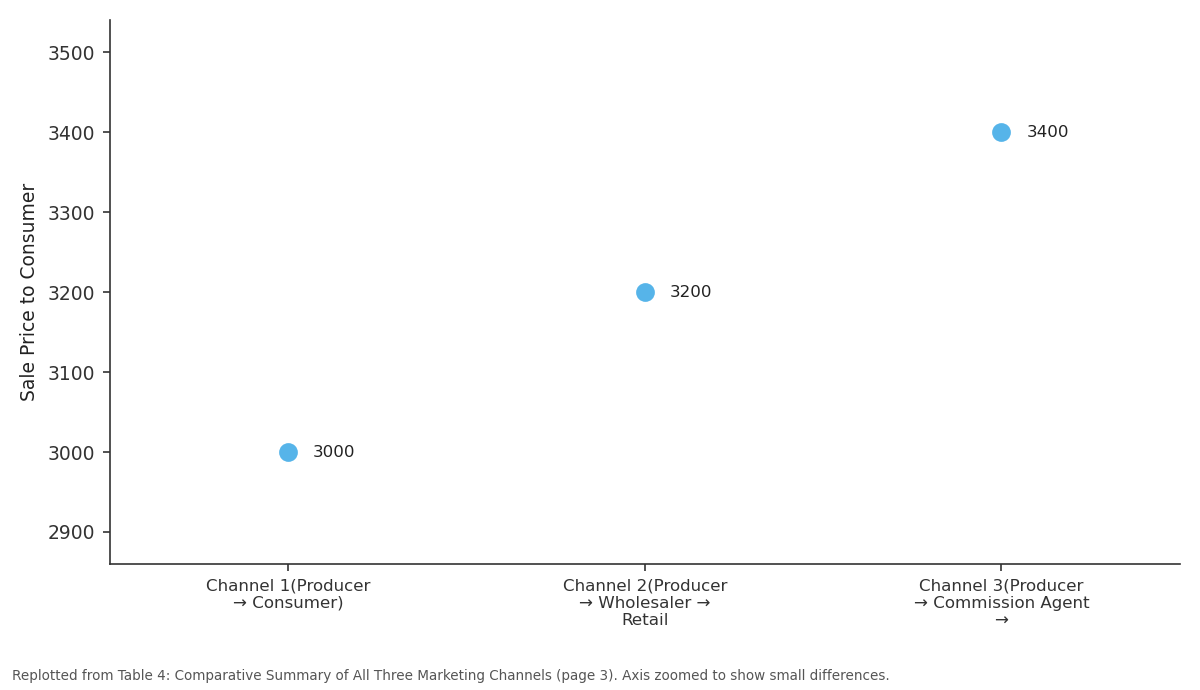
Sale Price to Consumer: Channel 1(Producer →... vs Channel 2(Producer →... vs Channel 3(Producer →...
Replotted from Table 4 (page 3) of the original paper. Every bar is the paper's own table value.
View source evidence ↗Figures & tables
From the original paper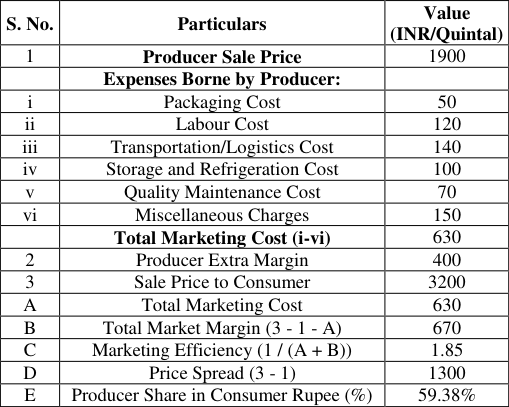 Table 2
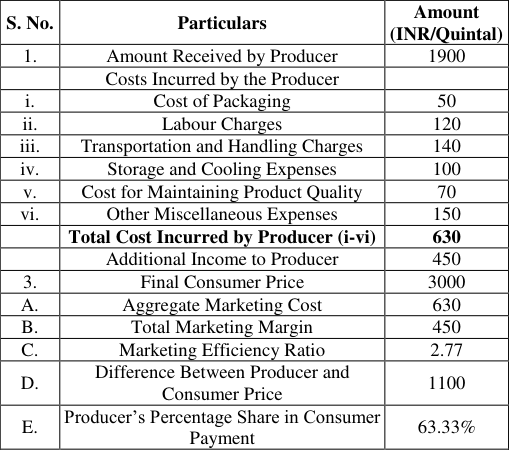 Table 1
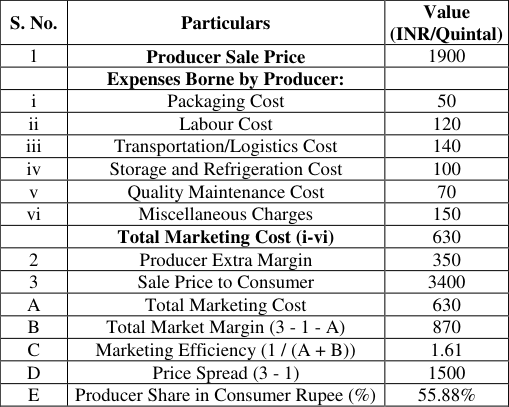 Table 3
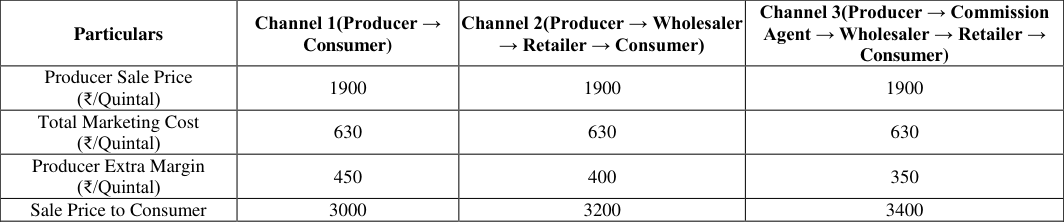 Table 4
Introduction
Tomato (Solanum lycopersicum), a member of the Solanaceae family, was considered one of the most important and widely grown vegetable crops across the world. Believed to have originated in western South America, it had spread globally due to its adaptability to diverse agro-climatic conditions and its significant demand in domestic and international markets. In India, tomato cultivation had gained popularity among farmers owing to its short duration, high yield potential, and profitability. Tomatoes were known for their rich nutritional composition, including essential vitamins such as A and C, minerals like potassium and iron, and the powerful antioxidant lycopene, which contributed to various health benefits. The crop was used extensively in both fresh and processed forms, making it a staple in culinary applications. Tomato cultivation required well-drained, fertile soils and moderate climatic conditions, and advances in agricultural practices and improved hybrid varieties had further enhanced its productivity and quality. Economically, tomato farming played a crucial role in improving farmers' incomes and supported numerous stakeholders in the agricultural value chain, including traders, processors, and retailers. However, despite its economic significance, the marketing of tomato often remained a challenge due to its perishable nature, price fluctuations, lack of storage facilities, and the presence of multiple intermediaries. These issues often resulted in reduced profit margins for producers. Therefore, understanding the marketing systems, cost components, and efficiency of various marketing channels became essential to ensure fair returns to farmers and to strengthen the overall value chain of tomato cultivation and trade.
Research Methodology
The present study employed a purposive-cum-random sampling technique to ensure both relevance and representativeness in the selection process. Ballia district in Uttar Pradesh was purposively selected to minimize logistical challenges and time constraints. Within the district, Bansdih block was chosen based on the predominance of tomato cultivation among farmers. A complete list of villages in the selected block was compiled, from which five percent of the villages with a significant number of tomato growers were randomly selected. From these villages, a comprehensive list of tomato farmers was prepared and stratified into five categories based on landholding size: Marginal (less than 1 hectare), Small (1-2 hectares), Semi-medium (2-4 hectares), Medium (4-10 hectares), and Large (more than 10 hectares). A total of 100 tomato farmers were selected using proportionate random sampling across these categories. Furthermore, to assess marketing dynamics, 5 wholesalers, 5 distributors, and 10 retailers were selected to analyze parameters such as marketing cost, marketing margin, price spread, producer's share in consumer rupee, and marketing efficiency. Primary data were collected through direct personal interviews using a well-structured and pre-tested schedule, while secondary data were obtained from published sources including books, journals, government reports, and official records from district and block offices. The data collected were subjected to appropriate statistical analysis for interpretation. The study was based on data pertaining to the agricultural years 2022 to 2024. while incurring various expenses such as packaging (₹50), labour (₹120), transportation (₹140), storage (₹100), quality maintenance (₹70), and miscellaneous charges (₹150), amounting to a total marketing cost of ₹630 per quintal. An additional margin of ₹450 was earned by the producer. The consumer paid ₹3000 per quintal, leading to a price spread of ₹1100 between producer and consumer prices. The marketing efficiency was calculated at 2.77, indicating a favorable cost-benefit ratio for the producer. The producer's share in the consumer's expenditure stood at 63.33%, reflecting a substantial return to the farmer. This analysis showed that direct marketing without intermediaries allowed producers to retain a significant portion of the final price, thereby enhancing profitability and reducing distribution inefficiencies. Overall, the channel proved economically beneficial for tomato growers in the study area. 2: Marketing Channel 2 represents a traditional and commonly used supply chain, where agricultural produce moves from the producer to the wholesaler, then to the retailer, and finally reaches the consumer. In this structure, the producer sells the product at ₹1900 per quintal. To bring the product to market, the producer incurs several costs including packaging (₹50), labour (₹120), transportation (₹140), storage and refrigeration (₹100), quality maintenance (₹70), and miscellaneous charges (₹150), summing up to a total marketing cost of ₹630 per quintal. In addition to covering these expenses, the producer also factors in an extra margin of ₹400, possibly representing profit, risk coverage, or incentive. The final sale price to the consumer is ₹3200 per quintal. From this, the total market margin-earned by the intermediaries (wholesaler and retailer)-is calculated as ₹670 (i.e., the difference between the consumer price and the sum of the producer's sale price and marketing costs). This margin reflects the earnings of intermediaries for their roles in handling, distributing, and selling the product. The marketing efficiency of this channel stands at 1.85, which is calculated by dividing the producer's sale price by the combined total of marketing cost and market margin. A marketing efficiency value above 1 indicates a reasonably efficient channel; however, the goal is to maximize this ratio by minimizing costs and intermediary margins. The price spread, defined as the difference between the consumer price and the producer's sale price, is ₹1300. This amount represents the value lost by the producer in the chain, highlighting the extent to which the consumer's payment is distributed among intermediaries and costs. The producer's share in the consumer rupee is 59.38%, meaning that for every ₹1 spent by the consumer, the producer receives about 59 paise. While this is better than in longer and more fragmented channels, it still indicates that over 40% of the consumer's payment does not go to the producer, but rather to cover marketing expenses and intermediary profits. In summary, Marketing Channel 2 offers a moderately efficient supply chain, with limited intermediaries and reasonable cost structures. However, there is still room for improvement. Reducing marketing costs through shared infrastructure, cooperative marketing, and digital platforms could improve both the producer's share and the overall efficiency of the channel. Transitioning toward direct marketing or establishing Farmer Producer Organizations (FPOs) could further enhance the producer's income by cutting down intermediary margins and improving negotiation power. Marketing Channel 3 is a longer and more layered supply chain that involves an additional intermediarythe commission agentbetween the producer and the wholesaler. In this structure, the agricultural produce passes through four levels before reaching the final consumer: starting with the producer, then the commission agent, followed by the wholesaler and retailer. The producer sells the commodity at ₹1900 per quintal. To prepare the product for market, the producer bears various costs including packaging (₹50), labour (₹120), transportation and logistics (₹140), storage and refrigeration (₹100), quality maintenance (₹70), and miscellaneous charges (₹150). These expenses add up to a total marketing cost of ₹630 per quintal, which reflects the producer's efforts in making the produce market-ready.
Analytical
In this channel, the producer's extra margin is ₹350slightly lower than in Channel 2possibly due to reduced bargaining power or higher commission cuts by agents. The final price paid by the consumer is ₹3400 per quintal. From this, the total market margin, calculated as the difference between the consumer price and the sum of producer's sale price and producer's marketing costs, stands at ₹870. This is the combined margin distributed among the commission agent, wholesaler, and retailer, indicating higher intermediary involvement and profit extraction compared to shorter channels. The marketing efficiency in Channel 3 is calculated at 1.61, which is lower than the efficiency in Channel 2 (1.85). This decline reflects the negative impact of additional intermediaries, where more of the consumer's rupee is absorbed in commissions and operational margins, rather than reaching the producer. The price spread in this channel is ₹1500 (i.e., the difference between what the consumer pays and what the producer receives), indicating a broader gap between farm gate and retail prices. This widening price spread suggests lower efficiency and greater scope for value leakage in the supply chain. The producer's share in the consumer rupee is only 55.88%, meaning that for every ₹1 spent by the consumer, the producer receives just under 56 paise. This is a drop from 59.38% in Channel 2, showing that the presence of a commission agent further dilutes the producer's income. It underscores how extended marketing chains can erode the producer's share, even when the consumer pays a higher price.
In conclusion, Marketing Channel 3, though functional, demonstrates lower efficiency and reduced producer benefit due to the involvement of more intermediaries. The increased market margin and reduced producer share suggest that this channel is less favorable for farmers. To improve outcomes, efforts should be made to reduce reliance on commission agents and streamline the supply chain through direct marketing, contract farming, or the formation of Farmer Producer Organizations (FPOs). These approaches can help farmers retain a larger portion of the consumer price while minimizing the exploitative nature of traditional, intermediary-heavy marketing systems. indicates greater costs and margins accumulated along the chain, which reduces the share of the consumer's payment that reaches the producer. In summary, as the number of intermediaries in the marketing channel increases from one to three, the producer's share in consumer rupees decreases, the price spread widens, and marketing efficiency declines. While longer channels may improve market access and provide services such as aggregation and distribution, they often reduce the actual income producers receive. Efforts to streamline the supply chain by reducing intermediaries, improving infrastructure, or adopting direct marketing can enhance producer profitability and supply chain efficiency.
Conclusion
The analysis of the marketing cost structure and price distribution of tomatoes revealed important insights into the involvement and margins of intermediaries within the supply chain. accounted for about 63.33% of the consumer price, showing that producers received the majority of the final price while intermediaries claimed a significant portion. These findings highlight the importance of improving marketing efficiency to reduce costs and enhance the profitability of tomato producers, while also ensuring fair margins for intermediaries and reasonable prices for consumers.
Figures and tables from the paper
| S. No. | Particulars | Value (INR/Quintal) |
|---|---|---|
| 1 | Producer Sale Price | 1900 |
| Expenses Borne by Producer: | ||
| i | Packaging Cost | 50 |
| ii | Labour Cost | 120 |
| iii | Transportation/Logistics Cost | 140 |
| iv | Storage and Refrigeration Cost | 100 |
| v | Quality Maintenance Cost | 70 |
| vi | Miscellaneous Charges | 150 |
| Total Marketing Cost (i-vi) | 630 | |
| 2 | Producer Extra Margin | 400 |
| 3 | Sale Price to Consumer | 3200 |
| A | Total Marketing Cost | 630 |
| B | Total Market Margin (3 - 1 - A) | 670 |
| C | Marketing Efficiency (1 / (A + B)) | 1.85 |
| D | Price Spread (3 - 1) | 1300 |
| E | Producer Share in Consumer Rupee (%) | 59.38% |
Table text extracted from the original PDF; superscript letters are shown inline. The original table image is below.
View original table image
| S. No. | Particulars | Amount (INR/Quintal) |
|---|---|---|
| 1. | Amount Received by Producer | 1900 |
| Costs Incurred by the Producer | ||
| i. | Cost of Packaging | 50 |
| ii. | Labour Charges | 120 |
| iii. | Transportation and Handling Charges | 140 |
| iv. | Storage and Cooling Expenses | 100 |
| v. | Cost for Maintaining Product Quality | 70 |
| vi. | Other Miscellaneous Expenses | 150 |
| Total Cost Incurred by Producer (i-vi) | 630 | |
| Additional Income to Producer | 450 | |
| 3. | Final Consumer Price | 3000 |
| A. | Aggregate Marketing Cost | 630 |
| B. | Total Marketing Margin | 450 |
| C. | Marketing Efficiency Ratio | 2.77 |
| D. | Difference Between Producer and Consumer Price | 1100 |
| E. | Producer’s Percentage Share in Consumer Payment | 63.33% |
Table text extracted from the original PDF; superscript letters are shown inline. The original table image is below.
View original table image
| S. No. | Particulars | Value (INR/Quintal) |
|---|---|---|
| 1 | Producer Sale Price | 1900 |
| Expenses Borne by Producer: | ||
| i | Packaging Cost | 50 |
| ii | Labour Cost | 120 |
| iii | Transportation/Logistics Cost | 140 |
| iv | Storage and Refrigeration Cost | 100 |
| v | Quality Maintenance Cost | 70 |
| vi | Miscellaneous Charges | 150 |
| Total Marketing Cost (i-vi) | 630 | |
| 2 | Producer Extra Margin | 350 |
| 3 | Sale Price to Consumer | 3400 |
| A | Total Marketing Cost | 630 |
| B | Total Market Margin (3 - 1 - A) | 870 |
| C | Marketing Efficiency (1 / (A + B)) | 1.61 |
| D | Price Spread (3 - 1) | 1500 |
| E | Producer Share in Consumer Rupee (%) | 55.88% |
Table text extracted from the original PDF; superscript letters are shown inline. The original table image is below.
View original table image
| Particulars | Channel 1(Producer → Consumer) | Channel 2(Producer → Wholesaler → Retailer → Consumer) | Channel 3(Producer → Commission Agent → Wholesaler → Retailer → Consumer) |
|---|---|---|---|
| Producer Sale Price (₹/Quintal) | 1900 | 1900 | 1900 |
| Total Marketing Cost (₹/Quintal) | 630 | 630 | 630 |
| Producer Extra Margin (₹/Quintal) | 450 | 400 | 350 |
| Sale Price to Consumer | 3000 | 3200 | 3400 |
Table text extracted from the original PDF; superscript letters are shown inline. The original table image is below.
View original table image
References
10 in the original paper- Ahmed M, Sharma R. Marketing efficiency and price spread analysis of tomato in Punjab. Int J Agric Sci. 2017;9(23):5210-4.
- Bhat AR, Kumar S. Supply chain analysis and marketing efficiency of tomatoes in Kashmir valley. Agric Econ Res Rev. 2018;31(1):55-62.
- Deshmukh SS, Patil AP. Marketing practices and constraints faced by tomato growers in Maharashtra. J Community Mobil Sustain Dev. 2019;14(2):120-5.
- Hussain S, Kumar A. Price spread and marketing efficiency of tomato in Uttar Pradesh. Indian J Agric Mark. 2016;30(3):45-53.
- Kaur R, Singh G. Analysis of marketing channels and price spread of tomatoes in Punjab. J Food Prod Mark. 2020;26(4):312-26.
- Kumar N, Yadav M. Constraints and marketing strategies of tomato growers in Rajasthan. Int J Agric Ext. 2018;6(1):23-9.
- Patel D, Shah M. Marketing efficiency of tomato in Gujarat: a case study. Indian J Econ Dev. 2017;13(4):642-8.
- Reddy KS, Rao PS. Post-harvest losses and marketing margins of tomato in Andhra Pradesh. J Agric Sci Technol. 2019;21(5):775-82.
- Sharma V, Singh P. Marketing channel analysis of tomato in Haryana state. Int J Bus Manag Invent. 2015;4(11):60-5.
- Verma S, Kumar R. Economic analysis of tomato marketing in Himachal Pradesh. J Agric Econ Dev. 2018;7(3):84-91.