
Research article · 2025 · Full text
International Journal of Biology SciencesEvaluation of field fertility gradient based on plot-to-plot soil characteristics and major nutrient N, P, K
Volume 7(10) · Pages 21–24 · DOI: 10.33545/26649926.2025.v7.i10a.493 ↗
Research areasOceanographic and Atmospheric ProcessesMarine and fisheries researchMarine Invertebrate Physiology and Ecology
Abstract
Author-writtenField experiments conducted over five consecutive years (2015-2020) at the Department of Agronomy, IGKV, Raipur, started with plotting the graphical pattern of N, P, K nutrients. The graphical fertility patterns were found to change for the years 2015-2016 to 2019-2020. These fertility gradients were found to be curvilinear, and not straight-line across the field. So, the ANCOVA with fertility covariates, N, P, K individually or their sum (N+P+K) plot to plot, were found to reduce error variance more effectively than the RBD, thereby improving the precision of treatment comparisons. Both methods of covariate adjustment, using N, P, K separately andusing their sum of N, P and K, performed well, often competing with each other in efficiency. Thus, ANCOVA using soil fertility data offers a robust alternative to RBD, especially when blocks cannot be correctly determined apriori. Overall, ANCOVA consistently reduced experimental error more effectively than RBD, improving reliability of results. So, in field experiments with unknown fertility gradient, ANCOVA with soil nutrient covariates proves to be a superior and more efficient analytical alternative compared to conventional RBD.
Summary
Source-checkedPlain-language reading of the full paper, prepared with AI and checked against the text. Each point links to the authors' own words.
Why it matters
- Agricultural research traditionally relies on Randomized Block Design (RBD), using local control to reduce experimental error. View evidence ↗
- Continuous cropping and nutrient management can alter soil fertility patterns over time, which may bias treatment comparisons and lower precision in long-term experiments. View evidence ↗
- Soil nutrients like Nitrogen (N), Phosphorus (P), and Potassium (K) are effective covariates because they vary by plot and directly affect crop performance. View evidence ↗
The question
- The study aimed to show that Analysis of Covariance (ANCOVA) using soil nutrient covariates is a more reliable framework for field experiments with undefined fertility gradients. View evidence ↗
What they did
- The researchers compared ANCOVA and RBD using data from long-term chickpea varietal experiments conducted at IGKV, Raipur, from 2015 to 2020. View evidence ↗
- The analysis used primary data consisting of rabi experiment results and post-kharif soil N, P, and K data from paddy crops. View evidence ↗
- ANCOVA was employed to reduce experimental error by combining ANOVA with regression to remove the effect of covariate variables on the response variable. View evidence ↗
- The methodology tested ANCOVA using either three separate covariates (N, P, and K) or a single combined covariate (N+P+K). View evidence ↗
What they found
- The combined fertility index (N+P+K) revealed a curvilinear fertility gradient across the field, rather than a straight-line pattern. View evidence ↗
- Using RBD alone failed to significantly reduce error variance, indicating that the assumed blocks did not align with the actual fertility gradient. View evidence ↗
- Applying ANCOVA with N, P, and K as covariates (individually or combined) substantially reduced the error mean square compared to standard RBD. View evidence ↗
- Treatment differences were more distinct and statistically significant under ANCOVA than under RBD, where they were often masked or less significant. View evidence ↗
What it means
- The authors conclude that using N, P, and K as covariates in ANCOVA significantly improves treatment precision and reduces error variance. View evidence ↗
- ANCOVA is recommended as a statistically efficient method for enhancing the reliability of results in field experiments on heterogeneous soils. View evidence ↗
Visual summary
1 visualsIllustrations explain the paper; they do not show study data.
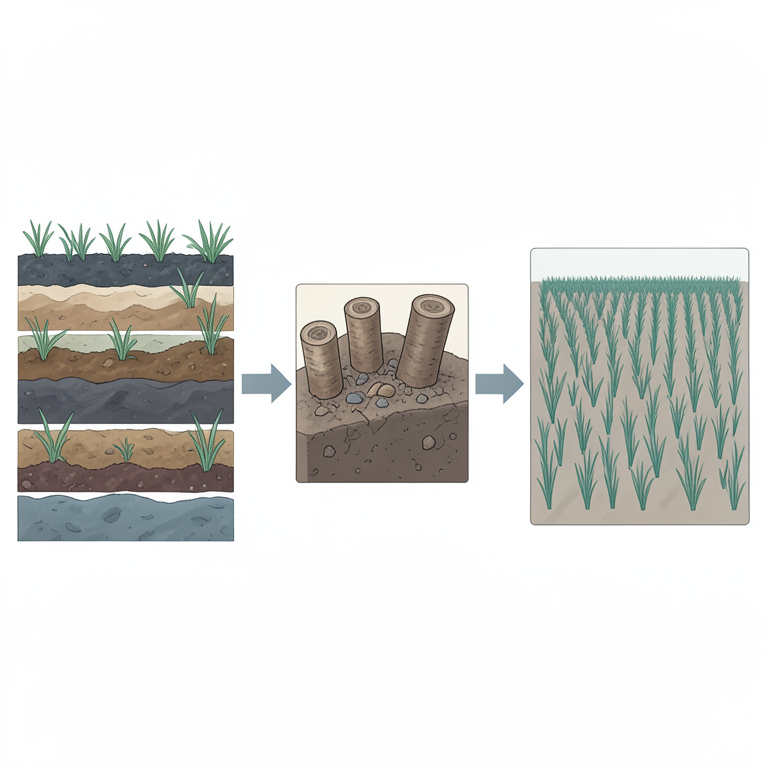
ANCOVA vs RBD Error Reduction
AI-generated conceptual illustration (Agricultural field plots of soil and crops). It explains the idea and does not show study data.
View source evidence ↗Figures & tables
From the original paper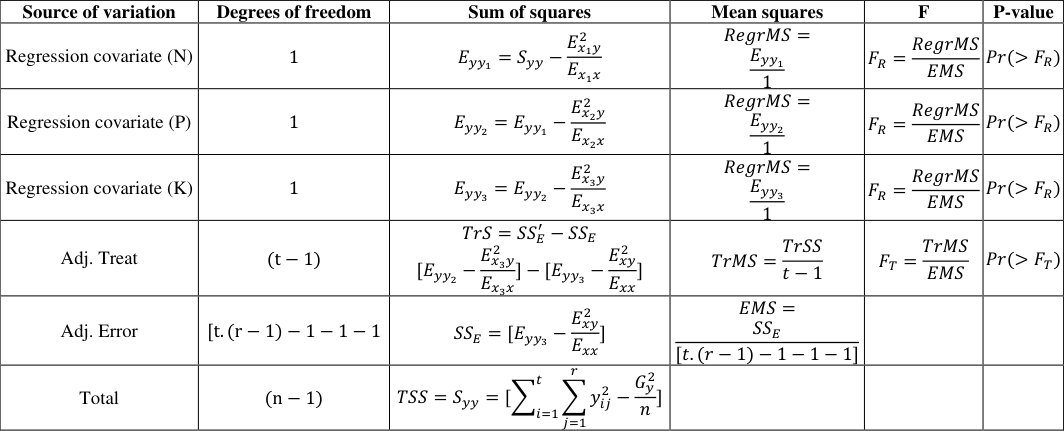 Table 1
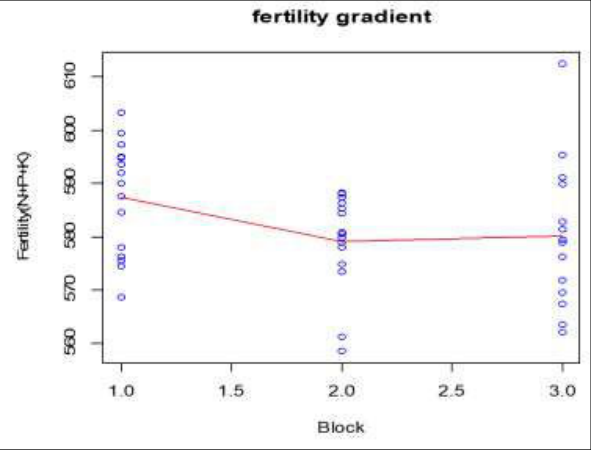 Figure 1
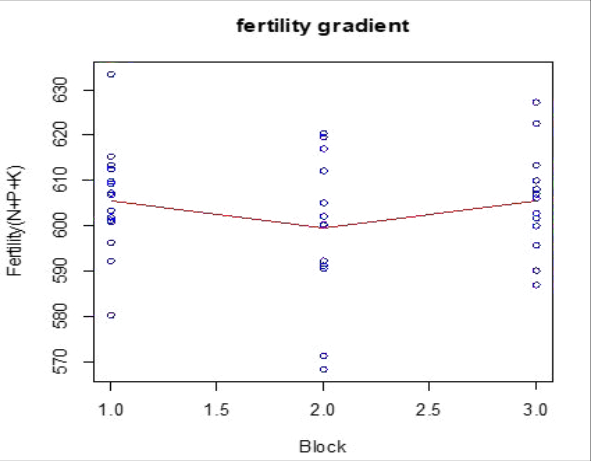 Figure 2
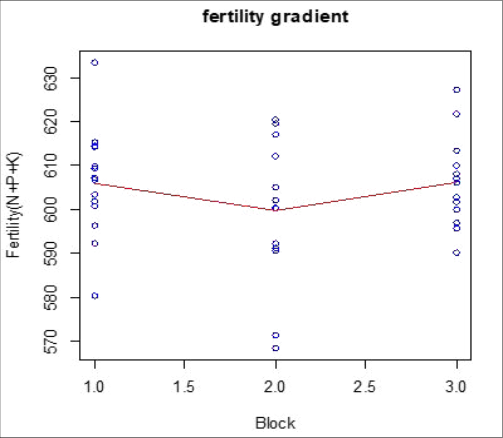 Figure 3
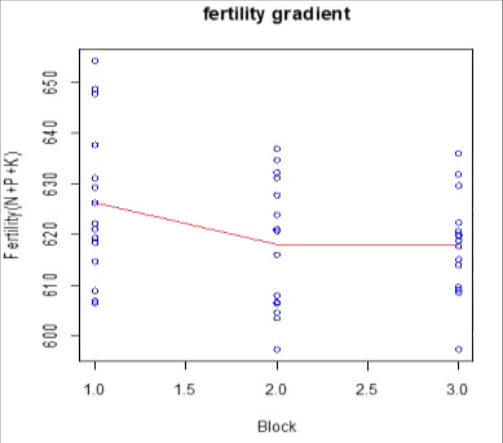 Figure 4
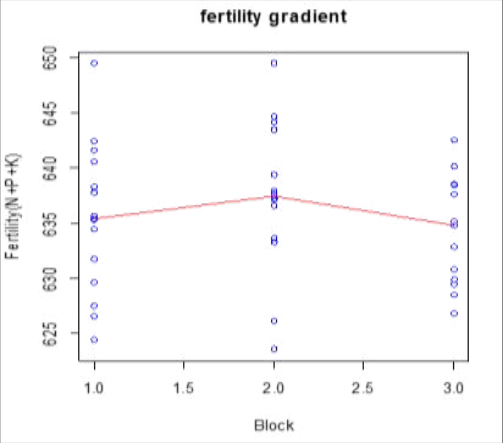 Figure 5
Introduction
Experimental designs form the foundation of agricultural research, where proper planning and analysis are essential to draw valid inferences. Traditionally, most field experiments are conducted using the Randomized Block Design (RBD), which is based on three principles: randomization, replication, and local control. Among these, local control is especially important as it helps reduce experimental error by accounting for variation within the field. However, in long-term experiments, the same RBD layouts are often reused for several years without reassessing the fertility gradient of the field. Over time, due to continuous cropping and nutrient management practices, soil fertility patterns may change, leading to biased treatment comparisons and reduced precision. (Fisher, R.A. 1932) [1] To overcome this limitation, Analysis of Covariance (ANCOVA) offers a powerful alternative. ANCOVA is a statistical method that combines Analysis of Variance (ANOVA) with regression by including additional continuous variables, called covariates, along with treatment effects. In agricultural experiments, soil nutrients such as Nitrogen (N), Phosphorus (P), and Potassium (K) can serve as important covariates because they directly influence crop performance and vary from plot to plot. By adjusting for this variability, ANCOVA reduces experimental error and increases the precision of treatment comparisons, even when fertility gradients are unknown or uneven across the field (Yang, R.C. and Juskiw, P. 2011) [10] . ANCOVA can be used as a technique for estimating the missing observations, whereby the experimenter needs to define one covariate corresponding to each one of the missing observations of the study/dependent variable (1945). Gomez and Gomez (1984) [2] , page 454-457 and Steel and Torrie (1980) [9] , page 426-428 have both given the procedures and illustrations with examples for one missing observation. While most statistics textbooks (e.g., Snedecor and Cochran 1980 [7] ; Gomez and Gomez 1984 [2] ; Steel et al. 1997) [8] have one chapter that is exclusively devoted to ANCOVA, there are books (e.g., Milliken and Johnson 2002) [4] that are totally devoted to the subject. Never theless, ANCOVA is an advanced topic that is only taught cursorily or ignored completely in many statistics classes (Piepho H.P. 2012) [5] . In the present study, the fertility gradient of an experimental field was assessed through plot-to-plot soil nutrient data (N, P, K). The study further evaluated the efficiency of ANCOVA compared to the traditional RBD in long-term chickpea Jukanti et al. (2012) [3] varietal experiments conducted at IGKV, Raipur, over five consecutive years (2015-2020). The objective was to demonstrate how ANCOVA with soil nutrient covariates can provide a more reliable and robust analytical framework for field experiments, particularly when fertility gradients are not clearly defined.
Materials and Methods
There was a national project on "All India Network Programming on Organic farming", whose sub-projects were run in the Department of Agronomy, College of Agriculture, Indira Gandhi Krishi Vishwavidyalaya (IGKV), Raipur. One such sub-project entitled "Evaluation of the response of different varieties of major crops for organic farming", was carried out at Instructional farm, IGKV, Raipur from 2015-2020. The proposed study is based on the primary data of this experiment, using their post-kharifexperiment soil N, P, and K data of paddy before their chickpea experiment in the following rabi season and the rabi experiment data.
Statistical Methods
Analysis of covariance (ANCOVA) is a mix of analysis of variance (ANOVA) and regression analysis, whereby the experimental error/residual error is reduced as a local control by first estimating (and thereby removing) the effect of regressor/covariate variable on the response variable, and then carrying out the ANOVA of the residuals so obtained on the levels of the treatment to finally estimate the effects of treatments more precisely than had it been estimated without first removing, as local control, the effect of the regressor variable/covariate from the response variable.
Ancova in Crd
Analysis of covariance in completely randomized design (CRD) with three covariates N, P and K as separate repressors. However, a separate case of single covariate ANCOVA in CRD also deals with the plot-to-plot (N+P+K) as the covariate. As already mentioned above the main focus would be on the three-covariate related methodology. To avoid the unnecessary increase in the length of the methodology further, for one covariate methodology it is sufficient to mention that all the methodology of three covariates will remain the same, except that only one covariate, say N will be replaced by the sum (N+P+K) as repressor and two covariates will be dropped. Singh, A.K. (2020) [6] .
𝑦 𝑖𝑗 = 𝜇 + 𝛽 1 (𝑥 1𝑖𝑗 -𝑥̅ 1 ) + 𝛽 2 (𝑥 2𝑖𝑗 -𝑥̅ 2 ) + 𝛽 3 (𝑥 3𝑖𝑗 -𝑥̅ 3 ) + 𝜏 𝑖 + 𝜖 𝑖𝑗 , 𝑖 = 1,2, … 𝑡 ; 𝑗 = 1,2, . . 𝑟 Where; 𝑦 𝑖𝑗 =The plot-to-plot observation of a given character for the 𝑗 𝑡ℎ plot and its treatment; 𝑖 = 1,2, . . 𝑡; 𝑗 = 1,2, . . 𝑟 𝜇 = General mean 𝛽 𝑘 = Partial regression coefficient of the 𝑘 𝑡ℎ covariate, which is centered; that is the corresponding covariates have been used after subtracting them from their respective means before using in the covariance analysis model; 𝑘 = 1,2,3 𝑥 1𝑖𝑗 = Plot to plot available soil Nitrogen (N);𝑖 = 1,2, . . 𝑡; 𝑗 = 1,2, . . 𝑟 𝑥 2𝑖𝑗 = Plot to plot available soil Phosphorus (P); 𝑖 = 1,2, . . 𝑡; 𝑗 = 1,2, . . 𝑟 𝑥 3𝑖𝑗 = Plot to plot available soil Nitrogen (K);𝑖 = 1,2, . . 𝑡; 𝑗 = 1,2, . . 𝑟 𝜏 𝑖 = It is the 𝑖 𝑡ℎ treatment effect, each level of which is replicated r times;𝑖 = 1,2, . . 𝑡 ∈ 𝑖𝑗 = Residual of the 𝑗 𝑡ℎ plot corresponding to 𝑖 𝑡ℎ treatment;𝑖 = 1,2, . . 𝑡; 𝑗 = 1,2, . . 𝑟
Where; 𝑦 𝑖𝑗 = The plot-to-plot observation of a given character for the 𝑗 𝑡ℎ plot and i th treatment; 𝑖 = 1,2, . . 𝑡; 𝑗 = 1,2, . . 𝑟 𝜇 = General mean γ = Partial regression coefficient of the 𝑘 𝑡ℎ covariate, which are centered; that is the corresponding covariates have been used after separating them from their respective means before using in the covariance analysis model.
x ij = Sum of plot-to-plot available soil nitrogen (N), soil phosphorus (P) and soil potash (K);𝑖 = 1,2, . . 𝑡; 𝑗 = 1,2, . . 𝑟
Results and Discussion
Determine the fertility gradient of the field where the fertility gradient was not known, despite the availability of plot-to-plot N, P, K values of the soil. The soil fertility data (N, P and K) collected plot-to-plot for the experimental fields during rabi season clearly indicated that the fertility gradient was not uniform across the experimental area. The combined fertility index (N+P+K) showed a curvilinear trend rather than a straight-line pattern. This confirms that assuming the same block structure as in the previous kharif season (rice experiment) would not adequately account for the existing fertility variation When the experiment was analyzed using Randomized Block Design (RBD) alone, the block effect did not significantly reduce the error variance, suggesting that the assumed blocks were not in alignment with the actual fertility gradient. However, when analysis of covariance (ANCOVA) was applied, taking N, P and K (individually and in combination) as covariates, the error mean square was substantially reduced compared to the standard RBD analysis. This shows that the inclusion of soil fertility values as covariates more effectively adjusted for fertility differences among plots. The adjusted treatment means after removing the effect of fertility covariates provided a more precise comparison of treatments. In most cases, the treatment differences became more distinct and statistically significant under ANCOVA, which were either masked or less significant under simple RBD analysis.
Conclusion
The study revealed a non-uniform fertility gradient across the field, rendering the standard RBD inadequate for controlling variability. Incorporating N, P, and K as covariates through ANCOVA significantly reduced error variance and improved treatment precision. Hence, ANCOVA proved to be a statistically efficient method for adjusting fertility effects and enhancing the reliability of experimental results on heterogeneous fields.
Acknowledgement
AcknowledgementWe would like to express our sincere gratitude to the developers of the open-source R programming libraries which were instrumental in implementing and evaluating the machine learning models. Authors are thankful to Department of Agricultural Vishwavidyalaya (IGKV) Raipur. during the completion of my research.
Figures and tables from the paper
References
10 in the original paper- Fisher RA. Statistical methods for research workers. 4th ed. Edinburgh (UK): Oliver and Boyd; 1932.
- Gomez KA, Gomez AA. Statistical procedures for agricultural research. 2nd ed. New York (NY): John Wiley & Sons; 1984.
- Jukanti AK, Gaur PM, Gowda CLL, Chibbar RN. Nutritional quality and health benefits of chickpea (Cicer arietinum L.): a review. British Journal of Nutrition. 2012;108(1):11-S26.
- Milliken GA, Johnson DE. Analysis of messy data. Volume III. Analysis of covariance. Boca Raton (FL): Chapman & Hall/CRC; 2002.
- Piepho HP. A SAS macro for generating letter displays of pairwise mean comparisons. Communications in Biometry and Crop Science. 2012;7(1):4-13.
- Singh AK. Practical design and analysis of experiments in statistics using R. 1st ed. New Delhi (IN): Brillion Publishing; 2020. p. 415-418.
- Snedecor GW, Cochran WG. Statistical methods. 7th ed. Ames (IA): Iowa State University Press; 1980.
- Steel RGD, Torrie JH, Dickey DA. Principles and procedures of statistics: a biometrical approach. 3rd ed. New York (NY): McGraw-Hill; 1997.
- Steel RGD, Torrie JH. Principles and procedures of statistics: a biometrical approach. 2nd ed. New York (NY): McGraw-Hill; 1980.
- Yang RC, Juskiw P. Analysis of covariance in agronomy and crop research. Canadian Journal of Plant Science. 2011;91(4):621-641.