
Research article · 2025 · Full text
International Journal of Agriculture and Food ScienceStability Analysis for Grain Yield and Yield Attributing Traits in Rabi Sorghum (Sorghum bicolor L. Moench)
Volume 7(10) · Pages 230–231 · DOI: 10.33545/2664844x.2025.v7.i10d.876 ↗
Research areasData Quality and ManagementComputational and Text Analysis MethodsAuthorship Attribution and Profiling
Abstract
Author-writtenThe present investigation was undertaken to assess the stability for grain yield and yield attributing traits in eight genotypes of rabi sorghum (Sorghum bicolor L. Moench) across different environments. The genotypes evaluated were Phule Yashomati, Phule Anuradha, CSV-22, Parbhani Moti, Maldandi-35-1, Phule Uttara, Phule Madhur, and RSV-2371. The experiment was conducted in a Randomized Block Design (RBD) with three replications across multiple locations during the rabi season. Data were recorded on yield and its component traits such as days to 50% flowering, plant height, panicle length, test weight, and fodder yield. Significant differences were observed among genotypes, environments, and their interactions, indicating the presence of substantial genetic diversity and environmental influence. Stability analysis, carried out using the Eberhart and Russell (1966) model, revealed that genotypes Phule Yashomati, Phule Anuradha, and Phule Uttara exhibited high mean performance, regression coefficients near unity, and low deviations from regression—indicating wide adaptability and stable performance across environments. The study suggests that these genotypes are most suitable for consistent performance under variable rabi conditions.
Summary
Source-checkedPlain-language reading of the full paper, prepared with AI and checked against the text. Each point links to the authors' own words.
Why it matters
- Sorghum is a critical cereal crop for India's semi-arid and drought-prone regions, especially when grown during the rabi season. View evidence ↗
- Rabi sorghum productivity is unstable because it is highly sensitive to changes in soil fertility, temperature, and moisture stress. View evidence ↗
- Environmental variability creates genotype × environment (G×E) interactions, which make it difficult for breeders to select genotypes that are both high-yielding and stable. View evidence ↗
The question
- The study aimed to evaluate the stability of grain yield and related traits across eight rabi sorghum genotypes in different environments. View evidence ↗
What they did
- The research was conducted in 2024 at the G H Raisoni University Agricultural Research Farm in Saikheda, Madhya Pradesh, India. View evidence ↗
- Eight sorghum genotypes (Phule Yashomati, Phule Anuradha, CSV-22, Parbhani Moti, Maldandi-35-1, Phule Uttara, Phule Madhur, and RSV-2371) were tested using a Randomized Complete Block Design with three replications per environment. View evidence ↗
- Researchers measured days to 50% flowering, plant height, panicle length, 1000-grain weight, grain yield per plant, and fodder yield per hectare from five random plants per plot. View evidence ↗
What they found
- The study found significant differences between genotypes, environments, and their interactions, proving that both genetics and environment strongly influence performance. View evidence ↗
- Phule Yashomati achieved the highest mean grain yield of 37.8 q/ha, exceeding the overall mean of 35.7 q/ha. View evidence ↗
- Maldandi-35-1 and RSV-2371 were found to be unstable, characterized by higher regression coefficients (1.14 and 1.10) and higher deviations from regression (0.36 and 0.30). View evidence ↗
- The unstable genotypes, Maldandi-35-1 and RSV-2371, are considered specifically adapted, meaning they perform well only in favorable environments. View evidence ↗
What it means
- The authors concluded that Phule Yashomati, Phule Anuradha, and Phule Uttara are widely adaptable and suitable for the variable conditions of the rabi season. View evidence ↗
- The authors recommend using these stable genotypes for large-scale cultivation in limited irrigation or rainfed systems and for future breeding programs. View evidence ↗
Visual summary
3 visualsIllustrations explain the paper; charts are replotted from the paper's own table values.
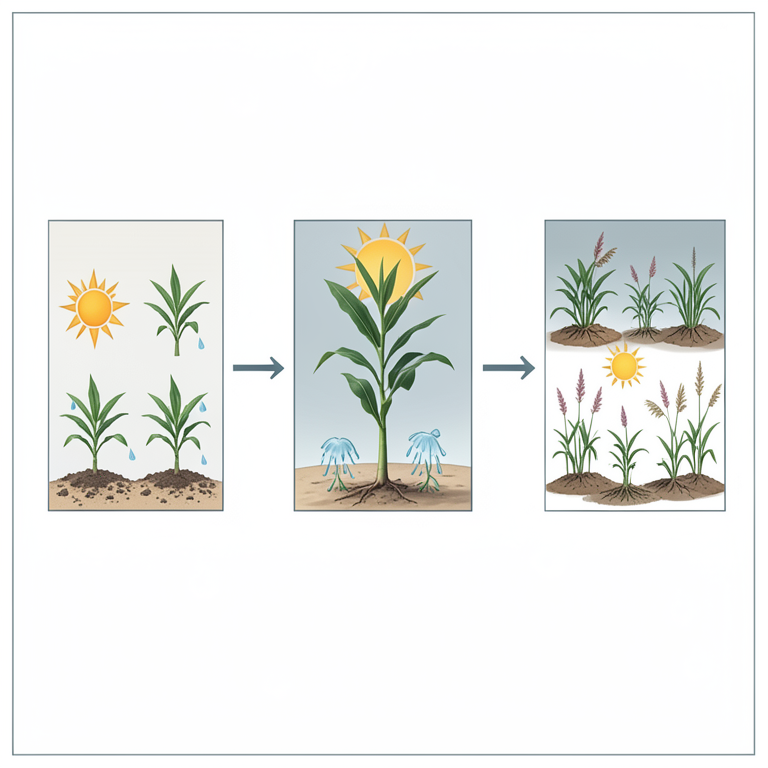
Stability Classification Concept
AI-generated conceptual illustration (Rabi sorghum plants (Sorghum bicolor L. Moench)). It explains the idea and does not show study data.
View source evidence ↗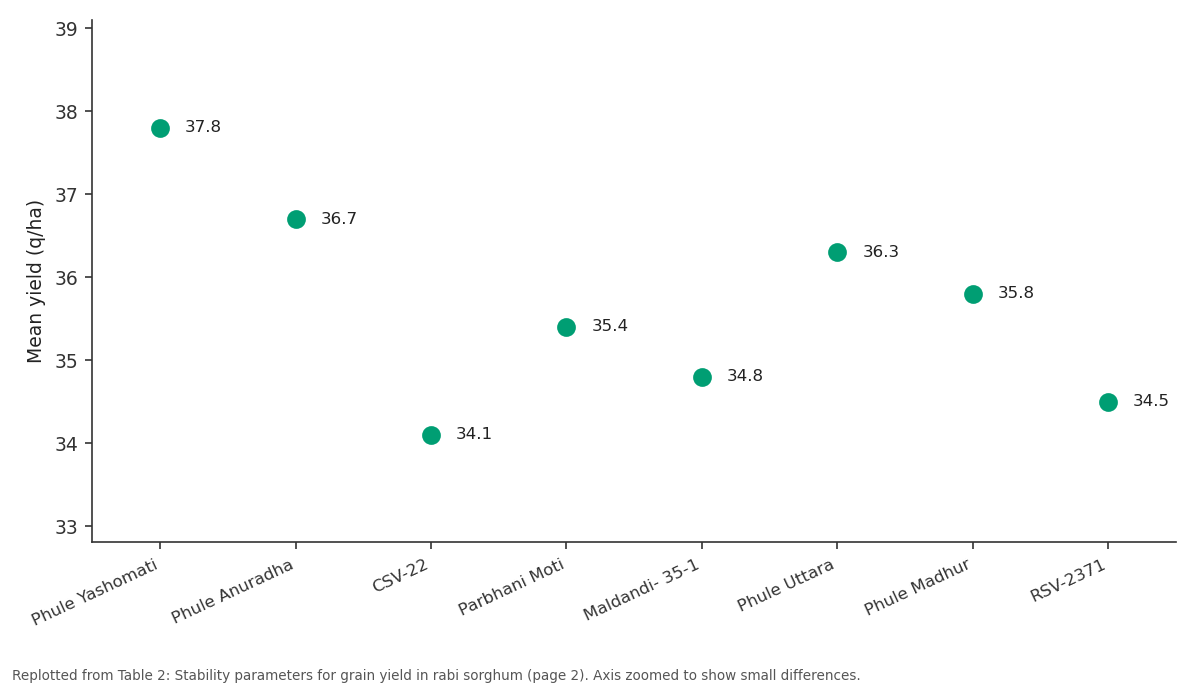
Mean yield (q/ha): Phule Yashomati vs Phule Anuradha vs CSV-22 vs Parbhani Moti vs Maldandi- 35-1
Replotted from Table 2 (page 2) of the original paper. Every bar is the paper's own table value.
View source evidence ↗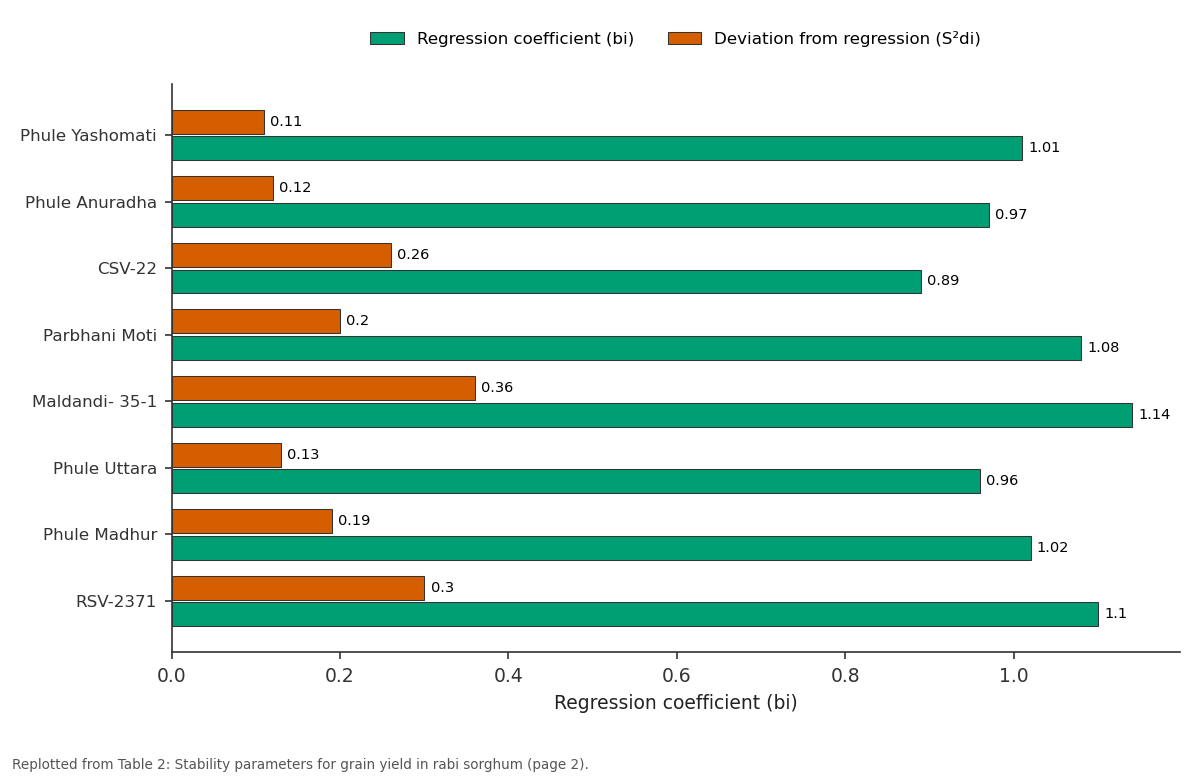
Regression coefficient (bi) and Deviation from regression (S²di): Phule Yashomati vs Phule Anuradha vs CSV-22 vs Parbhani Moti vs Maldandi- 35-1
Replotted from Table 2 (page 2) of the original paper. Every bar is the paper's own table value.
View source evidence ↗Figures & tables
From the original paper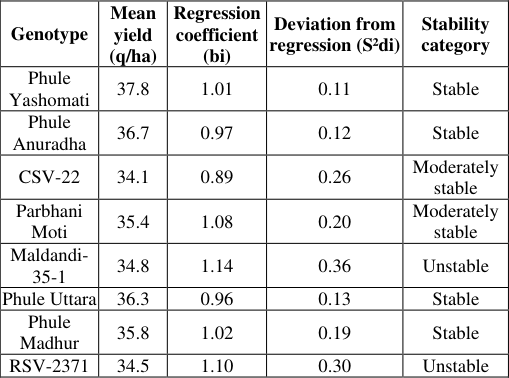 Table 2
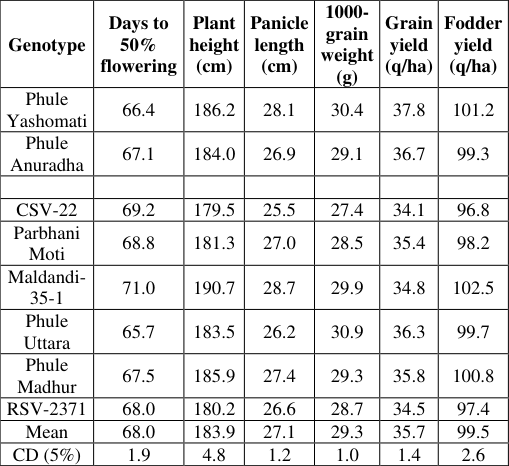 Table 1
Introduction
Sorghum (Sorghum bicolor L. Moench) is an important cereal crop grown in semi-arid and drought-prone areas of India, particularly during the rabi season. The productivity of rabi sorghum often fluctuates due to environmental variations such as soil moisture stress, temperature fluctuations, and differences in soil fertility. Such environmental variability leads to genotype × environment (G×E) interactions, complicating the selection of stable and high-yielding genotypes.
Understanding the stability of genotypes across environments helps breeders identify varieties that perform consistently. Therefore, the present study was conducted to assess the stability of grain yield and its attributing traits among eight promising rabi sorghum genotypes under varying environmental conditions.
Experimental
Site and Material The present investigation was carried out during the Kharif season of 2024 at the Agricultural Research Farm of G H Raisoni University, Saikheda (Madhya Pradesh, India), located in a subtropical region characterized by hot and humid summers and mild winters. The experimental site possesses well drained alluvial soils with moderate fertility.The field trial was laid out in a Randomized Complete Block Design (RCBD) with three replications replications in each environment. The eight Rabi sorghum genotypes used in the study were: Phule Yashomati, Phule Anuradha, CSV-22, Parbhani Moti, Maldandi-35-1, Phule Uttara, Phule Madhur, and RSV-2371. Each plot consisted of 4 rows, 5 meters in length, with a row- to-row spacing of 45 cm and plant-to-plant spacing of 15 cm. https://www.agriculturaljournals.com Table 2: Stability parameters for grain yield in rabi sorghum genotypes Genotype Deviation from regression (S²di) Stability category Mean yield (q/ha) Regression coefficient (bi) Phule Yashomati 37.8 1.01 0.11 Stable Phule Anuradha 36.7 0.97 0.12 Stable CSV-22 34.1 0.89 0.26 Moderately stable Parbhani Moti 35.4 1.08 0.20 Moderately stable Maldandi- 35-1 34.8 1.14 0.36 Unstable Phule Uttara 36.3 0.96 0.13 Stable Phule Madhur 35.8 1.02 0.19 Stable
| Genotype | Mean yield (q/ha) | Regression coefficient (bi) | Deviation from regression (S²di) | Stability category |
|---|---|---|---|---|
| Phule Yashomati | 37.8 | 1.01 | 0.11 | Stable |
| Phule Anuradha | 36.7 | 0.97 | 0.12 | Stable |
| CSV-22 | 34.1 | 0.89 | 0.26 | Moderately stable |
| Parbhani Moti | 35.4 | 1.08 | 0.20 | Moderately stable |
| Maldandi- 35-1 | 34.8 | 1.14 | 0.36 | Unstable |
| Phule Uttara | 36.3 | 0.96 | 0.13 | Stable |
| Phule Madhur | 35.8 | 1.02 | 0.19 | Stable |
| RSV-2371 | 34.5 | 1.10 | 0.30 | Unstable |
Table text extracted from the original PDF; superscript letters are shown inline. The original table image is below.
View original table image
Experimental
Materials Eight rabi sorghum genotypes were evaluated: 1. Phule Yashomati 2. Phule Anuradha 3. CSV-22 4.
Parbhani Moti 5. Maldandi-35-1 6. Phule Uttara 7. Phule Madhur 8.
RSV-2371 Observations recorded Five randomly selected plants per plot were tagged for recording observations on the following characters: Days to 50% flowering Plant height (cm) Panicle length (cm) 1000-grain weight (g) Grain yield per plant (g) Fodder yield per hectare (q/ha) Statistical analysis The data were subjected to Analysis of Variance (ANOVA) to determine the significance of genotypic, environmental, and G×E effects following the procedure of Panse and Sukhatme (1985) [2]. The stability parameters were estimated according to Eberhart and Russell (1966) [1], where: Xˉi\bar{X}_iXˉi: Mean performance of the i-th genotype bib_ibi: Regression coefficient indicating response to environmental changes Sdi2S^2_{di}Sdi2: Deviation from regression indicating stability A genotype with high mean yield, bi ≈ 1, and low S²di is considered stable and widely adapted.
Results
Table 1: Mean performance of rabi sorghum genotypes across environments Genotype Days to 50% flowering Plant height (cm) Panicle length (cm) Grain yield (q/ha) Fodder yield (q/ha) 1000- grain weight (g) Phule Yashomati 66.4 186.2 28.1 30.4 37.8 101.2 Phule Anuradha 67.1 184.0 26.9 29.1 36.7 99.3 CSV-22 69.2 179.5 25.5 27.4 34.1 96.8 Parbhani Moti 68.8 181.3 27.0 28.5 35.4 98.2 Maldandi- 35-1 71.0 190.7 28.7 29.9 34.8 102.5 Phule Uttara 65.7 183.5 26.2 30.9 36.3 99.7 Phule Madhur 67.5 185.9 27.4 29.3 35.8 100.8 RSV-2371 34.5 1.10 0.30 Unstable
| Genotype | Days to 50% flowering | Plant height (cm) | Panicle length (cm) | 1000- grain weight (g) | Grain yield (q/ha) | Fodder yield (q/ha) |
|---|---|---|---|---|---|---|
| Phule Yashomati | 66.4 | 186.2 | 28.1 | 30.4 | 37.8 | 101.2 |
| Phule Anuradha | 67.1 | 184.0 | 26.9 | 29.1 | 36.7 | 99.3 |
| CSV-22 | 69.2 | 179.5 | 25.5 | 27.4 | 34.1 | 96.8 |
| Parbhani Moti | 68.8 | 181.3 | 27.0 | 28.5 | 35.4 | 98.2 |
| Maldandi- 35-1 | 71.0 | 190.7 | 28.7 | 29.9 | 34.8 | 102.5 |
| Phule Uttara | 65.7 | 183.5 | 26.2 | 30.9 | 36.3 | 99.7 |
| Phule Madhur | 67.5 | 185.9 | 27.4 | 29.3 | 35.8 | 100.8 |
| RSV-2371 | 68.0 | 180.2 | 26.6 | 28.7 | 34.5 | 97.4 |
| Mean | 68.0 | 183.9 | 27.1 | 29.3 | 35.7 | 99.5 |
| CD (5%) | 1.9 | 4.8 | 1.2 | 1.0 | 1.4 | 2.6 |
Table text extracted from the original PDF; superscript letters are shown inline. The original table image is below.
View original table image
Discussion
Significant genotype × environment interaction was observed for grain yield and related traits, indicating that genotype performance varied across environments. Such interactions are common in rabi sorghum due to fluctuating soil moisture and temperature conditions. Genotypes Phule Yashomati, Phule Anuradha, and Phule Uttara displayed high mean yield, regression coefficients close to unity, and low deviations from regression—indicating wide adaptability and stable performance. These genotypes performed consistently under both favorable and marginal environments.
Conversely, Maldandi-35-1 and RSV-2371 exhibited higher regression coefficients (>1.0) and greater deviations, suggesting better performance only under favorable environments, hence, they are suitable for specific conditions. Overall, the findings demonstrate that stability analysis is a reliable approach for identifying both widely and specifically adapted genotypes in rabi sorghum.
Conclusion
The study revealed significant G×E interaction among eight rabi sorghum genotypes for grain yield and related traits. Based on mean performance and stability parameters, Phule Yashomati, Phule Anuradha, and Phule Uttara were identified as stable and widely adaptable genotypes suitable for variable rabi conditions. These genotypes can be recommended for inclusion in breeding programs and large- scale cultivation under rainfed and limited irrigation systems.
References
5 in the original paper- Eberhart SA, Russell WA. Stability parameters for comparing varieties. Crop Sci. 1966;6:36-40.
- Panse VG, Sukhatme PV. Statistical Methods for Agricultural Workers. New Delhi: ICAR Publication; 1985.
- Singh RK, Chaudhary BD. Biometrical Methods in Quantitative Genetic Analysis. New Delhi: Kalyani Publishers; 1985.
- Reddy BVS, Patil JV, Salimath PM, Gadakh SR, Kachole RR, Dangi KS, et al. Genetic improvement of rabi sorghum in India. Indian J Dryland Agric Res Dev. 2013;28(2):1-7.
- Patel PR, Chaudhari PP, Patel DD, Patel MS. Stability analysis for yield and its components in sorghum. J Pharmacogn Phytochem. 2019;8(3):1125-30. RSV-2371 68.0 180.2 26.6 28.7 34.5 97.4 Mean 68.0 183.9 27.1 29.3 35.7 99.5 CD (5%) 1.9 4.8 1.2 1.0 1.4 2.6