
Research article · 2025 · Full text
International Journal of Agriculture and Food ScienceEffect of Planting Geometry on Growth, Yield and Yield Attributes of Sweet Corn
Volume 7(10) · Pages 160–164 · DOI: 10.33545/2664844x.2025.v7.i10c.865 ↗
Research areasCrop Yield and Soil FertilityLeaf Properties and Growth MeasurementGreenhouse Technology and Climate Control
Abstract
Author-writtenA field experiment was conducted during the Rabi season of the year 2023-24 at the Instructional farm, Department of Agronomy, College of Agriculture, Junagadh Agricultural University, Junagadh, Gujarat, India to study the effect of planting geometry on growth, yield and yield attributes of sweet corn. The experiment was laid out in randomized block design (RBD) with five replications and six treatments with different planting geometries viz., T1 (30 cm × 10 cm), T2 (30 cm × 20 cm), T3 (45 cm × 10 cm), T4 (45 cm × 20 cm), T5 (60 cm × 10 cm), T6 (60 cm × 20 cm). The results of field experiment revealed that the treatment T6 (60 cm × 20 cm) recorded significantly higher values of growth parameters viz., plant height at 30, 60, 90 DAS and at harvest (cm), dry biomass at emergence, tasseling, silking and maturity (g/plant), plant water content at emergence, tasseling, silking and maturity (%), chlorophyll content at 30, 60 DAS and at harvest (mg/g). While, significantly higher leaf area index was recorded with the treatment T1 (30 cm × 10 cm). The treatment T4 (45 cm × 20 cm) recorded significantly higher values of yield attributes and yield viz., number of cobs per plant, cob length (cm), cob girth (cm), number of seeds row per cob, number of seeds per row and fresh cob yield (kg/ha). While, significantly higher green fodder yield (kg/ha) and dry fodder yield (kg/ha) was recorded with the treatment T1 (30 cm × 10 cm).
Summary
Source-checkedPlain-language reading of the full paper, prepared with AI and checked against the text. Each point links to the authors' own words.
Why it matters
- Maize, commonly known as corn, is the third most important cereal crop globally after rice and wheat, possessing significant production potential. View evidence ↗
- Sweet corn is a specialized variety of maize treated as a vegetable, valued for its high nutritional content, delicate texture, and sweet taste. View evidence ↗
- Management practices like row spacing and sowing dates are critical because they modify the micro-climate, affecting factors such as soil moisture and light interception. View evidence ↗
The question
- The study aimed to evaluate how different planting geometries affect the growth, yield, and yield attributes of sweet corn. View evidence ↗
What they did
- The research was conducted during the 2023-24 Rabi season at the Instructional Farm of Junagadh Agricultural University in Gujarat, India. View evidence ↗
- Using a randomized block design with five replications, the study tested six planting geometries ranging from 30 cm × 10 cm (T1) to 60 cm × 20 cm (T6). View evidence ↗
- The researchers measured growth parameters including plant height, leaf area index, dry biomass, plant water content, and chlorophyll content at various growth stages. View evidence ↗
What they found
- The widest spacing (T6: 60 cm × 20 cm) resulted in the tallest plants, reaching 187.1 cm at harvest. View evidence ↗
- The narrowest spacing (T1: 30 cm × 10 cm) produced the highest leaf area index, peaking at 3.75 at 90 DAS. View evidence ↗
- The T6 treatment (60 cm × 20 cm) achieved the highest dry biomass per plant, reaching 151.3 g/plant at maturity. View evidence ↗
- Chlorophyll content was significantly highest in the T6 (60 cm × 20 cm) group, recording 0.904 mg/g at harvest. View evidence ↗
- The T6 (60 cm × 20 cm) spacing led to the highest plant water content across all stages, ending at 57.06% at maturity. View evidence ↗
- The T4 treatment (45 cm × 20 cm) produced the highest number of cobs per plant at 1.53. View evidence ↗
- The highest cob girth was observed in the T4 (45 cm × 20 cm) treatment, measuring 15.61 cm. View evidence ↗
- The T4 (45 cm × 20 cm) planting geometry resulted in the highest fresh cob yield of 8129 kg/ha. View evidence ↗
- The narrowest spacing (T1: 30 cm × 10 cm) produced the highest green fodder yield at 30,089 kg/ha. View evidence ↗
- The T1 (30 cm × 10 cm) treatment also recorded the highest dry fodder yield of 14,811 kg/ha. View evidence ↗
What it means
- The authors conclude that a planting spacing of 45 cm × 20 cm is optimal for maximizing the yield and yield attributes of sweet corn. View evidence ↗
Visual summary
3 visualsIllustrations explain the paper; charts are replotted from the paper's own table values.
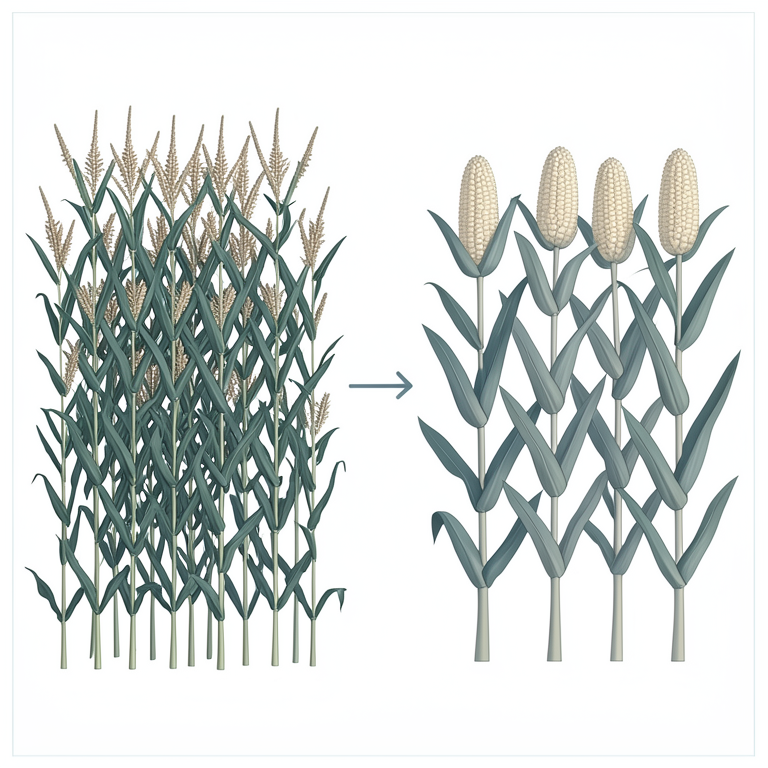
Trade-off between Cob Yield and Fodder Yield
AI-generated conceptual illustration (sweet corn plants). It explains the idea and does not show study data.
View source evidence ↗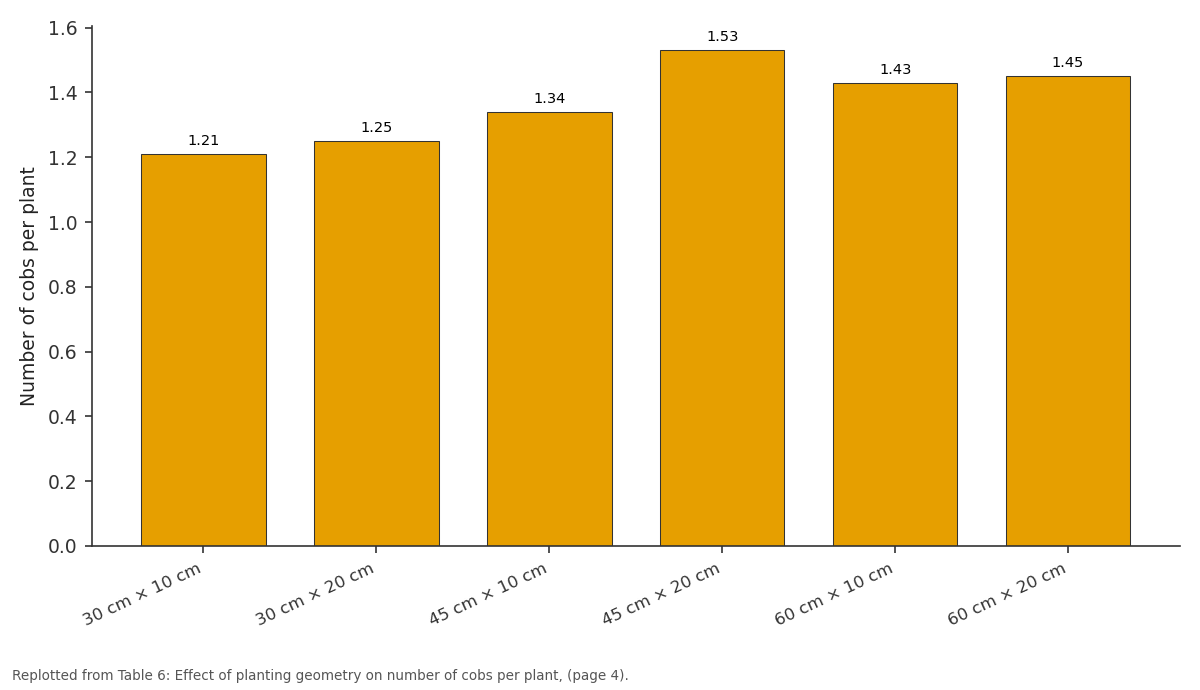
Number of cobs per plant: 30 cm × 10 cm vs 30 cm × 20 cm vs 45 cm × 10 cm vs 45 cm × 20 cm vs 60 cm × 10 cm
Replotted from Table 6 (page 4) of the original paper. Every bar is the paper's own table value.
View source evidence ↗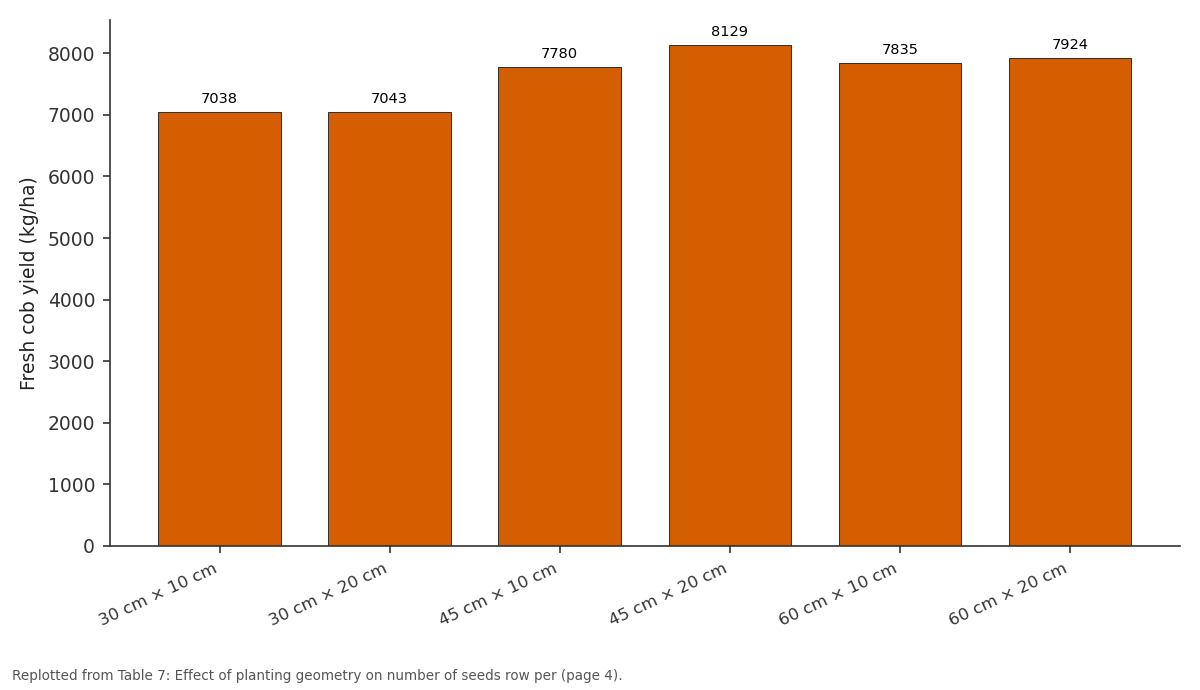
Fresh cob yield (kg/ha): 30 cm × 10 cm vs 30 cm × 20 cm vs 45 cm × 10 cm vs 45 cm × 20 cm vs 60 cm × 10 cm
Replotted from Table 7 (page 4) of the original paper. Every bar is the paper's own table value.
View source evidence ↗Figures & tables
From the original paper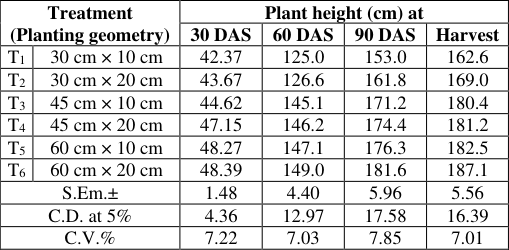 Table 1
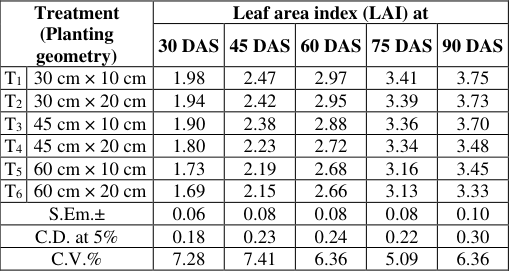 Table 2
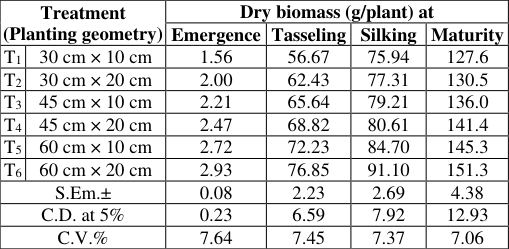 Table 3
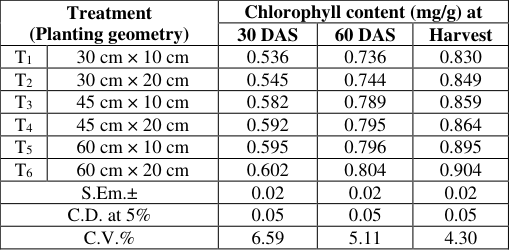 Table 5
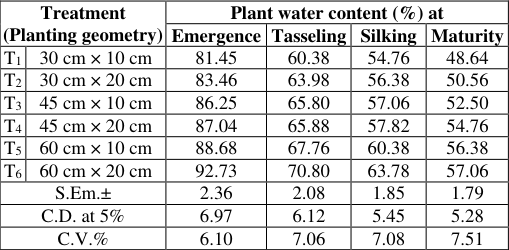 Table 4
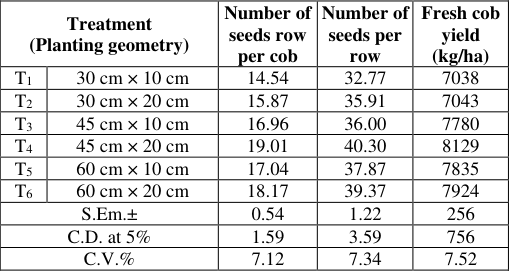 Table 7
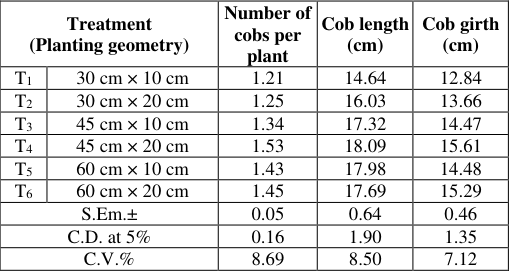 Table 6
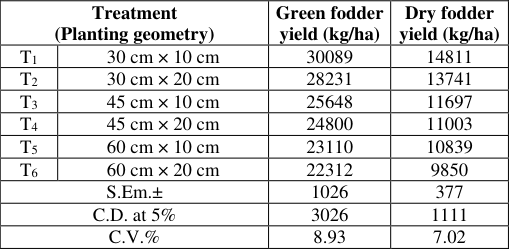 Table 8
Introduction
Maize (Zea mays L.), which is also popularly known as "Corn" has an immense production potential. It is the 3 rd most important cereal crop after wheat and rice and is also called "Queen of Cereals". Currently, nearly 1147.7 million tonnes of maize is being produced together by over 170 countries from an area of 193.7 million ha with an average productivity of 5.75 t/ha (Anon., 2020). Maize is classified into seven groups based on the characters of grain. viz., dent corn, flint corn, sweet corn, flour or soft corn, popcorn, baby corn and waxy corn. Among which, sweet corn (Zea mays L. var. saccharata) is considered as a vegetable, is a special type of corn with particular characteristics, such as sweet taste, thin pericarp and endosperm with delicate texture and a high nutritional value. It is destined exclusively for human consumption, in fresh form or in processed foods, whereas the fodder can be used for silage after harvest. The higher content of water soluble polysaccharide in the kernel adds texture and quality in addition to sweetness (Khan et al., 2011) [7] . Sweet corn is gaining importance popularity both in rural and urban areas of India because of its higher sugar (11-20 %) and low starch content and delicious nature. Crop management practices such as date of sowing and row spacing greatly affect the micro-climate due to their effect on canopy temperature, soil moisture, relative humidity, light interception and rate of water loss etc. (Kaur et al., 2019) [6] . The variation in planting dates and plant geometry, row spacing and plant density modifies the microclimate to which the plants are exposed and it is responsible for biomass production and ultimately the yield. Optimum time of sowing is one of the important factors which provide score for better utilization of natural resources by the crop during its growth to take full advantage of favourable weather conditions during growing season. Like date of sowing, spacing also determines to a large extend the yield of crops. It has an important role in giving optimum space to individual plant, which is the main requirement to obtain maximum yield for any crop. Growth and yield of crop tend to get affected by very high plant population, as it may lead to inter and intra-plant competition for International Journal of Agriculture and Food Science https://www.agriculturaljournals.com moisture, light, nutrients and space. In case of low plant population, it may not take full advantage of above given factors. So, optimum spacing provides easy access for easy inter-culturing, weeding, application of fertilizer and other aftercare operations. Plant population affects primarily the amount of solar radiation intercepted per plant and the light quality modified by different plant populations may play an important role on early plant growth and portioning responses (Villalobos et al., 1994) [16] .
Materials and Methods
The experiment was conducted in C-
Results and Discussion
Results and Discussion
The data presented in Table 1 revealed that significantly higher plant height at 30 DAS (48.39 cm), at 60 DAS (149 cm), at 90 DAS (181.6 cm) and at harvest (187.1 cm) was found under the treatment T 6 (60 cm × 20 cm). Numerically more plant height under wider planting geometries may be attributed to less competition for water, nutrient, space, solar radiation etc, compared to narrow spacing.
| Treatment (Planting geometry) | — | Plant height (cm) at | — | — | — |
|---|---|---|---|---|---|
| 30 DAS | 60 DAS | 90 DAS | Harvest | ||
| T1 | 30 cm × 10 cm | 42.37 | 125.0 | 153.0 | 162.6 |
| T2 | 30 cm × 20 cm | 43.67 | 126.6 | 161.8 | 169.0 |
| T3 | 45 cm × 10 cm | 44.62 | 145.1 | 171.2 | 180.4 |
| T4 | 45 cm × 20 cm | 47.15 | 146.2 | 174.4 | 181.2 |
| T5 | 60 cm × 10 cm | 48.27 | 147.1 | 176.3 | 182.5 |
| T6 | 60 cm × 20 cm | 48.39 | 149.0 | 181.6 | 187.1 |
| S.Em.± | 1.48 | 4.40 | 5.96 | 5.56 | |
| C.D. at 5% | 4.36 | 12.97 | 17.58 | 16.39 | |
| C.V.% | 7.22 | 7.03 | 7.85 | 7.01 |
Table text extracted from the original PDF; superscript letters are shown inline. The original table image is below.
View original table image
In such conditions, individual plants have sufficient space to expand their root and shoot systems, enabling efficient resource capture and better physiological functioning. This favourable environment allows plants to attain their full growth potential, resulting in taller plants. Conversely [8,9] .
Leaf area index
The data presented in [5,15] .
According to Table 4 plant water content at emergence, tasseling, silking and maturity was significantly influenced by planting geometry. Significantly highest plant water content at emergence (92.73 %), at tasseling (70.80 %), at silking (63.78 %) and at maturity (57.06 %) was observed under the treatment T 6 (60 cm × 20 cm). Different spacing arrangements influence canopy structure, light interception, soil evaporation and ultimately plant water uptake and retention. Wider spacing often allows better root development and reduces competition for water, potentially increasing leaf relative water content (RWC). It also helps in maintaining soil moisture for a longer duration by minimizing inter plant competition. In contrast, narrow spacing tends to create a denser canopy, which may reduce evaporation from the soil surface but often leads to rapid depletion of available soil moisture due to higher plant density and intense competition for water and nutrients, thereby affecting physiological functions and crop yield. The results are in close agreement with the findings of Ahiablame and Ezenwaji (2016) [1] .
| Treatment (Planting geometry) | — | Plant water content (%) at | — | — | — |
|---|---|---|---|---|---|
| Emergence | Tasseling | Silking | Maturity | ||
| T1 | 30 cm × 10 cm | 81.45 | 60.38 | 54.76 | 48.64 |
| T2 | 30 cm × 20 cm | 83.46 | 63.98 | 56.38 | 50.56 |
| T3 | 45 cm × 10 cm | 86.25 | 65.80 | 57.06 | 52.50 |
| T4 | 45 cm × 20 cm | 87.04 | 65.88 | 57.82 | 54.76 |
| T5 | 60 cm × 10 cm | 88.68 | 67.76 | 60.38 | 56.38 |
| T6 | 60 cm × 20 cm | 92.73 | 70.80 | 63.78 | 57.06 |
| S.Em.± | 2.36 | 2.08 | 1.85 | 1.79 | |
| C.D. at 5% | 6.97 | 6.12 | 5.45 | 5.28 | |
| C.V.% | 6.10 | 7.06 | 7.08 | 7.51 |
Table text extracted from the original PDF; superscript letters are shown inline. The original table image is below.
View original table image
The results showed in Table 5 revealed that different planting geometry significantly influenced the chlorophyll content. Significantly highest chlorophyll content at 30 DAS (0.602 mg/g), at 60 DAS (0.804 mg/g) and at harvest (0.904 mg/g) was recorded with T 6 (60 cm × 20 cm). Plant spacing significantly influences the microclimate around the crop canopy, which in turn affects photosynthetic activity and chlorophyll synthesis in maize. Wider spacing improves light penetration and air circulation, leading to better leaf development and often higher chlorophyll content due to reduced shading and competition for light and nutrients. In contrast, narrow spacing can cause mutual shading and stress, resulting in lower chlorophyll accumulation. These results are in close proximity with findings reported by Mali and Singh (1989) [10] .
| Treatment (Planting geometry) | — | Chlorophyll content (mg/g) at | — | — |
|---|---|---|---|---|
| 30 DAS | 60 DAS | Harvest | ||
| T1 | 30 cm × 10 cm | 0.536 | 0.736 | 0.830 |
| T2 | 30 cm × 20 cm | 0.545 | 0.744 | 0.849 |
| T3 | 45 cm × 10 cm | 0.582 | 0.789 | 0.859 |
| T4 | 45 cm × 20 cm | 0.592 | 0.795 | 0.864 |
| T5 | 60 cm × 10 cm | 0.595 | 0.796 | 0.895 |
| T6 | 60 cm × 20 cm | 0.602 | 0.804 | 0.904 |
| S.Em.± | 0.02 | 0.02 | 0.02 | |
| C.D. at 5% | 0.05 | 0.05 | 0.05 | |
| C.V.% | 6.59 | 5.11 | 4.30 |
Table text extracted from the original PDF; superscript letters are shown inline. The original table image is below.
View original table image
Yield and yield attributes Number of cobs per plant
The data presented in Table 6 showed the numbers of cobs per plant were influenced significantly due to different treatments. The maximum number of cobs per plant (1.53) were recorded with T 4 (45 cm × 20 cm). Treatment T 4 (45 cm × 20 cm) gave higher result in case number of cobs per plant. This treatment was closely followed by T 6 (60 cm × 20 cm). Wider plant spacing produced higher value of yield parameter as compared to narrow spacing. This can be attributed to the fact that reduced competition for essential growth resources such as nutrients, water and sunlight under wider spacing conditions promotes more vigorous vegetative and reproductive growth. The improved availability of light penetration within the canopy enhances photosynthetic efficiency, while better root proliferation increases the plant's capacity for nutrient and moisture uptake. These favorable conditions contribute to superior yield attributing characters under wider spacing. These results are in close proximity with findings reported by Mathukia et al. (2014) [12] .
| Treatment (Planting geometry) | — | Number of cobs per plant | Cob length (cm) | Cob girth (cm) |
|---|---|---|---|---|
| T1 | 30 cm × 10 cm | 1.21 | 14.64 | 12.84 |
| T2 | 30 cm × 20 cm | 1.25 | 16.03 | 13.66 |
| T3 | 45 cm × 10 cm | 1.34 | 17.32 | 14.47 |
| T4 | 45 cm × 20 cm | 1.53 | 18.09 | 15.61 |
| T5 | 60 cm × 10 cm | 1.43 | 17.98 | 14.48 |
| T6 | 60 cm × 20 cm | 1.45 | 17.69 | 15.29 |
| S.Em.± | 0.05 | 0.64 | 0.46 | |
| C.D. at 5% | 0.16 | 1.90 | 1.35 | |
| C.V.% | 8.69 | 8.50 | 7.12 |
Table text extracted from the original PDF; superscript letters are shown inline. The original table image is below.
View original table image
Among the different treatments significantly highest length of cob (18.09 cm) was recorded with T 4 (45 cm × 20 cm). Plants grown at wider spacing might have been able to efficiently utilize the available natural resources. Furthermore, these plants showed a heightened responsiveness to external inputs, which was expressed generously in their growth and development and in turn, cob length was increased. On the other hand, plants grown at narrow spacing experienced intense competition for resources due to the close proximity of neighboring plants. This stiff competition seemed to limit their ability to fully exploit the natural resources and as a result their response to externally applied inputs was comparatively restricted. These results are in close proximity with findings reported by Mathukia et al. (2014) and Narayanaswamy and Siddaraju (2011) [12,13] .
According to Table 6, the cob girth was significantly influenced by treatment. Significantly highest cob girth (15.61 cm) was recorded with T 4 (45 cm × 20 cm). Treatment T 4 (45 cm × 20 cm) gave higher result in case number of cob girth. This treatment was closely followed by T6 (60 cm × 20 cm). Plants grown at wider spacing might have been able to efficiently utilize the available natural resources. On the other hand, plants grown at narrow spacing experienced intense competition for resources due to the close proximity of neighboring plants. The lesser competition for nutrients and sunlight by plants under wider spacing could have improved yield attributing characters. These results are in close proximity with findings reported by Mathukia et al. (2014) [12] .
Number of seeds row per cob
Different treatments did appreciable influence on number of seeds row per cob. Among the different treatments significantly more number of seeds rows per cob (19.01) was recorded with T 4 (45 cm × 20 cm). Wider spacing allowed plants to utilize resources more efficiently and respond better to external inputs, which in turn enhanced their growth and improved yield attributing characters. Number of seeds row per cob is strongly related to cob girth. Therefore, higher cob girth under wider plant spacing may be responded to higher number of seeds row per cob in these treatments. Similar findings were also reported by Kurne et al. (2017) [8] .
Number of seeds per row
The data presented in Table 7 showed that significantly the maximum number of seeds per row 40.30 was recorded under the treatment T 4 (45 cm × 20 cm). Plants grown at wider spacing might have been able to efficiently utilize the available natural resources. Furthermore, these plants showed a heightened responsiveness to external inputs, which was expressed generously in their growth and development and in turn, cob length was increased. Number of seeds per row is strongly related to cob length. Therefore, higher cob length under wider plant spacing may be responded to higher number of seeds row per cob in these treatments. Similar findings were also reported by Kurne et al. (2017) [8] . Fresh cob yield (kg/ha) An evaluation of data presented in Table 7 indicated that variations in fresh cob yield of Rabi sweet corn to different treatments were found significant. Among the different treatments, T 4 (45 cm × 20 cm) exhibited significantly higher fresh cob yield (8129 kg/ha). Treatment T 4 (45 cm × 20 cm) gave higher result in case of fresh cob yield. This treatment was closely followed by T 6 (60 cm × 20 cm). Wider plant spacing resulted in higher yield compared to narrow spacing. This can be attributed to reduced competition for essential resources such as nutrients, water and sunlight, which promotes better vegetative and reproductive growth. Improved light penetration within the canopy enhances photosynthetic efficiency, while greater root proliferation increases the uptake of nutrients and moisture. These favorable conditions collectively contribute to higher yield under wider spacing. Similar findings were also reported by and Mathukia et al. (2014) [12] .
| Treatment (Planting geometry) | — | Number of seeds row per cob | Number of seeds per row | Fresh cob yield (kg/ha) |
|---|---|---|---|---|
| T1 | 30 cm × 10 cm | 14.54 | 32.77 | 7038 |
| T2 | 30 cm × 20 cm | 15.87 | 35.91 | 7043 |
| T3 | 45 cm × 10 cm | 16.96 | 36.00 | 7780 |
| T4 | 45 cm × 20 cm | 19.01 | 40.30 | 8129 |
| T5 | 60 cm × 10 cm | 17.04 | 37.87 | 7835 |
| T6 | 60 cm × 20 cm | 18.17 | 39.37 | 7924 |
| S.Em.± | 0.54 | 1.22 | 256 | |
| C.D. at 5% | 1.59 | 3.59 | 756 | |
| C.V.% | 7.12 | 7.34 | 7.52 |
Table text extracted from the original PDF; superscript letters are shown inline. The original table image is below.
View original table image
Different treatments did appreciable influence on green fodder yield. Among the different treatments significantly higher green fodder yield (30089 kg/ha) was recorded with T 1 (30 cm × 10 cm). Green fodder yield is decided by number of plants/ha and dry matter accumulation per plant.
Narrow planting geometry has more number of plants/ha which resulted into higher green fodder yield. Under wider geometries, crop exhibited more dry matter accumulation per plant but less number of plants/ha led to low green fodder yield per hectare. These results corroborate the findings of Bhatt (2012) [5] who also found higher biomass yield of sweet corn in narrow planting geometry. Dry fodder yield (kg/ha) Significantly highest dry fodder yield (14811 kg/ha) was recorded with T 1 (30 cm × 10 cm). Narrow planting geometry accommodated a higher number of plants per hectare, which consequently resulted in a greater dry fodder yield per unit area. In contrast, wider geometries supported fewer plants per hectare, leading to comparatively lower dry fodder yield. The increased plant population under narrow spacing ensured more biomass accumulation per unit area despite higher competition for growth resources. Similar findings were also reported by Bhatt (2012) [5] .
Conclusion
Based on the results of one year experimentation, it can be concluded that sweet corn sown at plant spacing 45 cm × 20 cm recorded highest yield and yield attributes as compared to other plant spacings. This was closely followed by plant spacing 60 cm × 20 cm. Prevalence of distinct microclimatic condition might have led to higher fresh cob yield in wider plant spacing as compare to narrow plant spacing.
Acknowledgement
It is by the grace and will of the Almighty that I have this wonderful opportunity to express my gratitude to those who have aided and assisted me at various phases of my M.Sc. study and in the compilation of my research work. I would like to offer my profound and genuine gratitude to all the staff members of Department of Agronomy, College of Agriculture, J.A.U., Junagadh and all other divine souls who helped me for their unwavering cooperation and encouragement.
Figures and tables from the paper
| Treatment (Planting geometry) | — | Leaf area index (LAI) at | — | — | — | — |
|---|---|---|---|---|---|---|
| 30 DAS | 45 DAS | 60 DAS | 75 DAS | 90 DAS | ||
| T1 | 30 cm × 10 cm | 1.98 | 2.47 | 2.97 | 3.41 | 3.75 |
| T2 | 30 cm × 20 cm | 1.94 | 2.42 | 2.95 | 3.39 | 3.73 |
| T3 | 45 cm × 10 cm | 1.90 | 2.38 | 2.88 | 3.36 | 3.70 |
| T4 | 45 cm × 20 cm | 1.80 | 2.23 | 2.72 | 3.34 | 3.48 |
| T5 | 60 cm × 10 cm | 1.73 | 2.19 | 2.68 | 3.16 | 3.45 |
| T6 | 60 cm × 20 cm | 1.69 | 2.15 | 2.66 | 3.13 | 3.33 |
| S.Em.± | 0.06 | 0.08 | 0.08 | 0.08 | 0.10 | |
| C.D. at 5% | 0.18 | 0.23 | 0.24 | 0.22 | 0.30 | |
| C.V.% | 7.28 | 7.41 | 6.36 | 5.09 | 6.36 |
Table text extracted from the original PDF; superscript letters are shown inline. The original table image is below.
View original table image
| Treatment (Planting geometry) | — | Dry biomass (g/plant) at | — | — | — |
|---|---|---|---|---|---|
| Emergence | Tasseling | Silking | Maturity | ||
| T1 | 30 cm × 10 cm | 1.56 | 56.67 | 75.94 | 127.6 |
| T2 | 30 cm × 20 cm | 2.00 | 62.43 | 77.31 | 130.5 |
| T3 | 45 cm × 10 cm | 2.21 | 65.64 | 79.21 | 136.0 |
| T4 | 45 cm × 20 cm | 2.47 | 68.82 | 80.61 | 141.4 |
| T5 | 60 cm × 10 cm | 2.72 | 72.23 | 84.70 | 145.3 |
| T6 | 60 cm × 20 cm | 2.93 | 76.85 | 91.10 | 151.3 |
| S.Em.± | 0.08 | 2.23 | 2.69 | 4.38 | |
| C.D. at 5% | 0.23 | 6.59 | 7.92 | 12.93 | |
| C.V.% | 7.64 | 7.45 | 7.37 | 7.06 |
Table text extracted from the original PDF; superscript letters are shown inline. The original table image is below.
View original table image
| Treatment (Planting geometry) | — | Green fodder yield (kg/ha) | Dry fodder yield (kg/ha) |
|---|---|---|---|
| T1 | 30 cm × 10 cm | 30089 | 14811 |
| T2 | 30 cm × 20 cm | 28231 | 13741 |
| T3 | 45 cm × 10 cm | 25648 | 11697 |
| T4 | 45 cm × 20 cm | 24800 | 11003 |
| T5 | 60 cm × 10 cm | 23110 | 10839 |
| T6 | 60 cm × 20 cm | 22312 | 9850 |
| S.Em.± | 1026 | 377 | |
| C.D. at 5% | 3026 | 1111 | |
| C.V.% | 8.93 | 7.02 |
Table text extracted from the original PDF; superscript letters are shown inline. The original table image is below.
View original table image
References
16 in the original paper- Ahiablame L, Ezenwajis B. Effect of different furrow and plant spacing on yield and water use efficiency of maize. Agric Water Manag. 2016;177:215-23.
- Anonymous. FAOSTAT 2020. FAO Statistics, Food and Agriculture Organization of the United Nations [Internet]. 2020 [cited 2025 Apr 20]. Available from: http://faostat.fao.org/
- Aravinth V, Kuppuswamy G, Ganapathy M. Growth and yield of baby corn (Zea mays L.) as influenced by intercropping, planting geometry and nutrient management. Indian J Agric Sci. 2011;81(9):875-7.
- Arvadiya LK, Raj VC, Patel TU, Arvadia MK, Patel AM. Influence of plant population and weed management on weed flora and productivity of sweet corn. Indian J Agron. 2012;57(2):162-7.
- Bhatt PS. Response of sweet corn hybrid to varying plant densities and nitrogen levels. Afr J Agric Res. 2012;7(46):6158-66.
- Kaur H, Kingra PK, Singh SP. Role of microclimatic modification in managing climate change impact on maize in Central Punjab. J Agrometeorol. 2019;21(1):90-7.
- Khan HZ, Shad KK, Farhatullah M, Yasir KM, Abdul B. Selecting optimum planting date for sweet corn in Peshawar, Pakistan. Sarhad J Agric. 2011;27(1):3-5.
- Kurne AK, Jadav YR, Mohite AB. Effect of fertilizer levels and plant densities on growth, productivity and economics of sweet corn in summer season. Contemp Res India. 2017;7(3):24-7.
- Lyocks SWJ, Tanimu J, Dauji LZ, Ogunleye DA. Evaluation of the effects of different intra-row spacing on the growth and yield of maize (Zea mays L.). Agric Biol J N Am. 2013;4(3):3-4.
- Mali AL, Singh HG. Effect of supplemental light and regulation of leaf nutritional environment on productivity of maize at various intra-row spacing. Madras Agric J. 1989;76(1):5-9.
- Massey JX, Gaur BL. Effect of plant population and fertility levels on yield attributes, yield and nutrient uptake of sweet corn (Zea mays L.) cultivars. Adv Res J Crop Improv. 2013;4(1):34-7.
- Mathukia RK, Choudhary RP, Shivran A, Bhosale N. Response of Rabi sweet corn to plant geometry and fertilizer. Curr Biotica. 2014;7(4):294-8.
- Narayanaswamy S, Siddaraju R. Influence of spacing and mother plant nutrition on seed yield and quality of sweet corn (Zea mays L.). Mysore J Agric Sci. 2011;45(2):296-9.
- Suryavanshi VP, Pagar PA, Dugmod SB, Suryavanshi SB. Studies on leaf area pattern and dry matter accumulation in maize as influenced by spacing, nitrogen and phosphorus levels. Int J Trop Agric. 2009;27(1-2):223-6.
- Verma A, Tomar GS. Effect of planting geometry and nitrogen levels on growth, green cob yield and economics of sweet corn. Int J Agric Sci. 2014;10(2):766-9.
- Villalobos FJ, Sadras VO, Soriana A, Fereres E. Planting density effects on dry matter partitioning and productivity of sunflower hybrids. Field Crops Res. 1994;36:1-11.