
Research article · 2025 · Full text
International Journal of Agriculture and Food ScienceGenetic Variability, Correlation Studies and Path Analysis in Chilli (Capsicum annuum L.) Genotypes
Volume 7(9) · Pages 866–870 · DOI: 10.33545/2664844x.2025.v7.i9l.835 ↗
Research areasStructural Health Monitoring TechniquesGeodetic Measurements and Engineering StructuresGNSS positioning and interference
Abstract
Author-writtenThe present experiment title “Genetic Variability, Correlation Studies and Path Analysis in Conducted during the kharif season of 2024-2025. Pandhurna It is located in the "Satpura Range of Mountains" southwest. The experiment was laid out in randomized block design. The experimental setup included fourteen genotypes of Chilli, which were arranged in a Randomized Block Design with three replications. Analysis of variance indicated that significant differences exist among the genotypes with respect to both quantitative and qualitative characters. Correlation studies revealed that, Days to first flowering, days to 50% flowering, days to physiological maturity, days to harvest maturity, days to fruit initiation, plant height (cm), No.of primary branches per plant, No.of secondary branches per plant, fruit length, fruit diameter, No.of fruit per plant, no.of seeds per fruit, seed yield per plant (gm), seed yield per plot (kg) had positive significant association, with yield per plant indicating the importance of these traits in selection for yield because of their direct contribution to yield. Maximum positive direct effect was observed for Days to first flowering, days to 50% flowering, days to physiological maturity, days to harvest maturity, days to fruit initiation, plant height (cm), No.of primary branches per plant, No.of secondary branches per plant, fruit length, fruit diameter, No.of fruit per plant, No.of seeds per fruit, seed yield per plant (gm), seed yield per plot (kg).
Summary
Source-checkedPlain-language reading of the full paper, prepared with AI and checked against the text. Each point links to the authors' own words.
Why it matters
- Chilli (Capsicum annuum L.) is a cross-pollinated crop and one of the most widely produced spices in India. View evidence ↗
- Chilies are nutritionally rich, serving as an excellent source of vitamin C and other essential vitamins and minerals. View evidence ↗
- Genetic variation is the most critical factor for breeding decisions because it is heritable. View evidence ↗
The question
- The study aims to understand the correlations and contributions of various character features to aid successful breeding initiatives. View evidence ↗
What they did
- The experiment used fourteen chilli genotypes arranged in a Randomized Block Design with three replications. View evidence ↗
- The research was conducted during the kharif season of 2024-2025 at the Saikheda School of Agricultural Science's Genetics and Plant Breeding Department in Pandhurna. View evidence ↗
What they found
- Analysis of variance showed significant differences among all genotypes for all studied characters (P=0.01), confirming significant genetic variability. View evidence ↗
- High genetic advance percentages for certain characters indicate they are governed by additive gene action, meaning selection for these traits would be rewarding. View evidence ↗
- Days to first flowering and days to 50% flowering showed a significant negative correlation with fruit yield. View evidence ↗
What it means
- The authors conclude that utilizing the identified genetic diversity allows breeders to create improved cultivars, increasing production and long-term agricultural viability. View evidence ↗
Visual summary
3 visualsIllustrations explain the paper; charts are replotted from the paper's own table values.
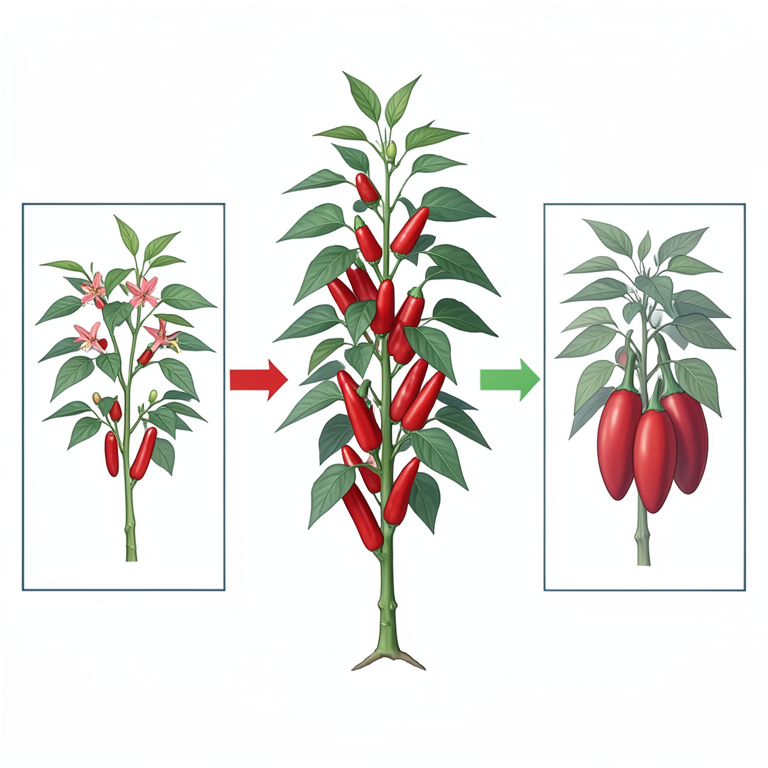
Yield Correlation Map
AI-generated conceptual illustration (Chilli plants (Capsicum annuum L.)). It explains the idea and does not show study data.
View source evidence ↗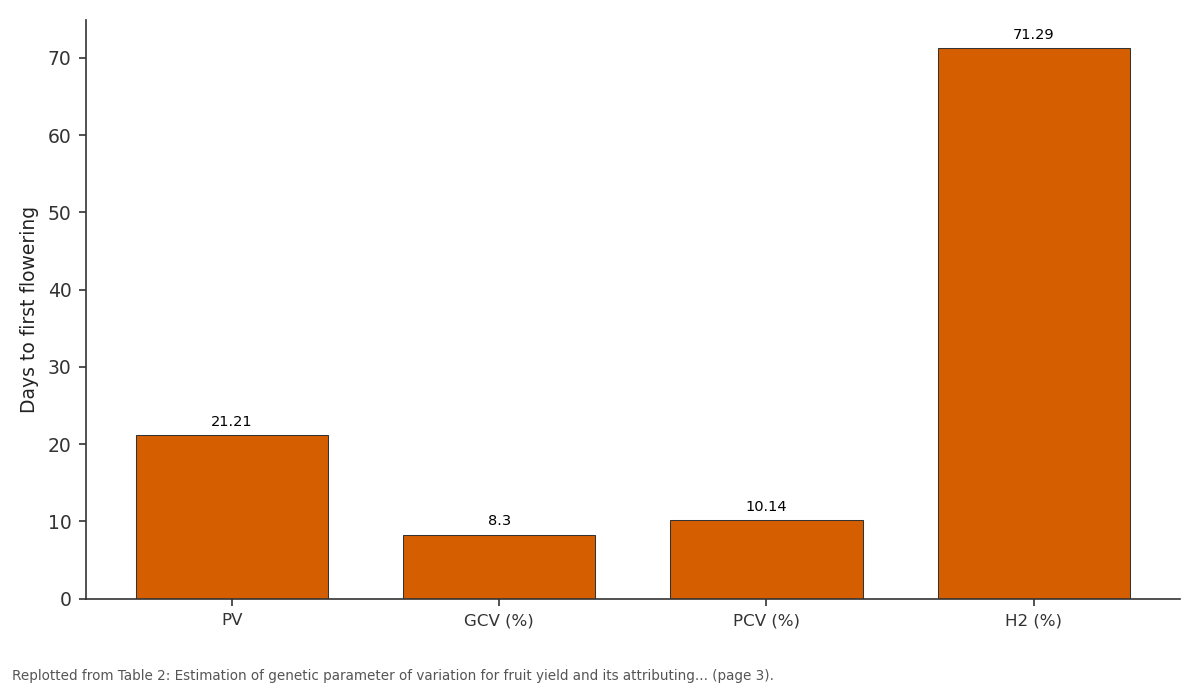
Days to first flowering: PV vs GCV (%) vs PCV (%) vs H2 (%)
Replotted from Table 2 (page 3) of the original paper. Every bar is the paper's own table value.
View source evidence ↗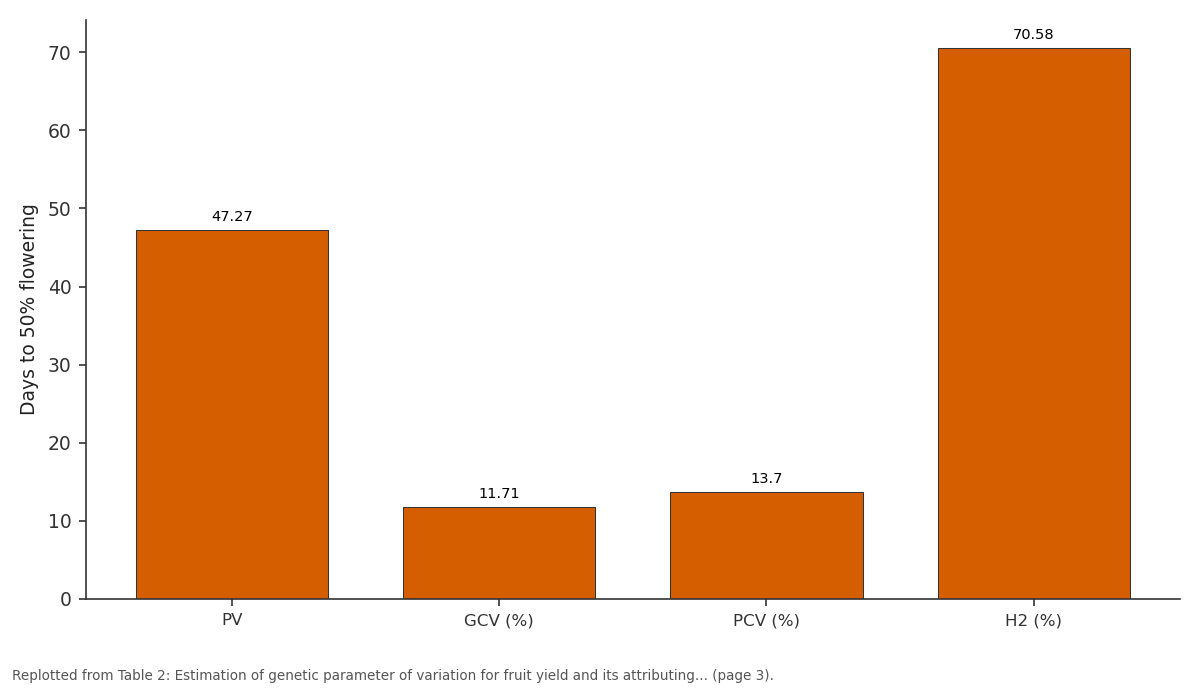
Days to 50% flowering: PV vs GCV (%) vs PCV (%) vs H2 (%)
Replotted from Table 2 (page 3) of the original paper. Every bar is the paper's own table value.
View source evidence ↗Figures & tables
From the original paper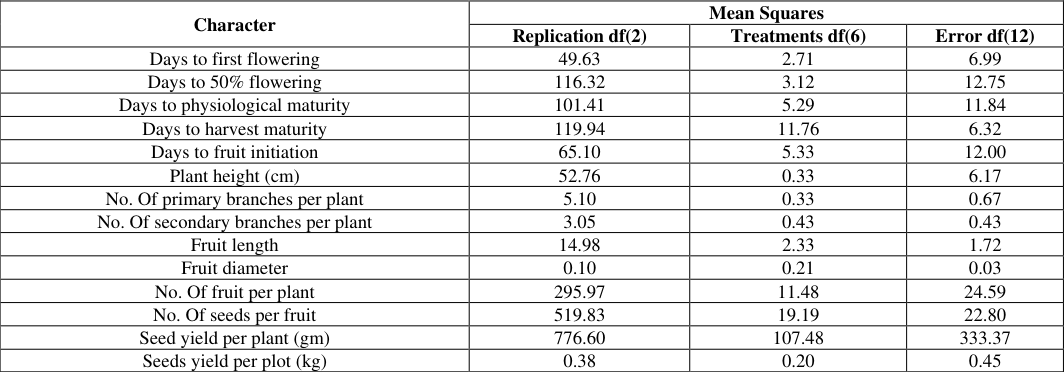 Table 1
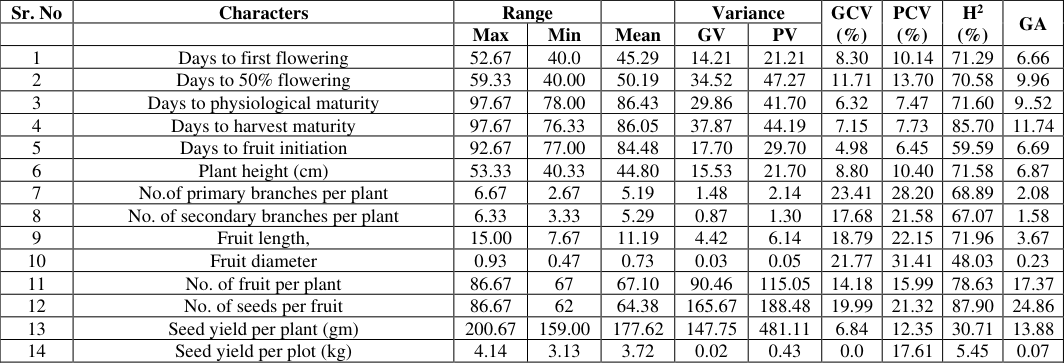 Table 2
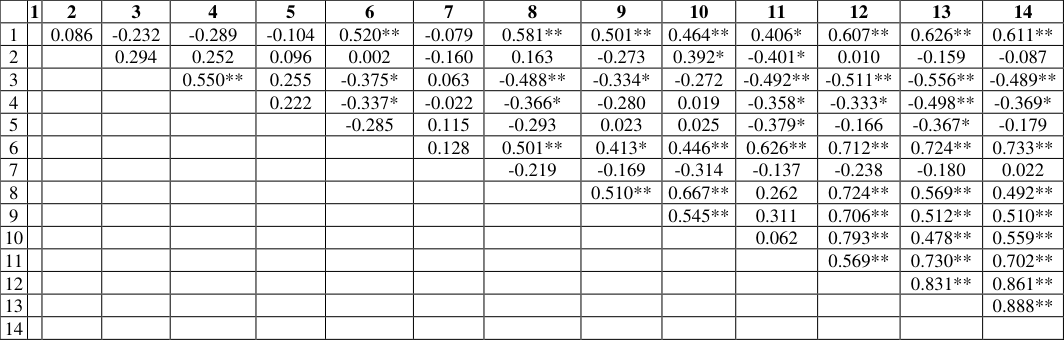 Table 3
 Table 4
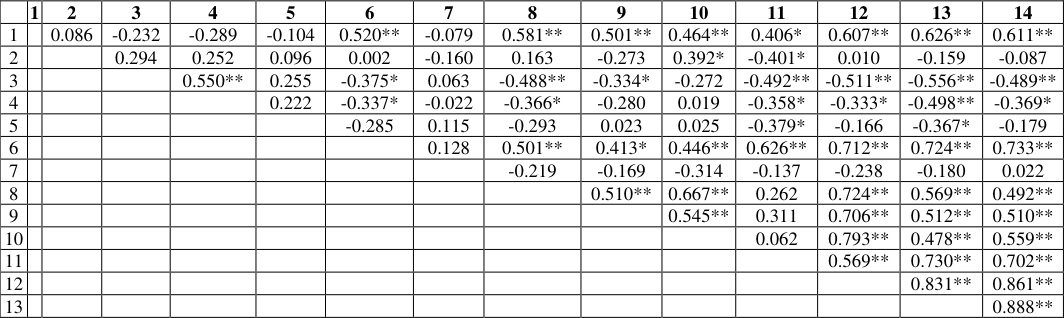 Table 4
 Table 5
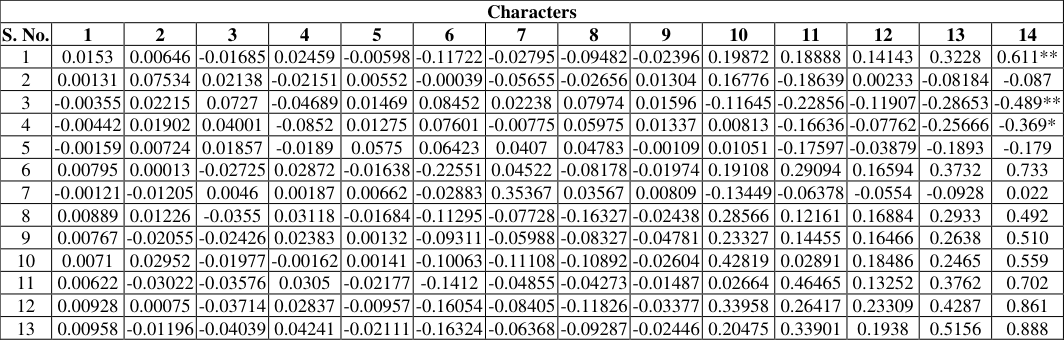 Table 5
Introduction
The fruit and vegetable chilli (Capsicum annuum L.) is widely grown around the world. It is a member of the Solanaceae family and has 2n = 24 chromosomes. Chilli is a crosspollinated crop that produces berries that resemble pods and is one of the most widely produced spices in India. It is frequently referred to as hot pepper and was brought to India from Brazil by the Portuguese in the 16th century. Chilies are an excellent source of vitamin C and contain other essential vitamins such as A, K, E, and minerals (Singh, 2007) [13] . They are nutritionally rich, with high amounts of ascorbic acid (111.07 mg), moisture (85.7 g), protein (2.9 g), fat (0.6 g), minerals (1.0 g), calcium (30.0 mg), carbohydrate (3.0 g), fiber (6.8 g), sodium (6.5 mg), magnesium (24.0 mg), chlorine (15.0 mg), sulfur (34.0 mg), copper (1.6 mg), iron (1.2 mg), phosphorus (80 mg), Riboflavin (0.39 mg), and vitamin A (292 IU). On an area of 0.377 million hectares, India produced roughly 3.783 million metric tonnes of chilies in 2019-20 (NHB Database 2019-20). Chilies are grown on 10,706 hectares in Chhattisgarh, producing 65,673 metric tonnes in 2021-22 (Agri site cg.nic.in). Breeders can find viable genotypes by thoroughly knowing the variety that is present in the breeding material for desirable qualities in a crop species. Phenotypic variation is caused by phenotypic, genotypic, and genotype-environment interactions. However, the most important factor for making wise breeding decisions is genetic variation because it is heritable. The enormous genetic diversity that chilli breeders have access to has aided in the creation of new kinds and hybrids. A secondary centre of origin for chilies is India, and the majority of features have a wide genetic range. Understanding the correlations and contributions of various character features is essential for successful breeding initiatives. Breeders can create improved cultivars with desirable qualities by utilising the genetic diversity found in chillies, which will increase production and the long-term viability of chilli agriculture. Meeting the various consumer needs and preserving the financial security of chilli producers will depend on the ongoing exploration and use of the genetic resources found in chillies.
Materials and Methods
The present investigation entitled " Genetic Variability & Association Studies in Chilli (Capsicum annuum L.) Solanaceae)" was conducted during kharif-2024-25 at Experiment will be was out at the Saikheda School of Agricultural Science's Genetics and Plant Breeding Department. GHRUS During the kharif season of 2024-2025. Pandhurna. It is located in the "Satpura Range of Mountains" southwest. Its latitude ranges from 21.28 to 22.49 degrees North and its longitude from 78.40 to 79.24 degrees. The district's average elevation in Madhya Pradesh is 2215 feet (675 meters), although its altitudes range from 1,440 ft (438 meters) to 3,825 feet (1,165 meters) above sea level. This area has a subtropical climate with a tropical wet and dry climate that borders it. The summers are hot and dry, while the winters are Typically, the monsoon arrives in the latter week of June. The yearly rainfall average is 1,183 mm. The wintertime minimum temperature ranges from 4 to 6 degrees Celsius, while the summertime maximum is 38 to 42 degrees Celsius. All the treatments were randomly distributed among the plots and replicate three times. Transplanting of seedlings was done at spacing of 45x60 cm. The observations were recorded on five plants per plots Days to first flowering, days to 50% flowering, days to physiological maturity, days to harvest maturity, days to fruit initiation, plant height (cm), No. of primary branches per plant, No. of secondary branches per plant, fruit length, fruit diameter, No. of fruit per plant, No. of seeds per fruit, seed yield per plant (gm), seed yield per plot (kg). The data recorded during observation was used for analysis to test the level of significance as per method given by (Chandel, 1984). The data were analysed to work out various components coefficient of variation and heritability in broad sense and expected genetic advance as percent of Mean were estimated as suggested by (Johnson et al, 1955) respectively.
Results and Discussion
Pooled data over one years (2024-2025) have been utilized to study genetic variability among the fourteen chilli genotypes for the studied fourteen characters. The analysis of variance, presented in Table 1, clearly suggests significant differences among the genotypes for all the characters (at P=0.01), indicating presence of significant genetic variability in the experimental material. This finding was in accordance with those of Khurana et al., (2003) [17] . (71.83%), fruit yield per plot (54.590%), fruit yield per hectare (48.144%), fruit length (41.661) The high genetic advance % for these characters showed that these characters are governed by additive gene action and selection will be rewarding for the further improvement of such traits. Similar finding reported by Shrishat et al. (2007) [8] for fruit length, number of fruits per plant, Sharma et al. (2010) [2] for fruit girth and fresh weight, number of primary branches, Patel et al. (2015) for fruit weight and fruit yield per plant and Kumar et al. (2020) [9] for fruit yield per hectare Moderate heritability coupled with moderate genetic advance was observed for characters namely; fresh fruit weight, plant height. Similar finding reported by Sharma et al. (2010) [2] for fresh weight. The study conducted simple correlation coefficients (both phenotypic and genotypic) (Table-3 & 4) to examine the relationship between yield and its various components, as well as quality parameters. Fruit yield per ha. (yield)had highly positively and significantly correlated both at genotypic and phenotypic levels with fruit yield per plot, numbers of fruit per plant, fruit weight per plant, fresh fruit weight, fruit length, fruit girth, plant height, total numbers of picking. whereas days to first flowering and days to 50% flowering this character showed negative significant correlation. Similar finding is reported by Nehru et al.
| Character | Mean Squares | — | — |
|---|---|---|---|
| Replication df(2) | Treatments df(6) | Error df(12) | |
| Days to first flowering | 49.63 | 2.71 | 6.99 |
| Days to 50% flowering | 116.32 | 3.12 | 12.75 |
| Days to physiological maturity | 101.41 | 5.29 | 11.84 |
| Days to harvest maturity | 119.94 | 11.76 | 6.32 |
| Days to fruit initiation | 65.10 | 5.33 | 12.00 |
| Plant height (cm) | 52.76 | 0.33 | 6.17 |
| No. Of primary branches per plant | 5.10 | 0.33 | 0.67 |
| No. Of secondary branches per plant | 3.05 | 0.43 | 0.43 |
| Fruit length | 14.98 | 2.33 | 1.72 |
| Fruit diameter | 0.10 | 0.21 | 0.03 |
| No. Of fruit per plant | 295.97 | 11.48 | 24.59 |
| No. Of seeds per fruit | 519.83 | 19.19 | 22.80 |
| Seed yield per plant (gm) | 776.60 | 107.48 | 333.37 |
| Seeds yield per plot (kg) | 0.38 | 0.20 | 0.45 |
Table text extracted from the original PDF; superscript letters are shown inline. The original table image is below.
View original table image
(2003) [10] , Gogoi and Gautam (2002) [11] , Sandeep (2007) [12] , Datta and Jana (2013) [3] , and Patel et al. (2009). The value of residual factor (0.05019) was found to be low thereby, suggesting that the effect of all the yield attributing characters on fruit yield per hectare has been studied and that not more contribution of other major yield component traits has been left to be 0.0153 0.00646 -0.01685 0.02459 -0.00598 -0.11722 -0.02795 -0.09482 -0.02396 0.19872 0.18888 0.14143 0.3228 0.611** 2 0.00131 0.07534 0.02138 -0.02151 0.00552 -0.00039 -0.05655 -0.02656 0.01304 0.16776 -0.18639 0.00233 -0.08184 -0.087 3 -0.00355 0.02215 0.0727 -0.04689 0.01469 0.08452 0.02238 0.07974 0.01596 -0.11645 -0.22856 -0.11907 -0.28653 -0.489** 4 -0.00442 0.01902 0.04001 -0.0852 0.01275 0.07601 -0.00775 0.05975 0.01337 0.00813 -0.16636 -0.07762 -0.25666 -0.369* 5 -0.00159 0.00724 0.01857 -0.0189 0.0575 0.06423 0.0407 0.04783 -0.00109 0.01051 -0.17597 -0.03879 -0.1893 -0.179 6 0.00795 0.00013 -0.02725 0.02872 -0.01638 -0.22551 0.04522 -0.08178 -0.01974 0.19108 0.29094 0.16594 0.3732 0.733 7 -0.00121 -0.01205 0.0046 0.00187 0.00662 -0.02883 0.35367 0.03567 0.00809 -0.13449 -0.06378 -0.0554 -0.0928 0.022 8 0.00889 0.01226 -0.0355 0.03118 -0.01684 -0.11295 -0.07728 -0.16327 -0.02438 0.28566 0.12161 0.16884 0.2933 0.492 9 0.00767 -0.02055 -0.02426 0.02383 0.00132 -0.09311 -0.05988 -0.08327 -0.04781 0.23327 0.14455 0.16466 0.2638 0.510 10 0.0071 0.02952 -0.01977 -0.00162 0.00141 -0.10063 -0.11108 -0.10892 -0.02604 0.42819 0.02891 0.18486 0.2465 0.559 11 0.00622 -0.03022 -0.03576 0.0305 -0.02177 -0.1412 -0.04855 -0.04273 -0.01487 0.02664 0.46465 0.13252 0.3762 0.702 12 0.00928 0.00075 -0.03714 0.02837 -0.00957 -0.16054 -0.08405 -0.11826 -0.03377 0.33958 0.26417 0.23309 0.4287 0.861 13 0.00958 -0.01196 -0.04039 0.04241 -0.02111 -0.16324 -0.06368 -0.09287 -0.02446 0.20475 0.33901 0.1938 0.5156 0.888
Conclusion
The analysis of variance, presented in Table 1, clearly suggests significant differences among the genotypes for all the characters (at P=0.01), indicating presence of significant genetic variability in the experimental material. High magnitude to genotypic coefficient of variation (GCV) coupled with phenotypic coefficient of variation (PCV) i.e., (>20%) were observed in characters namely; Days to first flowering (8.30 and 10.14), days to 50% flowering (11.71 and 13.70),days to physiological maturity (6.32 and 7.47), days to harvest maturity (7.15 and 7.73), days to fruit initiation (4.98 and 6.45), plant height (cm) (8. Fruit yield per ha. (yield) highly positively and significantly correlated both at genotypic and phenotypic levels with whereas days to first flowering and days to 50% flowering this character showed negative significant correlation. Phenotypic Path coefficient analysis revels that Maximum positive direct effect was observed for Days to first flowering (0.0153), days to 50% flowering(0.0753), days to physiological maturity(0.072),days to harvest maturity (-0.085), days to fruit initiation (0.0575), plant height (cm) (-0.225), No. of primary branches per plant (0.353), No. of secondary branches per plant (-0.163), fruit length (-0.0478), fruit diameter (0.428), No. of fruit per plant (0.464), No. of seeds per fruit (0.233), seed yield per plant (gm) (0.515),
Figures and tables from the paper
| Sr. No | Characters | Range | — | — | Variance | — | GCV (%) | PCV (%) | H2 (%) | GA |
|---|---|---|---|---|---|---|---|---|---|---|
| Max | Min | Mean | GV | PV | ||||||
| 1 | Days to first flowering | 52.67 | 40.0 | 45.29 | 14.21 | 21.21 | 8.30 | 10.14 | 71.29 | 6.66 |
| 2 | Days to 50% flowering | 59.33 | 40.00 | 50.19 | 34.52 | 47.27 | 11.71 | 13.70 | 70.58 | 9.96 |
| 3 | Days to physiological maturity | 97.67 | 78.00 | 86.43 | 29.86 | 41.70 | 6.32 | 7.47 | 71.60 | 9..52 |
| 4 | Days to harvest maturity | 97.67 | 76.33 | 86.05 | 37.87 | 44.19 | 7.15 | 7.73 | 85.70 | 11.74 |
| 5 | Days to fruit initiation | 92.67 | 77.00 | 84.48 | 17.70 | 29.70 | 4.98 | 6.45 | 59.59 | 6.69 |
| 6 | Plant height (cm) | 53.33 | 40.33 | 44.80 | 15.53 | 21.70 | 8.80 | 10.40 | 71.58 | 6.87 |
| 7 | No.of primary branches per plant | 6.67 | 2.67 | 5.19 | 1.48 | 2.14 | 23.41 | 28.20 | 68.89 | 2.08 |
| 8 | No. of secondary branches per plant | 6.33 | 3.33 | 5.29 | 0.87 | 1.30 | 17.68 | 21.58 | 67.07 | 1.58 |
| 9 | Fruit length, | 15.00 | 7.67 | 11.19 | 4.42 | 6.14 | 18.79 | 22.15 | 71.96 | 3.67 |
| 10 | Fruit diameter | 0.93 | 0.47 | 0.73 | 0.03 | 0.05 | 21.77 | 31.41 | 48.03 | 0.23 |
| 11 | No. of fruit per plant | 86.67 | 67 | 67.10 | 90.46 | 115.05 | 14.18 | 15.99 | 78.63 | 17.37 |
| 12 | No. of seeds per fruit | 86.67 | 62 | 64.38 | 165.67 | 188.48 | 19.99 | 21.32 | 87.90 | 24.86 |
| 13 | Seed yield per plant (gm) | 200.67 | 159.00 | 177.62 | 147.75 | 481.11 | 6.84 | 12.35 | 30.71 | 13.88 |
| 14 | Seed yield per plot (kg) | 4.14 | 3.13 | 3.72 | 0.02 | 0.43 | 0.0 | 17.61 | 5.45 | 0.07 |
Table text extracted from the original PDF; superscript letters are shown inline. The original table image is below.
View original table image
| — | 1 | 2 | 3 | 4 | 5 | 6 | 7 | 8 | 9 | 10 | 11 | 12 | 13 | 14 |
|---|---|---|---|---|---|---|---|---|---|---|---|---|---|---|
| 1 | 0.086 | -0.232 | -0.289 | -0.104 | 0.520** | -0.079 | 0.581** | 0.501** | 0.464** | 0.406* | 0.607** | 0.626** | 0.611** | |
| 2 | 0.294 | 0.252 | 0.096 | 0.002 | -0.160 | 0.163 | -0.273 | 0.392* | -0.401* | 0.010 | -0.159 | -0.087 | ||
| 3 | 0.550** | 0.255 | -0.375* | 0.063 | -0.488** | -0.334* | -0.272 | -0.492** | -0.511** | -0.556** | -0.489** | |||
| 4 | 0.222 | -0.337* | -0.022 | -0.366* | -0.280 | 0.019 | -0.358* | -0.333* | -0.498** | -0.369* | ||||
| 5 | -0.285 | 0.115 | -0.293 | 0.023 | 0.025 | -0.379* | -0.166 | -0.367* | -0.179 | |||||
| 6 | 0.128 | 0.501** | 0.413* | 0.446** | 0.626** | 0.712** | 0.724** | 0.733** | ||||||
| 7 | -0.219 | -0.169 | -0.314 | -0.137 | -0.238 | -0.180 | 0.022 | |||||||
| 8 | 0.510** | 0.667** | 0.262 | 0.724** | 0.569** | 0.492** | ||||||||
| 9 | 0.545** | 0.311 | 0.706** | 0.512** | 0.510** | |||||||||
| 10 | 0.062 | 0.793** | 0.478** | 0.559** | ||||||||||
| 11 | 0.569** | 0.730** | 0.702** | |||||||||||
| 12 | 0.831** | 0.861** | ||||||||||||
| 13 | 0.888** | |||||||||||||
| 14 |
Table text extracted from the original PDF; superscript letters are shown inline. The original table image is below.
View original table image
| 1. Days to first flowering | 5. Days to fruit initiation | 9. Fruit length, | 13.Seed yield per plant (gm) |
|---|---|---|---|
| 2. Days to 50% flowering | 6. Plant height (cm) | 10.Fruit diameter | 14.Seeds yield per plot (kg) |
| 3. Days to physiological maturity | 7. No.of primary branches per plant | 11.No.of fruit per plant | |
| 4. Days to harvest maturity | 8. No.of secondary branches per plant | 12.No.of seeds per fruit |
Table text extracted from the original PDF; superscript letters are shown inline. The original table image is below.
View original table image
| — | 1 | 2 | 3 | 4 | 5 | 6 | 7 | 8 | 9 | 10 | 11 | 12 | 13 | 14 |
|---|---|---|---|---|---|---|---|---|---|---|---|---|---|---|
| 1 | 0.086 | -0.232 | -0.289 | -0.104 | 0.520** | -0.079 | 0.581** | 0.501** | 0.464** | 0.406* | 0.607** | 0.626** | 0.611** | |
| 2 | 0.294 | 0.252 | 0.096 | 0.002 | -0.160 | 0.163 | -0.273 | 0.392* | -0.401* | 0.010 | -0.159 | -0.087 | ||
| 3 | 0.550** | 0.255 | -0.375* | 0.063 | -0.488** | -0.334* | -0.272 | -0.492** | -0.511** | -0.556** | -0.489** | |||
| 4 | 0.222 | -0.337* | -0.022 | -0.366* | -0.280 | 0.019 | -0.358* | -0.333* | -0.498** | -0.369* | ||||
| 5 | -0.285 | 0.115 | -0.293 | 0.023 | 0.025 | -0.379* | -0.166 | -0.367* | -0.179 | |||||
| 6 | 0.128 | 0.501** | 0.413* | 0.446** | 0.626** | 0.712** | 0.724** | 0.733** | ||||||
| 7 | -0.219 | -0.169 | -0.314 | -0.137 | -0.238 | -0.180 | 0.022 | |||||||
| 8 | 0.510** | 0.667** | 0.262 | 0.724** | 0.569** | 0.492** | ||||||||
| 9 | 0.545** | 0.311 | 0.706** | 0.512** | 0.510** | |||||||||
| 10 | 0.062 | 0.793** | 0.478** | 0.559** | ||||||||||
| 11 | 0.569** | 0.730** | 0.702** | |||||||||||
| 12 | 0.831** | 0.861** | ||||||||||||
| 13 | 0.888** |
Table text extracted from the original PDF; superscript letters are shown inline. The original table image is below.
View original table image
| 1. Days to first flowering | 5. Days to fruit initiation | 9. Fruit length, | 13.Seed yield per plant (gm) |
|---|---|---|---|
| 2. Days to 50% flowering | 6. Plant height (cm) | 10.Fruit diameter | 14.Seeds yield per plot (kg) |
| 3. Days to physiological maturity | 7. No.of primary branches per plant | 11.No.of fruit per plant | |
| 4. Days to harvest maturity | 8. No.of secondary branches per plant | 12.No.of seeds per fruit |
Table text extracted from the original PDF; superscript letters are shown inline. The original table image is below.
View original table image
| Characters | — | — | — | — | — | — | — | — | — | — | — | — | — | — |
|---|---|---|---|---|---|---|---|---|---|---|---|---|---|---|
| S. No. | 1 | 2 | 3 | 4 | 5 | 6 | 7 | 8 | 9 | 10 | 11 | 12 | 13 | 14 |
| 1 | 0.0153 | 0.00646 | -0.01685 | 0.02459 | -0.00598 | -0.11722 | -0.02795 | -0.09482 | -0.02396 | 0.19872 | 0.18888 | 0.14143 | 0.3228 | 0.611** |
| 2 | 0.00131 | 0.07534 | 0.02138 | -0.02151 | 0.00552 | -0.00039 | -0.05655 | -0.02656 | 0.01304 | 0.16776 | -0.18639 | 0.00233 | -0.08184 | -0.087 |
| 3 | -0.00355 | 0.02215 | 0.0727 | -0.04689 | 0.01469 | 0.08452 | 0.02238 | 0.07974 | 0.01596 | -0.11645 | -0.22856 | -0.11907 | -0.28653 | -0.489** |
| 4 | -0.00442 | 0.01902 | 0.04001 | -0.0852 | 0.01275 | 0.07601 | -0.00775 | 0.05975 | 0.01337 | 0.00813 | -0.16636 | -0.07762 | -0.25666 | -0.369* |
| 5 | -0.00159 | 0.00724 | 0.01857 | -0.0189 | 0.0575 | 0.06423 | 0.0407 | 0.04783 | -0.00109 | 0.01051 | -0.17597 | -0.03879 | -0.1893 | -0.179 |
| 6 | 0.00795 | 0.00013 | -0.02725 | 0.02872 | -0.01638 | -0.22551 | 0.04522 | -0.08178 | -0.01974 | 0.19108 | 0.29094 | 0.16594 | 0.3732 | 0.733 |
| 7 | -0.00121 | -0.01205 | 0.0046 | 0.00187 | 0.00662 | -0.02883 | 0.35367 | 0.03567 | 0.00809 | -0.13449 | -0.06378 | -0.0554 | -0.0928 | 0.022 |
| 8 | 0.00889 | 0.01226 | -0.0355 | 0.03118 | -0.01684 | -0.11295 | -0.07728 | -0.16327 | -0.02438 | 0.28566 | 0.12161 | 0.16884 | 0.2933 | 0.492 |
| 9 | 0.00767 | -0.02055 | -0.02426 | 0.02383 | 0.00132 | -0.09311 | -0.05988 | -0.08327 | -0.04781 | 0.23327 | 0.14455 | 0.16466 | 0.2638 | 0.510 |
| 10 | 0.0071 | 0.02952 | -0.01977 | -0.00162 | 0.00141 | -0.10063 | -0.11108 | -0.10892 | -0.02604 | 0.42819 | 0.02891 | 0.18486 | 0.2465 | 0.559 |
| 11 | 0.00622 | -0.03022 | -0.03576 | 0.0305 | -0.02177 | -0.1412 | -0.04855 | -0.04273 | -0.01487 | 0.02664 | 0.46465 | 0.13252 | 0.3762 | 0.702 |
| 12 | 0.00928 | 0.00075 | -0.03714 | 0.02837 | -0.00957 | -0.16054 | -0.08405 | -0.11826 | -0.03377 | 0.33958 | 0.26417 | 0.23309 | 0.4287 | 0.861 |
| 13 | 0.00958 | -0.01196 | -0.04039 | 0.04241 | -0.02111 | -0.16324 | -0.06368 | -0.09287 | -0.02446 | 0.20475 | 0.33901 | 0.1938 | 0.5156 | 0.888 |
Table text extracted from the original PDF; superscript letters are shown inline. The original table image is below.
View original table image
References
15 in the original paper- Anonymous. Horticultural Statistics at a glance 2018, National Horticulture Board, Ministry of Agriculture and Farmers welfare, Government of India, 2018,
- Anonymous. Horticulture Statistics at a glance 2021, Department of Agriculture Development and Farmer Welfare and Bio-Technology, Chhattisgarh, 2021,
- Datta S, Christena LR, Rajaram YR. Enzyme immobilization: an overview on techniques and support materials. 3 Biotech. 2013 Feb; 3:1-9.
- Gogoi D, Gautam BP. Correlation and Path coefficient analysis in chilli (Capsicum annuum L.), Agriculture Science Digest. 2002;23(3):162.
- Government of 3. Sharma VK, Semwal CS, Uniyal SP. Genetic Variability and character association Analysis in bell pepper (Capsicum annuum L.). Journal of Horticulture Forestry. 2010;2(3):058-065.
- Kumar TGH, Patil HB, Jayshree, Gowda DCM. Genetic variability studies in green chilli (Capsicum annuum L.). International Journal 2020;8(4):2460-2463. of Chemical Studies.
- Kavitha PS, Sudha A, Srividya. Assessment of chilli varieties in Salem district for higher productivity. Journal of Horticulture Sciences. 2018;13(1):119-121.
- Magahi UG, Rafi MY, Iamail MR, Malek MA, Latif MA. Heritability and genetic advance among chilli peppers genotypes for heat tolerance and morphological characteristics. The Scientific World journal, 2014, 14.
- Nahak SC, Nandi A, Shau GS, Tripathy P, Das S, Mohanty A, et al. Assessment of genetic diversity in different chilli (Capsicum annuum L.), genotypes. International Journal Current Microbiology & Applied Sciences. 2018;7(9):634-639.
- Nehru SD, Manjunath A, Rangaiah. Genetic variability and stability for fruit yield and other characters in chilli (Capsicum annuum L.). Karnataka J. Agril. Sci. 2003;16(1):44-47.
- Rosmaina S, Hasrol F, Yanti J, Zulfahmi. Estimation of variability, heritability and Genetic advance among local chilli pepper genotype cultivated in peat lands. Bulgaria Journal Agricultural Science. 2016;22(3):431436.
- Shrishat SS, Giritammannavar VA, Patil SJ. Analysis of genetic variability for Quantitative Traits in Chilli. Karnataka Journal of Agriculture Science. 2007;20(1):29 32.
- Singh MD, Singh MG. Correlation and path studies in selected local chilies (Capsicum annuum L.). Environment Ecology. 2004;22(4):672-675.
- Soares-Santos M, Holz DE, Annis J, Chornock R, Herner K, Berger E, et al. The electromagnetic counterpart of the binary neutron star merger LIGO/Virgo GW170817. I. Discovery of the optical counterpart using the dark energy camera. The Astrophysical Journal Letters. 2017 Oct 16;848(2):L16.
- Wiesner W, Khurana B, Ji H, Ros PR. CT of acute bowel ischemia. Radiology. 2003 Mar;226(3):635-650. ~ 967.