
Research article · 2025 · Full text
International Journal of Agriculture and Food ScienceStudy of Gluten Physicochemical Properties of Wheat (Triticum aestivum L.) genotypes for Their Suitability in Biscuit making
Volume 7(9) · Pages 821–823 · DOI: 10.33545/2664844x.2025.v7.i9k.830 ↗
Research areasBacterial Genetics and BiotechnologyBacterial Identification and Susceptibility TestingCell Image Analysis Techniques
Abstract
Author-writtenThe present study evaluated the gluten physicochemical properties of 25 wheat (Triticum aestivum L.) genotypes comprising 22 Glu-1 mutant lines, the parent variety, and two check varieties (Phule Satwik and HS490) to assess their suitability for biscuit-making. Protein content among the mutant lines ranged from 10.67% (MTM-11) to 12.82% (MTM-17), while gluten content varied from 7.38% to 11.62%. Lowest micro-sedimentation values (MSV) among mutant lines is found in MTM-5 with 1.30 cm MSV. Mutant lines showed consistently lower MSV than parent (5.75 cm) and check variety indicating weaker gluten strength favorable for biscuit processing. Lactic acid solvent retention capacity (LASRC) values of the mutants ranged from 90.25% to 103.50%. Mutant lines showed significantly lower LASRC compared with parent having 109.25% LASRC but similar or lower than Phule Satwik (92.25%). The reduced MSV and LASRC values of the mutant lines confirm their weaker gluten strength, a desirable trait for producing soft-textured, high-quality biscuits. These findings highlight the potential of Glu-1 mutant lines as promising genetic resources for biscuit-oriented wheat breeding programs.
Summary
Source-checkedPlain-language reading of the full paper, prepared with AI and checked against the text. Each point links to the authors' own words.
Why it matters
- Wheat is the most widely grown cereal crop and a primary source of daily calories for people worldwide. View evidence ↗
- The baking quality and properties of dough are primarily controlled by gluten, which consists of gliadins and glutenins. View evidence ↗
- For high-quality biscuits, low protein content and weak gluten strength are preferred because they improve the texture, sensory quality, and spread ratio. View evidence ↗
The question
- The study aimed to evaluate the physicochemical properties of gluten in wheat Glu-1 mutants to find genotypes that could improve biscuit quality. View evidence ↗
What they did
- The researchers tested 25 wheat lines, consisting of 22 Glu-1 mutant lines (created from a cross between Naphal and HMW-GS mutants) and two check varieties: Pusa Baker and Phule Satwik. View evidence ↗
- Near infrared spectroscopy was used to analyze the gluten and protein content of the genotypes. View evidence ↗
- The study measured gluten strength using the Micro-Sedimentation Test (MST) on 20g of milled whole grains and the Lactic Acid Solvent Retention Capacity (LASRC) test. View evidence ↗
What they found
- Among the mutant lines, protein content averaged 11.00% (ranging from 10.67% in MTM-11 to 12.82% in MTM-17) and gluten content averaged 9% (ranging from 7.38% to 11.62%). View evidence ↗
- The micro-sedimentation value (MSV) for mutant genotypes averaged 3.16 cm, with MTM-5 showing the lowest value (1.30 cm) and MTM-1 showing the highest (5.95 cm). View evidence ↗
- All mutant genotypes had lower MSV than the parent variety and the check varieties Phule Satwik (5.75 cm) and HS490 (5.80 cm), indicating weaker gluten strength. View evidence ↗
- The Lactic Acid Solvent Retention Capacity (LASRC) of the mutants averaged 94%, ranging from a low of 90.25% (MTM-7 and MTM-8) to a high of 103.50% (MTM-13). View evidence ↗
- Most mutant lines had significantly lower LASRC than the parent variety (109.25%) and were similar to or lower than the check variety Phule Satwik (92.25%). View evidence ↗
What it means
- The authors conclude that Glu-1 mutant lines are suitable for producing high-quality, soft-textured biscuits due to their low protein content and weak gluten strength. View evidence ↗
- The authors recommend using Glu-1 mutant lines as genetic resources for wheat breeding programs focused on biscuit production. View evidence ↗
Visual summary
3 visualsIllustrations explain the paper; charts are replotted from the paper's own table values.
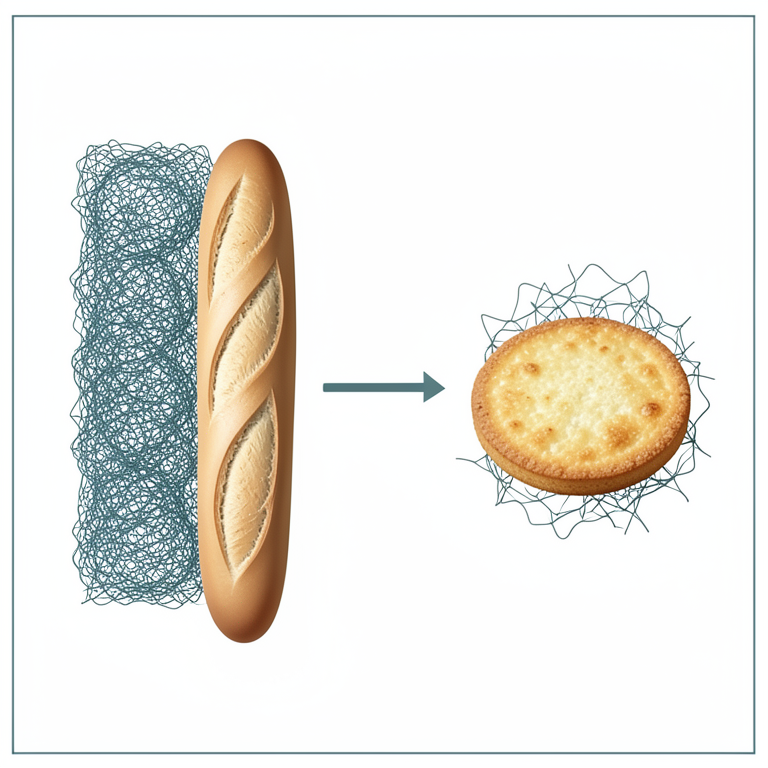
Relationship between Gluten Strength and Biscuit Quality
AI-generated conceptual illustration (Wheat gluten protein networks and baked biscuits). It explains the idea and does not show study data.
View source evidence ↗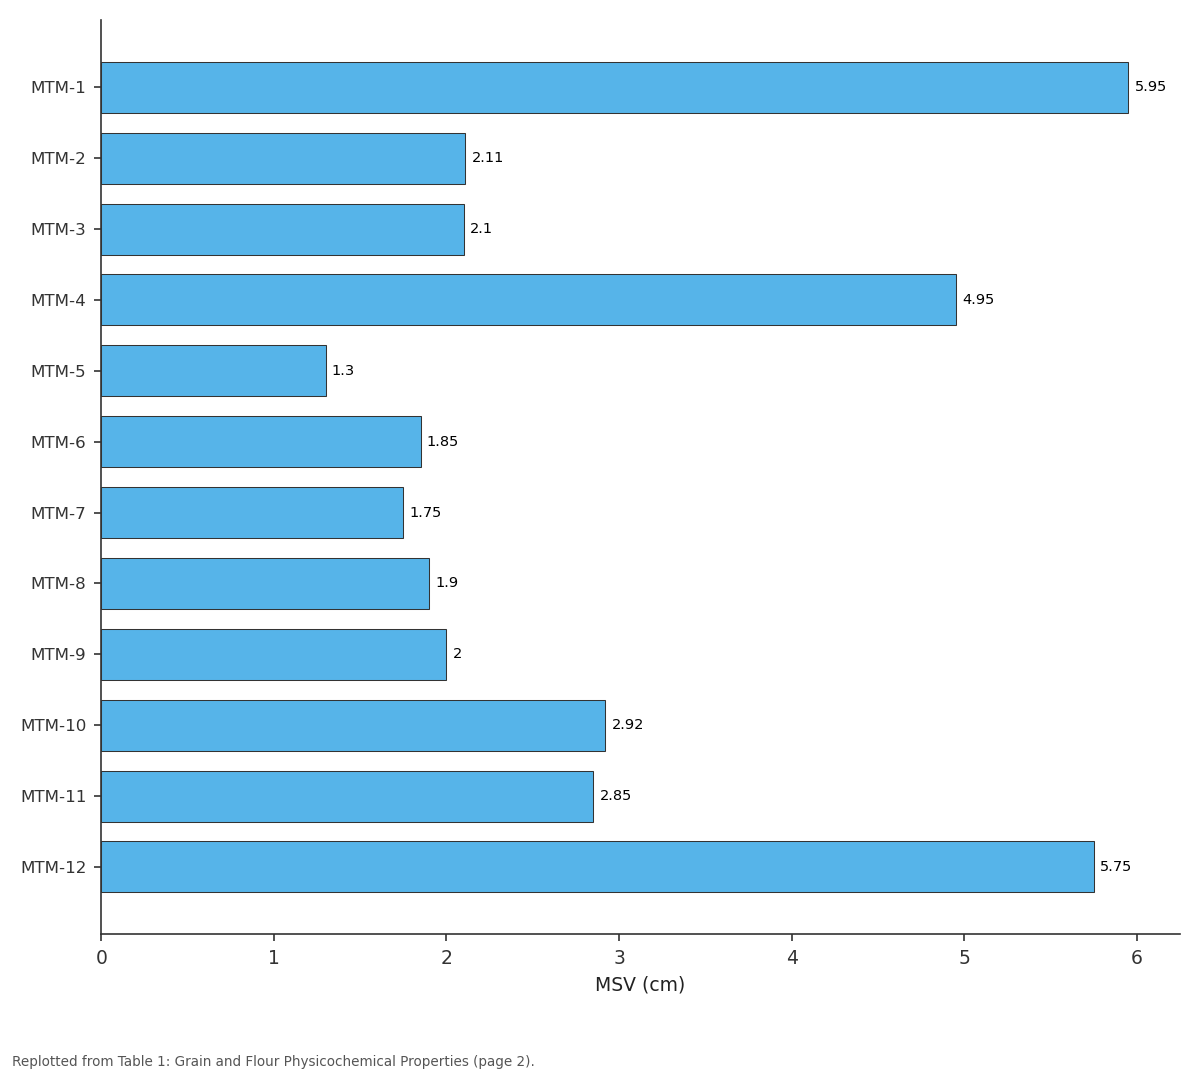
MSV (cm): MTM-1 vs MTM-2 vs MTM-3 vs MTM-4 vs MTM-5
Replotted from Table 1 (page 2) of the original paper. Every bar is the paper's own table value.
View source evidence ↗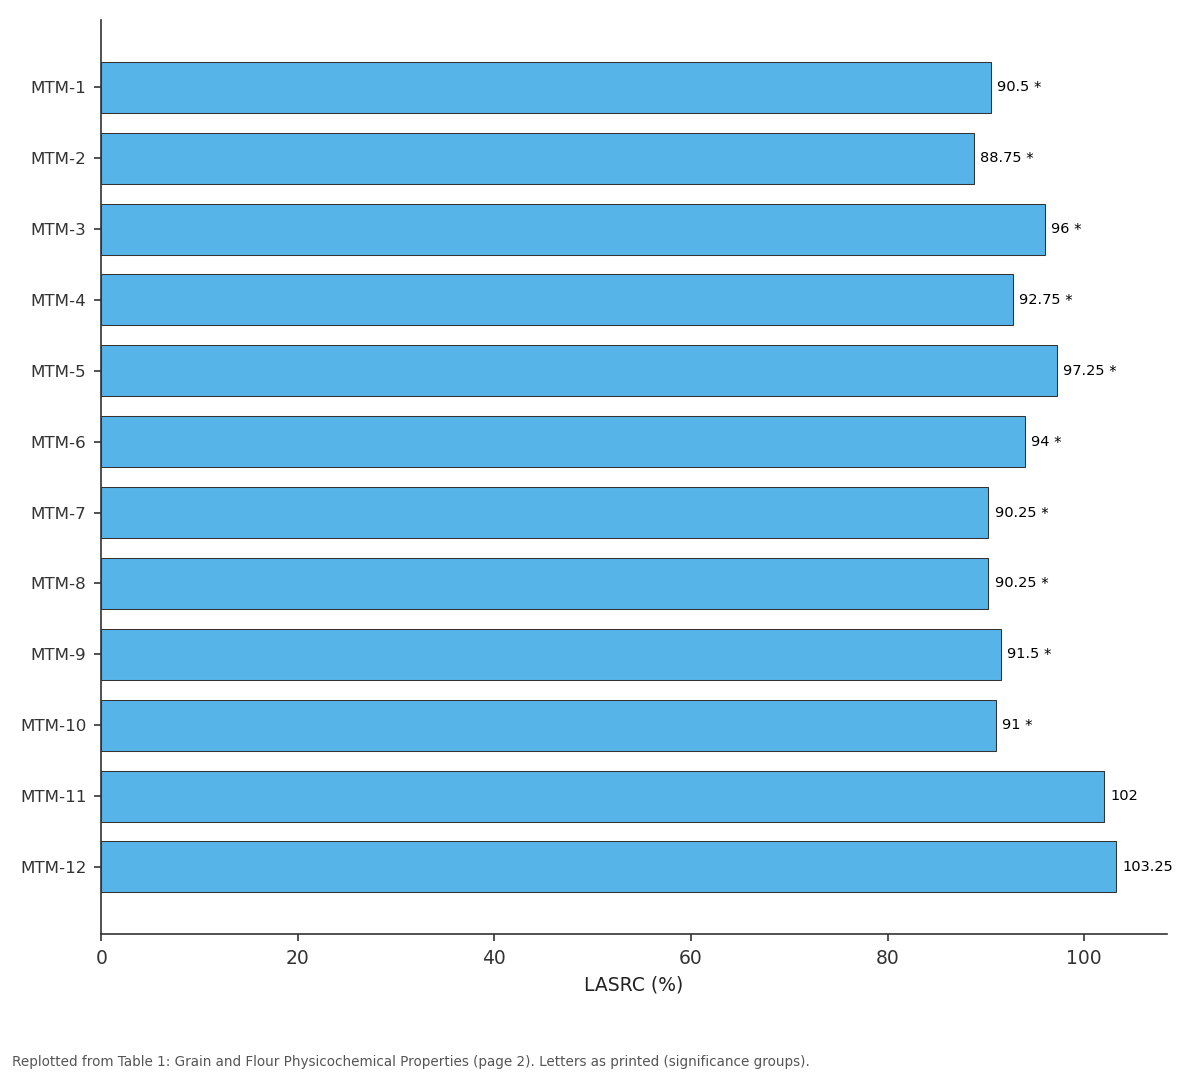
LASRC (%): MTM-1 vs MTM-2 vs MTM-3 vs MTM-4 vs MTM-5
Replotted from Table 1 (page 2) of the original paper. Every bar is the paper's own table value.
View source evidence ↗Figures & tables
From the original paper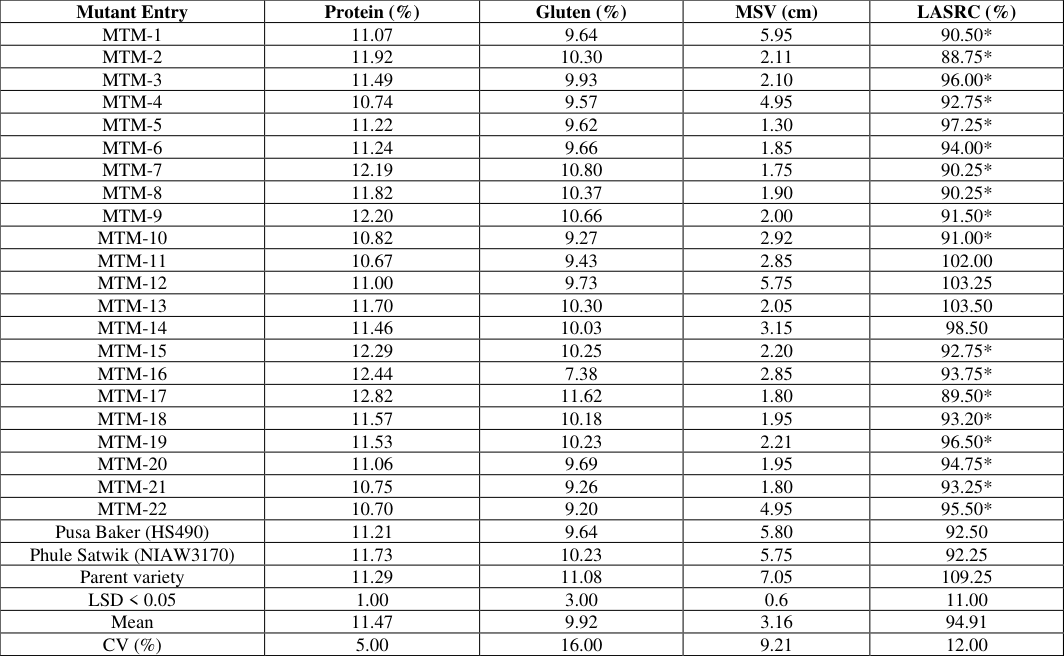 Table 1
Introduction
Wheat (Triticum aestivum L.) is the most widely cultivated cereal crop, majorly contributing in the daily caloric intake for the global population. Its wide adaptability across tropicaltemperate regions makes it a major contributor to global nutrition. India is the second-largest producer after China plays a vital role in global wheat supply, with cultivation spread across major states under both irrigated and rainfed conditions. wheat originated in Southwest Asia and later diversified across Central Asia, the Mediterranean, and Ethiopia (Perrino & Porcedu, 1990; Kundu & Nagarajan, 1996) [11,7] . Modern bread wheat is predominantly hexaploid (T. aestivum, 2n=42), comprising A, B, and D genomes, with T. urartu, Aegilops speltoides, and Aegilops tauschii identified as progenitors (Dvorak et al., 1993) [4] . Durum wheat (T. durum) accounts for about 5% of India's wheat acreage and is valued for pasta production due to its hardness and high protein content (Sakaru et al., 2013) [14] . The end-use quality of wheat is largely determined by its protein content and gluten composition. Wheat storage proteins include albumins, globulins, gliadins, and glutenins (Osborne, 1908) [8] . Among these, gluten composed primarily of gliadins and glutenins governs dough properties and baking quality (Anjum et al., 2007) [1] . High-molecular-weight glutenin subunits (HMW-GS), encoded by Glu-1 loci (1AL, 1BL, 1DL), play a pivotal role in determining dough strength (Payne et al., 1987) [10] . Weak gluten strength, low protein content are desirable attributes in biscuit-making, as they enhance spread ratio, texture, and sensory quality (Pareyt & Delcour, 2008) [9] . Mutations in HMW-GS genes, particularly deletions or null alleles, reduce gluten strength and have been shown to improve biscuit quality (Ram et al., 2007; Yang et al., 2023) [12,16] . Given the rising demand for crop with product-specific varieties in India, particularly for biscuits, characterizing Glu-1 mutants for physicochemical traits is essential. This study focuses on evaluating gluten physicochemical properties of wheat Glu-1 mutants to identify genotypes suitable for biscuit-quality improvement.
Material and Methodology
In the present study, seeds of 25 wheat lines were used, including 22 Glu-1 mutant lines developed through a cross between Naphal and HMW-GS mutants and two check varieties phule satwik and pusa baker. Protein and gluten Content of genotypes were analyzed on Near infrared spectroscopy. Cleaned 20 g of whole grains of each genotype were milled using a mill and MST conducted according to the procedure described in Carter et al., (1999) [3] , which was outlined with minor modifications. LASRC test was conducted to analyze the gluten strength of wheat flour were conducted according to the procedure described (Bettge et al., 2002) [2] .
Results and discussion
Protein and gluten content Protein and gluten content of mutant lines presented in Table 1. Protein content ranged from 10.67% in MTM-11 to 12.82% in MTM-17 with mean 11.00% and gluten content ranged from 7.38% to 11.62% averaging 9%. Low protein content serves as a valuable selection criterion for biscuitmaking quality, as it is associated with weak gluten, wheat with low protein content tends to have softer grains and weaker gluten, resulting in smaller loaves and an inferior crumb structure for bread but better-quality biscuits and cookies (Tipples et al., 1994) [15] .
| Mutant Entry | Protein (%) | Gluten (%) | MSV (cm) | LASRC (%) |
|---|---|---|---|---|
| MTM-1 | 11.07 | 9.64 | 5.95 | 90.50* |
| MTM-2 | 11.92 | 10.30 | 2.11 | 88.75* |
| MTM-3 | 11.49 | 9.93 | 2.10 | 96.00* |
| MTM-4 | 10.74 | 9.57 | 4.95 | 92.75* |
| MTM-5 | 11.22 | 9.62 | 1.30 | 97.25* |
| MTM-6 | 11.24 | 9.66 | 1.85 | 94.00* |
| MTM-7 | 12.19 | 10.80 | 1.75 | 90.25* |
| MTM-8 | 11.82 | 10.37 | 1.90 | 90.25* |
| MTM-9 | 12.20 | 10.66 | 2.00 | 91.50* |
| MTM-10 | 10.82 | 9.27 | 2.92 | 91.00* |
| MTM-11 | 10.67 | 9.43 | 2.85 | 102.00 |
| MTM-12 | 11.00 | 9.73 | 5.75 | 103.25 |
| MTM-13 | 11.70 | 10.30 | 2.05 | 103.50 |
| MTM-14 | 11.46 | 10.03 | 3.15 | 98.50 |
| MTM-15 | 12.29 | 10.25 | 2.20 | 92.75* |
| MTM-16 | 12.44 | 7.38 | 2.85 | 93.75* |
| MTM-17 | 12.82 | 11.62 | 1.80 | 89.50* |
| MTM-18 | 11.57 | 10.18 | 1.95 | 93.20* |
| MTM-19 | 11.53 | 10.23 | 2.21 | 96.50* |
| MTM-20 | 11.06 | 9.69 | 1.95 | 94.75* |
| MTM-21 | 10.75 | 9.26 | 1.80 | 93.25* |
| MTM-22 | 10.70 | 9.20 | 4.95 | 95.50* |
| Pusa Baker (HS490) | 11.21 | 9.64 | 5.80 | 92.50 |
| Phule Satwik (NIAW3170) | 11.73 | 10.23 | 5.75 | 92.25 |
| Parent variety | 11.29 | 11.08 | 7.05 | 109.25 |
| LSD < 0.05 | 1.00 | 3.00 | 0.6 | 11.00 |
| Mean | 11.47 | 9.92 | 3.16 | 94.91 |
| CV (%) | 5.00 | 16.00 | 9.21 | 12.00 |
Table text extracted from the original PDF; superscript letters are shown inline. The original table image is below.
View original table image
Micro-Sedimentation Value
The micro-sedimentation value of all the mutant genotypes has been presented in the Table 1. Micro sedimentation value of mutant genotype varied from 1.30 cm to 5.95 averaging 3.16 cm. Mutant genotype MTM-5 exhibited lowest micro-sedimentation value and MTM-1 showed highest MSV among mutant lines. Micro-Sedimentation Value of all mutant genotypes were lower than parent variety and the check varieties Phule Satwik and HS490 which showed MSV, 5.75 cm and 5.80 cm respectively. Lower the MSV represents weak gluten strength, thus low sedimentation value is also a good selection parameter for biscuit quality (Payne et al., 1987; Knezevic et al., 1993) [10,6] . MSV is positively correlated with glutenin polymerization and dough strength, the observed lower values suggest that these mutants possess weaker gluten, which is beneficial for biscuit and cookie production where extensibility and spreadability of dough are preferred.
Lactic Acid Solvent Retention Capacity
LASRC of mutant genotypes varied from 90.25% to 103.50% averaging 94% presented in Table 1. Lowest LASRC observed in genotype MTM-7,8 while highest in MTM-13. LASRC of most of mutants was significantly lowered than parent having LASRC 109.25% and check variety Phule Satwik having 92.25% of LASRC. Lactic acid SRC (LASRC) is associated with glutenin network formation and gluten strength of flour, because a pH well below 7 favors swelling and network formation by gluten polymers relative to polysaccharides (Gaines, 2000; Slade and Levine, 1994) [5,13] . In this study the mutant lines showed lower LASRC revealing weaker gluten strength which is found desirable for the biscuit quality. ). In this study, the Glu-1 mutant lines exhibited weak gluten strength and low protein content is found to be suitable for biscuit making and developing soft-textured wheat varieties for high-quality biscuit making.
References
16 in the original paper- Anjum FM, Khan MR, Din A, Saeed M, Pasha I, Arshad MU. Wheat gluten: high molecular weight glutenin subunits structure, genetics, and relation to dough elasticity. J Food Sci. 2007;72:56-63.
- Bettge A, Morris CF, DeMacon VL, Kidwell KK. Adaptation of AACC method 56-11, solvent retention capacity, for use as an early generation selection tool for cultivar development. Cereal Chem. 2002;79(5):670-4.
- Carter BP, Morris CF, Anderson JA. Optimizing the SDS sedimentation test for end-use quality selection in a soft white and club wheat breeding program. Cereal Chem. 1999;76(6):907-911.
- Dvorak J, Terlizzi PD, Zhang HB, Resta P. The evolution of polyploid wheats: identification species. Genome. 1993;36(1):21-31.
- Gaines CS. Collaborative study of methods for solvent retention capacity profiles (AACC Method 56-11). Cereal Foods World. 2000;45(7):303-306.
- Knezevic D, Surlan M, Momirovic G, Ciric D. Allelic variation at Glu-1 loci in some Yugoslav wheat cultivars. Euphytica. 1993;69(2):89-94.
- Kundu S, Nagarajan S. Distinguishing characters of Indian wheat varieties. Res Bull No. 4. Directorate of Wheat Research, Karnal, India; 1996.
- Osborne TB. Our present knowledge of plant proteins. Science. 1908;28(10):417-427.
- Pareyt B, Delcour JA. The role of wheat flour constituents, sugar, and fat in low-moisture cerealbased products: a review on sugar-snap cookies. Crit Rev Food Sci Nutr. 2008;48(9):824-839.
- Payne PL, Nightingale MA, Kratiger AF, Holt LM. The relationship between HMW glutenin subunit composition and the bread making quality of Britishgrown wheat varieties. J Sci Food Agric. 1987;40(1):51-65.
- Perrino P, Porceddu E. Wheat genetic resources in Ethiopia and the Mediterranean region. In: Wheat genetic resources: meeting diverse needs. 1990;161365.
- Ram S, Shoran J, Mishra B. Nap Hal, an Indian landrace of wheat, contains unique genes for better biscuit making quality. J Plant Biochem Biotechnol. 2007;16(2):83-6. doi:10.1007/bf03321979
- Slade L, Levine H. Structure-function relationships of cookie and cracker ingredients. In: Faridi H, editor. The Science of Cookie and Cracker Production. New York: Chapman & Hall; 1994. p. 123-141.
- Sakaru VSP. Variation at Glu-1, Glu-3 and Gli-B1 alleles and classification of landraces, old varieties and rust resistant sources in durum wheat. J Cereal Res. 2013, 5(1).
- Tipples KH, Kilborn RH, Preston KR. Bread-wheat quality defined. In: Bushuk W, Rasper VF, editors. Wheat: Production, Properties and Quality. Glasgow: Chapman and Hall; 1994. p. 25-35.
- Yang T. Influence of high-molecular-weight glutenin subunit on components and multiscale structure of gluten and dough quality in soft wheat. J Agric Food Chem. 2023;71(12):4943-4956.