
Research article · 2025 · Full text
International Journal of Agriculture and Food ScienceGroundwater marketing and its economic impact: An evidence from northern dry zone of Karnataka
Volume 7(9) · Pages 895–901 · DOI: 10.33545/2664844x.2025.v7.i9l.841 ↗
Research areasPolymer Surface Interaction StudiesMolecular Junctions and NanostructuresHydrogels: synthesis, properties, applications
Abstract
Author-writtenGroundwater has become the most critical source of irrigation in India, particularly in semi-arid and dry regions where rainfall is uncertain and canal irrigation is inadequate. In the Northern Dry Zone of Karnataka, dependence on groundwater has led to the emergence of informal groundwater markets, where well-owners sell water to other farmers through local arrangements. This study aimed at assessing the economic impact of groundwater marketing, the factors influencing farmers’ participation, and its role in ensuring irrigation access and profitability. Primary data were collected from 120 farmers across 12 villages in Belagavi, Bagalkot, and Vijayapura districts of Northern Karnataka. The results revealed that self-users constituted 46.66 percent of the sample, while 27.50 percent were sellers and 25.84 percent buyers. Groundwater markets were found to provide substantial economic gains, with the highest gross benefits recorded in perennial crops (₹1,37,364/ha), followed by kharif, summer, and rabi crops. Non-participation was mainly due to insecurity regarding groundwater availability (82.14%), lack of surplus water (75%), and increased area under high water-intensive crops (62.50%). Sellers were motivated primarily by strong demand from neighbours (84.61%), surplus water availability (77.28%), and the opportunity for additional income (68.12%). The study concludes that groundwater markets improve irrigation access, enhance farm incomes, and support crop diversification, but they also contribute to rising pressure on depleting aquifers. For long-term sustainability, measures such as groundwater recharge, regulation of borewell drilling, and promotion of water-saving irrigation technologies are essential. These findings underscore the dual role of groundwater markets as both an opportunity for agricultural growth and a challenge for sustainable resource management in Karnataka’s dry zones.
Summary
Source-checkedPlain-language reading of the full paper, prepared with AI and checked against the text. Each point links to the authors' own words.
Why it matters
- Groundwater is the most vital irrigation source in India's semi-arid and dry regions due to unreliable rainfall and insufficient canal systems. View evidence ↗
- Approximately 60% of Indian districts exhibit signs of groundwater contamination, depletion, or both. View evidence ↗
- In the Northern Dry Zone of Karnataka, where annual rainfall is between 464.5 mm and 785.7 mm, 23.8% of taluks are over-exploiting groundwater. View evidence ↗
The question
- The study aimed to evaluate the economic impact of groundwater marketing, the factors that drive farmer participation, and how it affects irrigation access and profitability. View evidence ↗
What they did
- The research was conducted across the Belagavi, Bagalkot, and Vijayapura districts in the Northern Dry Zone of Karnataka. View evidence ↗
- The sample consisted of 120 randomly selected farmers from 12 villages. View evidence ↗
- Data were gathered via personal interviews using a structured schedule and analyzed using descriptive statistics, percentages, and ratio analysis. View evidence ↗
What they found
- Among the sampled farmers, 46.66% were self-users, 27.50% were sellers, and 25.84% were buyers of groundwater. View evidence ↗
- Sellers typically held larger landholdings, averaging 3.35 ha, compared to buyers, who averaged 2.28 ha. View evidence ↗
- Perennial crops provided the highest gross benefit from water marketing at ₹1,37,364/ha, followed by kharif (₹29,324/ha), summer (₹27,515/ha), and rabi (₹26,838/ha) crops. View evidence ↗
- The primary reason self-users did not participate in the water market was insecurity regarding groundwater resources, cited by 82.14% of them. View evidence ↗
- A lack of surplus water to sell was the second most common reason for non-participation, reported by 75% of self-users. View evidence ↗
- The strongest motivation for sellers to participate in the market was demand from their neighbors (84.61%). View evidence ↗
- Surplus water availability (77.28%) was the second most important reason for sellers to enter the market. View evidence ↗
What it means
- The authors conclude that groundwater markets are useful informal institutions that provide irrigation access to well-less farmers and extra income to sellers. View evidence ↗
- To ensure sustainability, the authors recommend regulating borewell drilling, adopting water-saving irrigation, and implementing groundwater recharge structures. View evidence ↗
- The authors note that groundwater markets contribute to increased pressure on aquifers that are already depleting. View evidence ↗
Visual summary
2 visualsIllustrations explain the paper; charts are replotted from the paper's own table values.
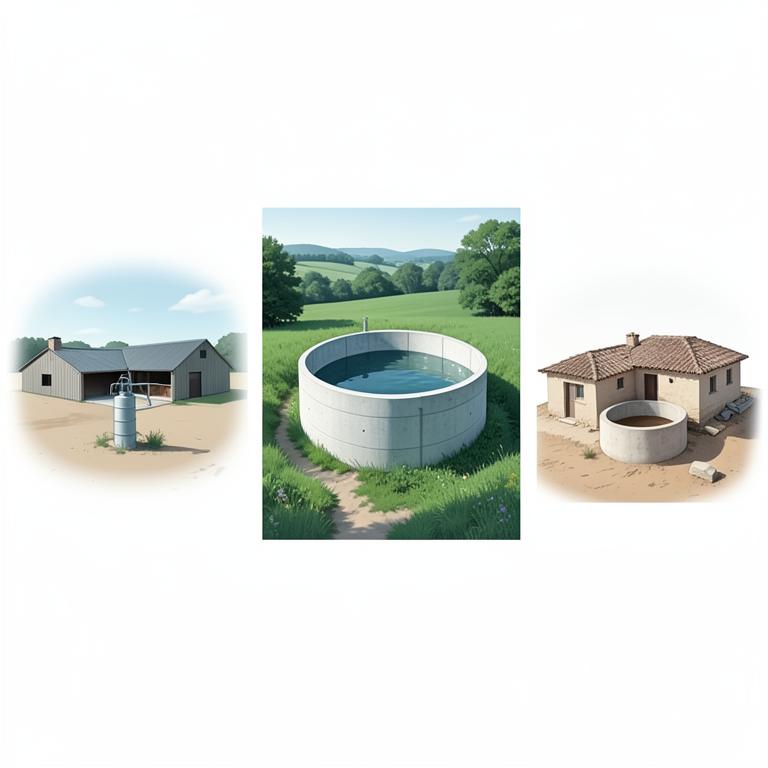
Market Participant Profiles
AI-generated conceptual illustration (Agricultural land and groundwater wells in the dry zone of Karnataka). It explains the idea and does not show study data.
View source evidence ↗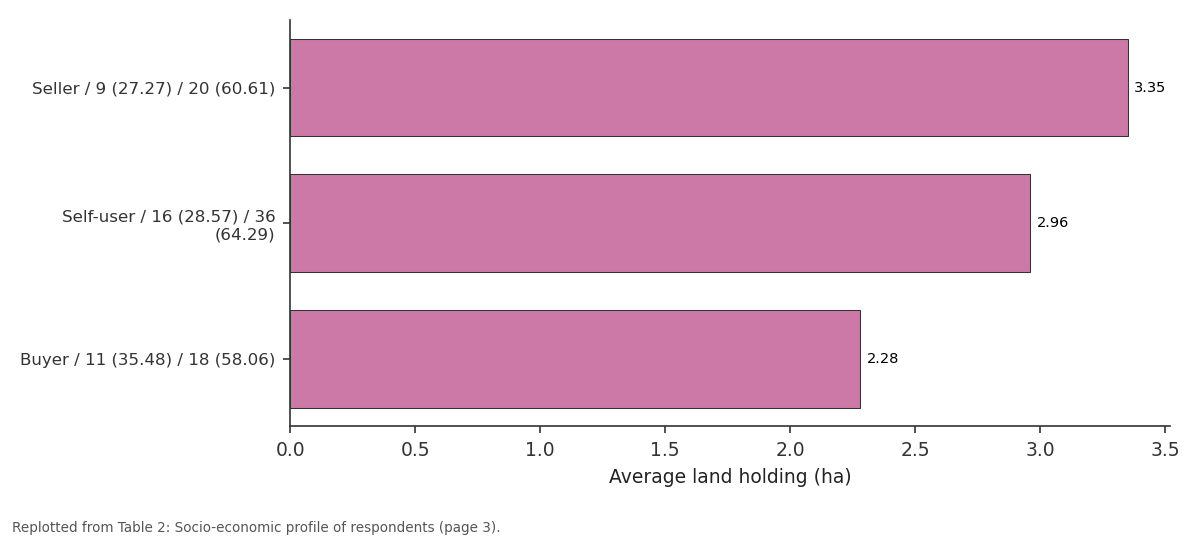
Average land holding (ha): Seller / 9 (27.27) / 20... vs Self-user / 16 (28.57)... vs Buyer / 11 (35.48) / 18...
Replotted from Table 2 (page 3) of the original paper. Every bar is the paper's own table value.
View source evidence ↗Figures & tables
From the original paper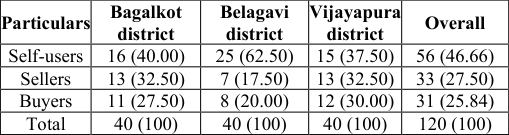 Table 1
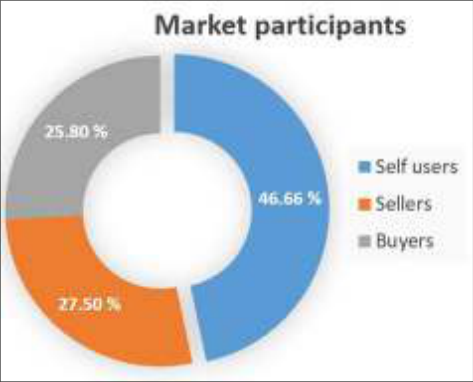 Figure 1
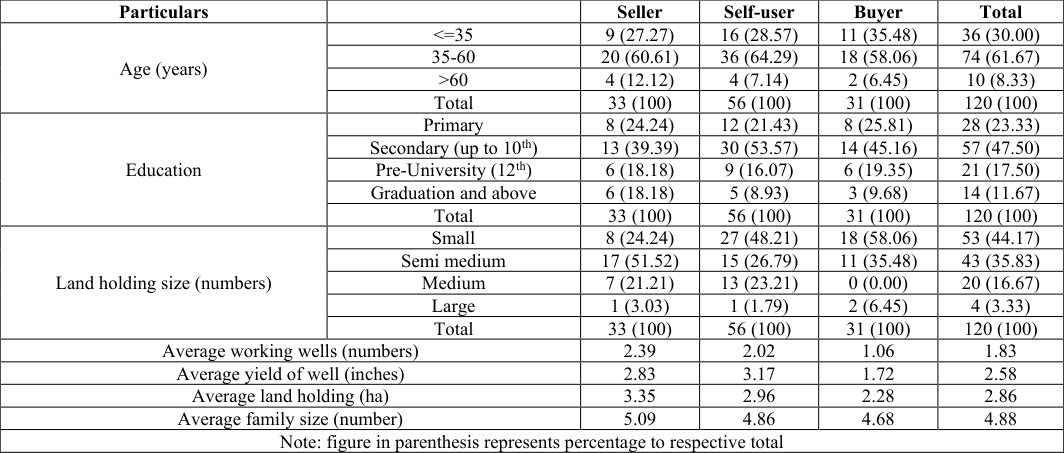 Table 2
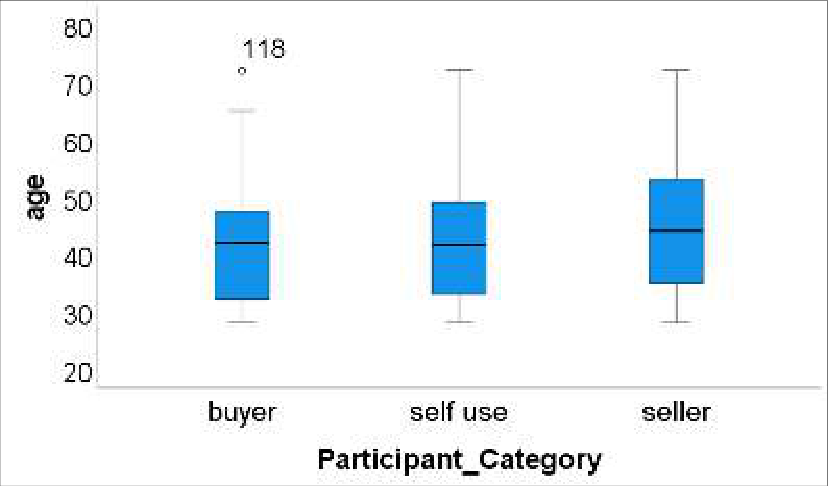 Figure 2
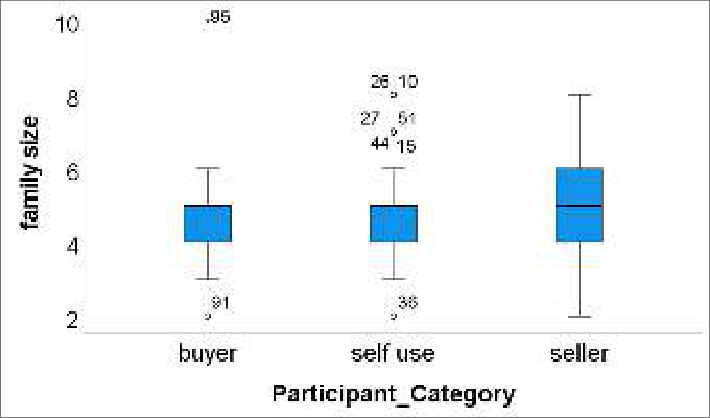 Figure 3
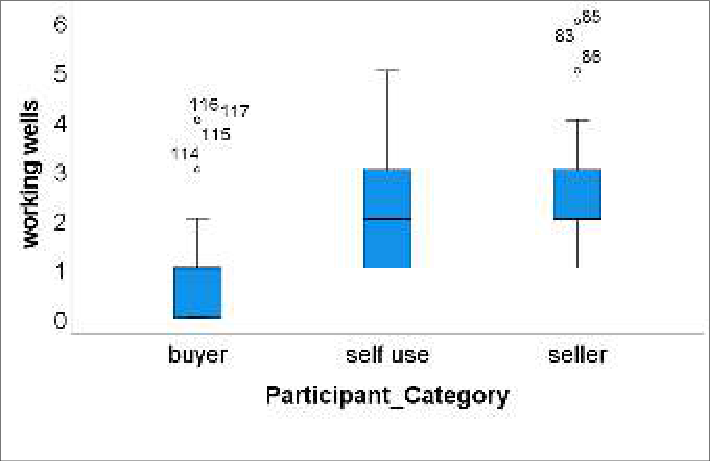 Figure 4
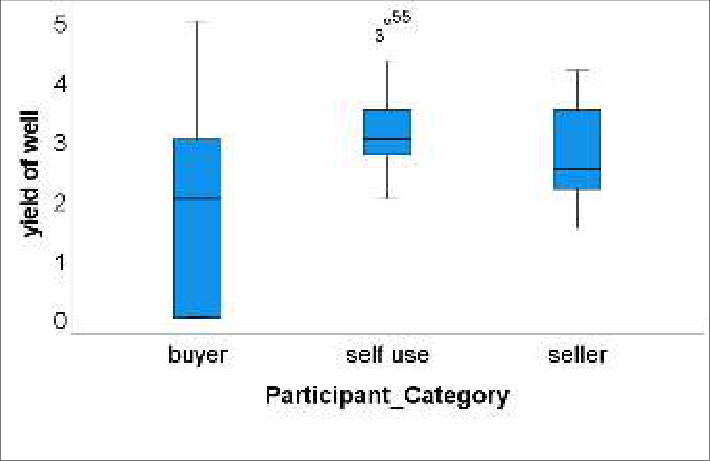 Figure 5
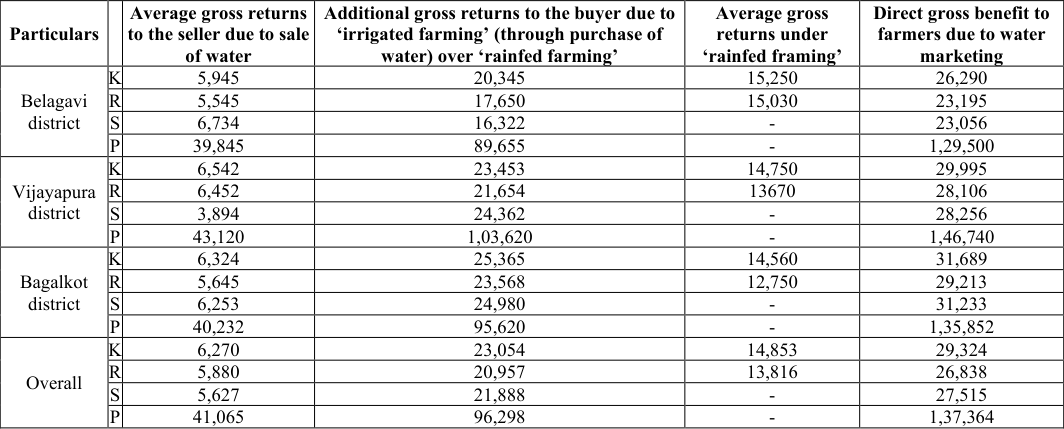 Table 3
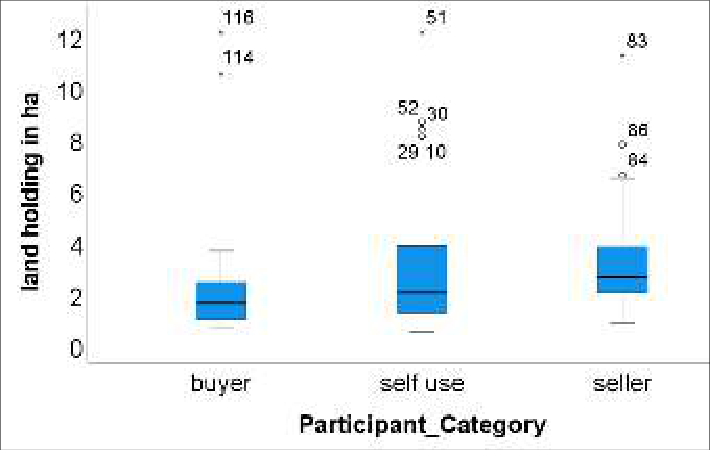 Figure 6
 Table 4
 Table 5
Introduction
Irrigation plays a critical role in Indian agriculture, where rainfall is often insufficient to meet crop water requirements. Out of the 139.42 million hectares of agricultural land in India, about 49.23 percent is irrigated, while the remaining 50.77 percent continues to depend on rainfall (Anonymous, 2020) [4] . Groundwater has emerged as the single largest source of irrigation, replacing canals that once dominated during the early years after independence. Today, India is regarded as the world's largest groundwater-based economy, largely because groundwater irrigation offers farmers greater flexibility, reliability, and year-round availability compared to canal systems. The expansion of groundwater irrigation significantly contributed to the Green Revolution during the 1970s, enabling multiple cropping and boosting food security (Kulkarni, 2015) [7] . However, this rapid growth has also raised concerns of overexploitation. Nearly 60 percent of districts in the country now show signs of groundwater depletion or contamination, or both (Kulkarni, 2015) [7] . In many regions, extraction has far exceeded natural recharge, leading to declining water tables, rising pumping costs, and widespread well failures. This problem is particularly severe in southern and western India, where rainfall variability further exacerbates groundwater scarcity. Several policy and socio-economic factors have encouraged indiscriminate extraction. Free or subsidized electricity for agriculture, coupled with water-intensive cropping patterns, have become major demand-side drivers of aquifer depletion (Srivastava, 2017) [12] . On the supply side, lack of regulation, absence of community-based groundwater management, and increasing density of borewells have worsened the crisis (Patel, 2020) [9] .
While private ownership of extraction machinery has allowed many farmers to secure water, it has also excluded small and marginal farmers who lack investment capacity (Ananda and Aheeyar, 2020) [3] . This has led to widening inequalities in access to irrigation and incomes. In this context, groundwater markets have emerged as an informal but vital institution. These markets allow farmers who own wells to sell water to others through local arrangements. Payments are made in cash, kind, or cropsharing contracts. Although informal and unregulated, groundwater markets promote equity and efficiency by providing access to irrigation for farmers who cannot afford their own wells (Saleth, 2014; Acharyya, 2016) [10,1] . In South Asia, such markets have contributed to food security and poverty reduction, with studies reporting that around 88 percent of pump owners in Bangladesh, 60 percent in Nepal, and 60 percent in West Bengal sell water to fellow farmers. In India, informal groundwater markets are widespread in states like Andhra Pradesh, Tamil Nadu, Gujarat, Uttar Pradesh, Punjab, and West Bengal. While these markets bring several advantages, including better utilization of pumping capacity and improved cropping intensity, they also carry risks. In the absence of effective institutional regulation, they may accelerate aquifer depletion, encourage monopoly rents for rich farmers, and create inequities between buyers and sellers (Varughese and Prasad, 2012; Mukherji, 2007) [13,8] . The Northern Dry Zone of Karnataka is highly dependent on groundwater for irrigation. With annual rainfall ranging from 464.5 mm to 785.7 mm, and 23.8 percent of taluks being over-exploiting the groundwater, the sustainability of groundwater use has become a pressing concern. In this context, the present study aims to analyze the economic impact of groundwater marketing, examine the factors influencing farmers' participation, and evaluate its overall contribution to irrigation access and profitability in the region.
Methodology
The study was conducted in the Northern Dry Zone of Karnataka, covering three districts namely, Belagavi, Bagalkot, and Vijayapura -which had the highest area under groundwater irrigation in the zone. From each district, two taluks were purposively selected based on high groundwater use and low rainfall. In total, 12 villages (2 from each taluk) were chosen, and 120 farmers were randomly selected from each village. Primary data were collected using a structured and pre-tested interview schedule through personal interviews. For analysis, descriptive statistics, percentage and ratio analysis were used. Gross benefits, additional income to buyers, and economic rents to sellers were calculated to measure the economic impact of groundwater markets. Distribution of socio-economic parameters was studied using box plot and outliers.
Results and Discussion 1. Participants of Groundwater Marketing
The structure of groundwater markets (Table 1) shows that out of 120 sample farmers, the self-users group was found to be the largest (46.66%), followed by sellers (27.50%) and buyers (25.84%). It indicates that almost half of the farmers depend only on their own groundwater resources for irrigation. These self-users were generally better-off farmers with larger landholdings and higher area under irrigation.
| Particulars | Bagalkot district | Belagavi district | Vijayapura district | Overall |
|---|---|---|---|---|
| Self-users | 16 (40.00) | 25 (62.50) | 15 (37.50) | 56 (46.66) |
| Sellers | 13 (32.50) | 7 (17.50) | 13 (32.50) | 33 (27.50) |
| Buyers | 11 (27.50) | 8 (20.00) | 12 (30.00) | 31 (25.84) |
| Total | 40 (100) | 40 (100) | 40 (100) | 120 (100) |
Table text extracted from the original PDF; superscript letters are shown inline. The original table image is below.
View original table image
Since their own requirements were high, they did not have surplus water to sell. The sellers group constituted the farmers who had functioning wells with adequate discharge (27.50%). They use part of the water for their own crops and sell the remaining water to other needy farmers. Selling water fetched them with an additional income and also ensured that their wells were used efficiently. Buyers group was of small and marginal farmers who did not own wells or whose wells had failed or did not have sufficient water from their own source. By purchasing water, they could grow irrigated crops instead of depending only on rainfed cultivation. Buyers group highlights the importance of groundwater markets in providing access to irrigation for resource-poor farmers. Similar patterns were also observed by Kannan et al. (2018) [6] , who reported that smallholders are more likely to be buyers, but even larger farmers sometimes participate as buyers when facing shortages. Thus, the composition of participants reflects the dual role of groundwater markets-providing additional income to well-owners and ensuring irrigation access to those without wells. The proportion of different market participants namely, self-users, sellers, buyers in the sample is shown in figure 1.
Socio-economic profile of respondents
The socio-economic profile of respondents (Table 2) shows that younger farmers (30%) were more often buyers, indicating their risk loving nature (ready to carryout farming even with weaker asset base and own irrigation water). Education levels were moderate, with most farmers having completed secondary schooling or matriculation (47.50%), and only around 11 percent attaining graduation and above; sellers were relatively better educated compared to buyers. Landholding distribution showed that small farmers (44.17%) and semi-medium farmers (35.83%) accounted for the majority, while medium (16.67%) and large farmers (3.33%) formed a small share. Among groups, buyers were mostly smallholders (58.06%), while sellers were concentrated in the semi-medium category (51.52%), reflecting that land size influences participation in groundwater markets. Resource disparities can be clearly seen from sellers having more working wells (2.39) and higher well yields (2.83 inches) compared to buyers, who had only 1.06 wells on average with low yield 1.72 inches. Similarly, sellers owned larger landholdings (3.35 ha) than buyers (2.28 ha). These results show that sellers are relatively better-off farmers with more assets and reliable wells, while buyers are resource-poor smallholders dependent on water markets to access irrigation. The box plots shown (Figure 2 to 6) depicts the distribution of socio-economic parameters of the sample respondents across different categories of market participants namely, buyer, seller, and self-user. From the figure it can be seen that buyer were relatively younger compared to others, seller had greater family size, sellers had greater number of working wells, and self-users had higher yield of wells when we consider distribution concentration rather than absolute maximum or minimum.
| Particulars | — | Seller | Self-user | Buyer | Total |
|---|---|---|---|---|---|
| Age (years) | <=35 | 9 (27.27) | 16 (28.57) | 11 (35.48) | 36 (30.00) |
| 35-60 | 20 (60.61) | 36 (64.29) | 18 (58.06) | 74 (61.67) | |
| >60 | 4 (12.12) | 4 (7.14) | 2 (6.45) | 10 (8.33) | |
| Total | 33 (100) | 56 (100) | 31 (100) | 120 (100) | |
| Education | Primary | 8 (24.24) | 12 (21.43) | 8 (25.81) | 28 (23.33) |
| Secondary (up to 10th) | 13 (39.39) | 30 (53.57) | 14 (45.16) | 57 (47.50) | |
| Pre-University (12th) | 6 (18.18) | 9 (16.07) | 6 (19.35) | 21 (17.50) | |
| Graduation and above | 6 (18.18) | 5 (8.93) | 3 (9.68) | 14 (11.67) | |
| Total | 33 (100) | 56 (100) | 31 (100) | 120 (100) | |
| Land holding size (numbers) | Small | 8 (24.24) | 27 (48.21) | 18 (58.06) | 53 (44.17) |
| Semi medium | 17 (51.52) | 15 (26.79) | 11 (35.48) | 43 (35.83) | |
| Medium | 7 (21.21) | 13 (23.21) | 0 (0.00) | 20 (16.67) | |
| Large | 1 (3.03) | 1 (1.79) | 2 (6.45) | 4 (3.33) | |
| Total | 33 (100) | 56 (100) | 31 (100) | 120 (100) | |
| Average working wells (numbers) | 2.39 | 2.02 | 1.06 | 1.83 | |
| Average yield of well (inches) | 2.83 | 3.17 | 1.72 | 2.58 | |
| Average land holding (ha) | 3.35 | 2.96 | 2.28 | 2.86 | |
| Average family size (number) | 5.09 | 4.86 | 4.68 | 4.88 | |
| Note: figure in parenthesis represents percentage to respective total |
Table text extracted from the original PDF; superscript letters are shown inline. The original table image is below.
View original table image
Direct Gross Benefits from Groundwater Marketing
The economic importance of groundwater markets is depicted in Table 3. The gross benefits were calculated as the sum of returns to sellers from water sales and additional returns to buyers from irrigated farming compared to rainfed farming. The results clearly show that perennial crops generated the highest gross benefit per hectare (₹1,37,364), followed by kharif crops (₹29,324), summer crops (₹27,515), and rabi crops (₹26,838). For sellers, the income came from either hourly water charges or crop-sharing arrangements. For buyers, the benefit was the increase in returns due to access to irrigation. Without water purchases, their cultivation would have been limited to rainfed crops, which fetched much lower returns. For example, in kharif season, average gross returns under rainfed farming were ₹14,853 per hectare, whereas irrigated farming through purchased water gave much higher additional revenue. Bruno and Sexton (2020) [5] also concluded that both buyers and sellers benefit overall from trade, even in situations of market power. These findings prove that groundwater markets not only provide monetary gains to sellers but also substantially raise the profitability of buyers. In fact, the availability of purchased water made it possible to cultivate summer and perennial crops, which otherwise would not be possible under rainfed conditions. Thus, groundwater markets play a direct role in increasing cropping intensity, crop diversification, and rural incomes.
| Particulars | — | Average gross returns to the seller due to sale of water | Additional gross returns to the buyer due to ‘irrigated farming’ (through purchase of water) over ‘rainfed farming’ | Average gross returns under ‘rainfed framing’ | Direct gross benefit to farmers due to water marketing |
|---|---|---|---|---|---|
| Belagavi district | K | 5,945 | 20,345 | 15,250 | 26,290 |
| R | 5,545 | 17,650 | 15,030 | 23,195 | |
| S | 6,734 | 16,322 | - | 23,056 | |
| P | 39,845 | 89,655 | - | 1,29,500 | |
| Vijayapura district | K | 6,542 | 23,453 | 14,750 | 29,995 |
| R | 6,452 | 21,654 | 13670 | 28,106 | |
| S | 3,894 | 24,362 | - | 28,256 | |
| P | 43,120 | 1,03,620 | - | 1,46,740 | |
| Bagalkot district | K | 6,324 | 25,365 | 14,560 | 31,689 |
| R | 5,645 | 23,568 | 12,750 | 29,213 | |
| S | 6,253 | 24,980 | - | 31,233 | |
| P | 40,232 | 95,620 | - | 1,35,852 | |
| Overall | K | 6,270 | 23,054 | 14,853 | 29,324 |
| R | 5,880 | 20,957 | 13,816 | 26,838 | |
| S | 5,627 | 21,888 | - | 27,515 | |
| P | 41,065 | 96,298 | - | 1,37,364 |
Table text extracted from the original PDF; superscript letters are shown inline. The original table image is below.
View original table image
Reasons for Non-Participation in Water Market
The reasons given by self-users for not participating in groundwater markets are shown in Table 4. The most important factor was insecurity with respect to groundwater resources (82.14%). Farmers feared that if they sold water, they might not have enough for their own crops in future seasons, especially with falling water tables. The second major reason was no surplus water to sell (75%). Many farmers reported that their wells only met their own farm requirements, leaving nothing extra to sell. A large share of farmers (62.5%) also reported that increasing area under high water-intensive (HWI) crops such as sugarcane reduced the possibility of surplus water for sale. Other reasons included depletion of the water table (57.14%), failure of wells (37.5%), and inadequate power supply (14.28%). A few farmers (12.5%) also mentioned lack of buyers in their area, though this was the least important factor. These findings also match with Acharyya (2019) [2] , who argued that water markets are a better option for reallocating scarce water, but their sustainability depends on local aquifer conditions. These responses show that water scarcity and uncertainty are the primary barriers to participation in water markets. Farmers prioritize their own irrigation needs, and only when surplus water is available, they consider selling.
| Particulars | Belagavi district | Vijayapura district | Bagalkot district | Overall |
|---|---|---|---|---|
| n = 25 | n = 15 | n = 16 | n = 56 | |
| Depletion of water table | 13 (52.00) | 9 (60.00) | 10 (62.50) | 32 (57.14) |
| No surplus water to sell | 16 (64.00) | 12 (80.00) | 14 (87.50) | 42 (75.00) |
| Insecurity with respect to groundwater resource | 22 (88.00) | 11 (73.33) | 13 (81.25) | 46 (82.14) |
| Inadequate power supply | 4 (16.00) | 1 (6.66) | 3 (18.75) | 8 (14.28) |
| Increase in area under HWI crops on own farm | 10 (40.00) | 13 (86.66) | 12 (75.00) | 35 (62.50) |
| Increase in failure of wells | 9 (36.00) | 4 (26.66) | 8 (50.00) | 21 (37.50) |
| No buyers of water from his source | 4 (16.00) | 1 (6.66) | 2 (12.50) | 7 (12.50) |
Table text extracted from the original PDF; superscript letters are shown inline. The original table image is below.
View original table image
Reasons for Participation of Sellers in Water Market
The motivations of sellers to participate in groundwater markets are presented in Table 5. The strongest factor was demand for water by neighbours (84.61%). This shows that water sales are often initiated when surrounding farmers approach well-owners for irrigation. The second important reason was surplus water availability (77.28%), indicating that some sellers had discharge in their wells beyond their own requirement. Additional income source (68.12%) was another key motivation, as selling water provided extra earnings without much additional investment. A moderate share of sellers (57.50%) cited security with respect to groundwater, meaning that selling ensured efficient use of their pumping capacity and prevented wastage. Social commitment (32.23%) was also reported, where farmers sold water to maintain good relations with their neighbors, sometimes even at concessional rates. Singh et al. (2007) [11] also reported that surplus water and the location of buyers' fields near wells influenced water sales. These findings indicate that groundwater markets in the region are largely demand-driven, where buyers' needs prompt sellers to participate. At the same time, the financial benefits and social obligations also encourage water sales.
| Particulars | Belagavi district | Vijayapura district | Bagalkot district | Overall |
|---|---|---|---|---|
| n = 7 | n =12 | n =12 | n = 33 | |
| Surplus water to sell | 6 (85.70) | 9 (76.92) | 8 (69.23) | 26 (77.28) |
| Additional income source | 3 (42.85) | 10 (84.61) | 9 (76.92) | 22 (68.12) |
| Security with respect to groundwater | 4 (57.14) | 7 (61.53) | 6 (53.84) | 19 (57.50) |
| Demand for water by neighbours | 7 (100.00) | 8 (69.23) | 10 (84.61) | 28 (84.61) |
| Social commitment | 3 (42.85) | 5 (38.46) | 2 (15.38) | 11 (32.23) |
Table text extracted from the original PDF; superscript letters are shown inline. The original table image is below.
View original table image
Conclusion
Groundwater markets have emerged as an informal but useful institution in Northern dry zone of Karnataka, giving access to irrigation for farmers who do not own wells and providing additional income to those who sell water. The gross benefits from water marketing were highest in perennial crops, followed by kharif, rabi, and summer crops, proving that irrigation access significantly increases farm profitability and enables crop diversification. However, they also put more pressure on already depleting aquifers. To make them sustainable, there is a need for effective management of groundwater through recharge structures, adoption of water-saving irrigation methods and regulation of borewell drilling. Community participation and awareness are equally important to ensure equitable sharing of groundwater. Thus, groundwater markets in the Northern Dry Zone of Karnataka represent both an opportunity and a challenge -an opportunity for enhancing agricultural production and profitability, and a challenge for long-term sustainability. Proper policies and collective efforts are essential to ensure that this vital resource continues to support farming communities in the future.
Figures and tables from the paper
References
13 in the original paper- Acharyya S. Groundwater markets in South Asia: A review of issues and evidence. Agric Econ Res Rev. 2016;29(2):183-92.
- Acharyya S. Water markets as a tool for reallocation of scarce water resources. J Rural Dev. 2019;38(3):42135.
- Ananda J, Aheeyar M. Groundwater governance in South Asia: Key issues and policy options. Water Policy. 2020;22(2):301-15.
- Anonymous. Agricultural statistics at a glance 2020. New Delhi: Ministry of Agriculture and Farmers Welfare, Government of India; 2020.
- Bruno E, Sexton RJ. Market power and water trading: Evidence and implications. Am J Agric Econ. 2020;102(1):253-72.
- Kannan K, Kumar M, Singh R. Determinants of participation in groundwater markets: Evidence from India. Indian J Agric Econ. 2018;73(1):105-19.
- Kulkarni H. Groundwater governance in India: Stumbling blocks and the way forward. Econ Polit Wkly. 2015;50(52):45-53.
- Mukherji A. The groundwater economy of South Asia: An assessment of size, significance and socioecological impacts. Water Policy. 2007;9(5):573-90.
- Patel A. Drivers of groundwater depletion in India: A policy perspective. J Water Resour Manag. 2020;34(9):2795-807.
- Saleth RM. Water markets in India: Economic and institutional aspects. In: Reddy VR, editor. Water pricing in India. New Delhi: Academic Foundation; 2014. p. 145-68.
- Singh R, Kumar MD, Narayanamoorthy A. Groundwater markets in India: A critical review. Indian J Agric Econ. 2007;62(2):155-71.
- Srivastava SK. Impact of energy subsidy withdrawal on groundwater use in agriculture. Agric Econ Res Rev. 2017;30(1):15-28.
- Varughese G, Prasad CS. Equity and efficiency in informal groundwater markets in India. Water Int. 2012;37(3):281-93.