
Research article · 2025 · Full text
International Journal of Agriculture and Food ScienceIntegrated Physiological Evaluation of Drought Tolerance in Soybean (Glycine max L. Merrill) Across Segregating Populations
Volume 7(9) · Pages 732–738 · DOI: 10.33545/2664844x.2025.v7.i9j.819 ↗
Research areasLung Cancer Treatments and MutationsCancer Genomics and DiagnosticsCancer-related Molecular Pathways
Abstract
Author-writtenDrought is one of the major constraints affecting soybean yield stability. This study evaluated drought-response variation by combining field phenotyping under restricted irrigation with analysis of segregating populations. A total of 248 segregants (F₃: 106; F₄: 142) from seven biparental crosses, along with 13 F₅ advanced lines, were assessed for canopy temperature (CT), chlorophyll content (SPAD), relative leaf water content (RWC), normalized difference vegetation index (NDVI), hundred-seed weight (HSW), and days to maturity. Results revealed substantial variation: several progenies showed transgressive segregation for NDVI, SPAD, and RWC.
Summary
Source-checkedPlain-language reading of the full paper, prepared with AI and checked against the text. Each point links to the authors' own words.
Why it matters
- Soybean is the most important oilseed crop globally due to its high economic, nutritional, and agricultural value. View evidence ↗
- Drought is the primary abiotic factor limiting soybean productivity, potentially causing yield losses of more than 40% in severe cases. View evidence ↗
- To stabilize yields, it is necessary to improve drought tolerance by identifying responsive genes and understanding physiological mechanisms like water-use efficiency and canopy cooling. View evidence ↗
The question
- The study aimed to evaluate how drought-response varies across segregating populations using field phenotyping under restricted irrigation. View evidence ↗
What they did
- The researchers evaluated 248 segregants from seven biparental crosses (106 in F₃ and 142 in F₄) and 13 advanced F₅ lines. View evidence ↗
- Six physiological parameters were measured: days to maturity, hundred-seed weight (HSW), chlorophyll content (SPAD), relative leaf water content (RWC), canopy temperature (CT), and the normalized difference vegetation index (NDVI). View evidence ↗
What they found
- In the F₃ generation of the KDS 1201 × EC 333901 cross, all segregants had lower canopy temperatures (mean 33.61 °C) than both parents (37.28 °C and 35.19 °C). View evidence ↗
What it means
- The authors concluded that the JS 20-98 × EC 602288 and JS 20-98 × TGX 709-50E crosses are the most promising for breeding drought-tolerant soybean. View evidence ↗
- The identified crosses provide valuable genetic resources for future breeding programs to enhance yield stability in water-limited environments. View evidence ↗
Visual summary
2 visualsIllustrations explain the paper; charts are replotted from the paper's own table values.
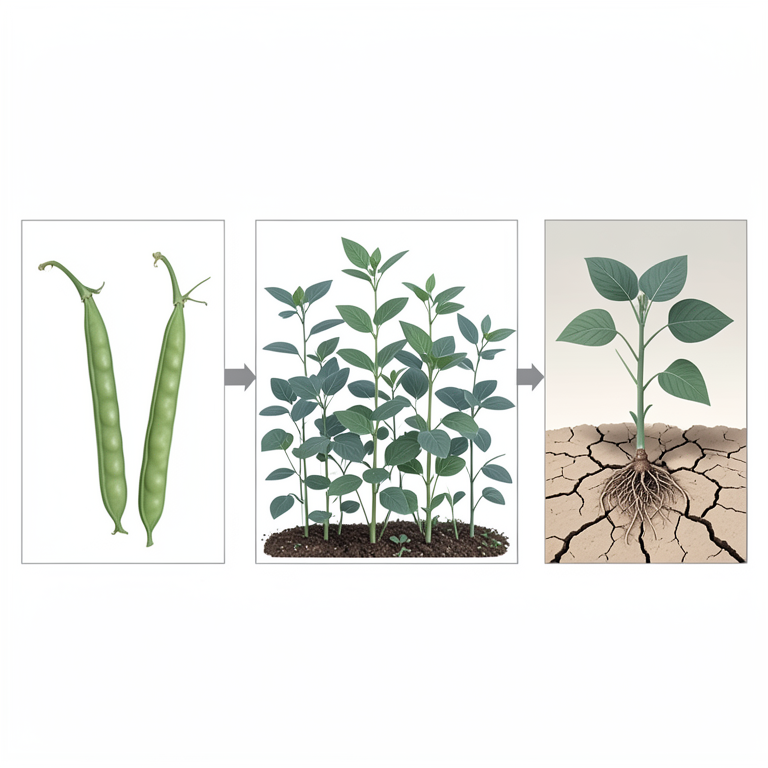
Drought Evaluation Framework
AI-generated conceptual illustration (soybean plants (Glycine max)). It explains the idea and does not show study data.
View source evidence ↗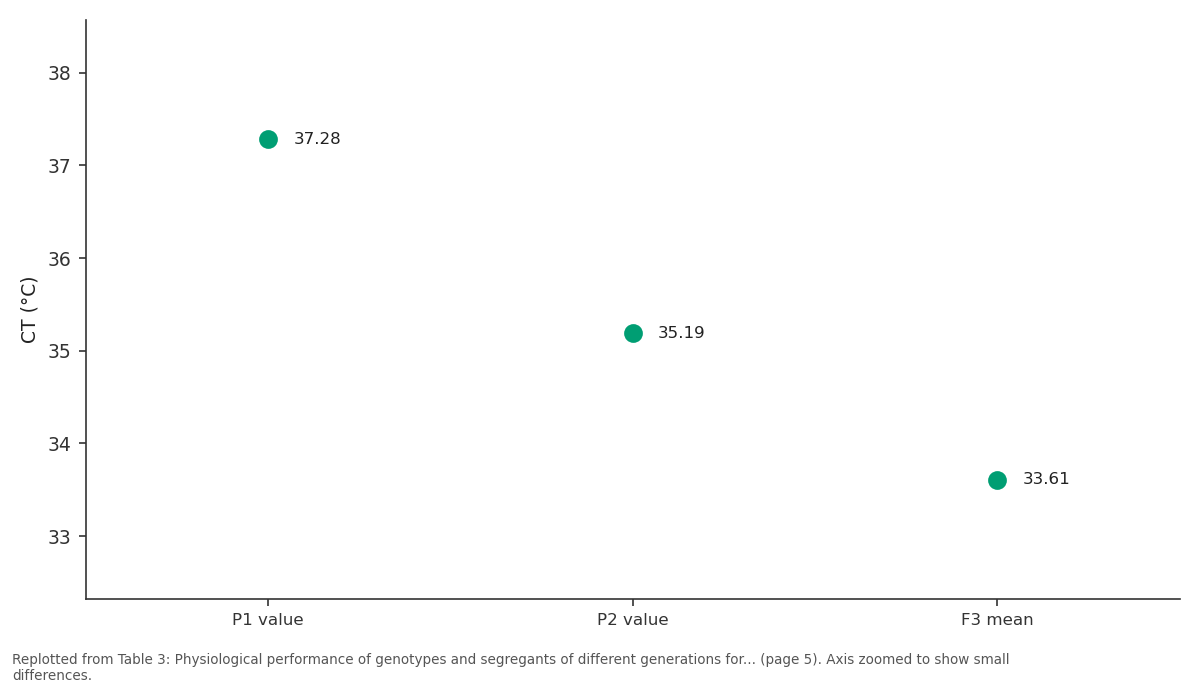
CT (°C): P1 value vs P2 value vs F3 mean
Replotted from Table 3 (page 5) of the original paper. Every bar is the paper's own table value.
View source evidence ↗Figures & tables
From the original paper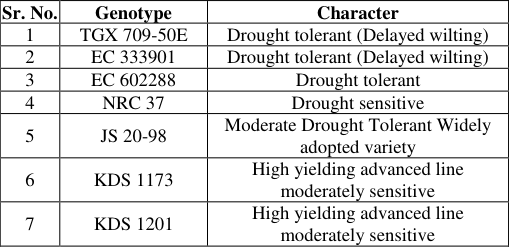 Table 1
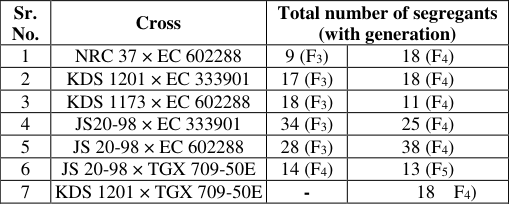 Table 2
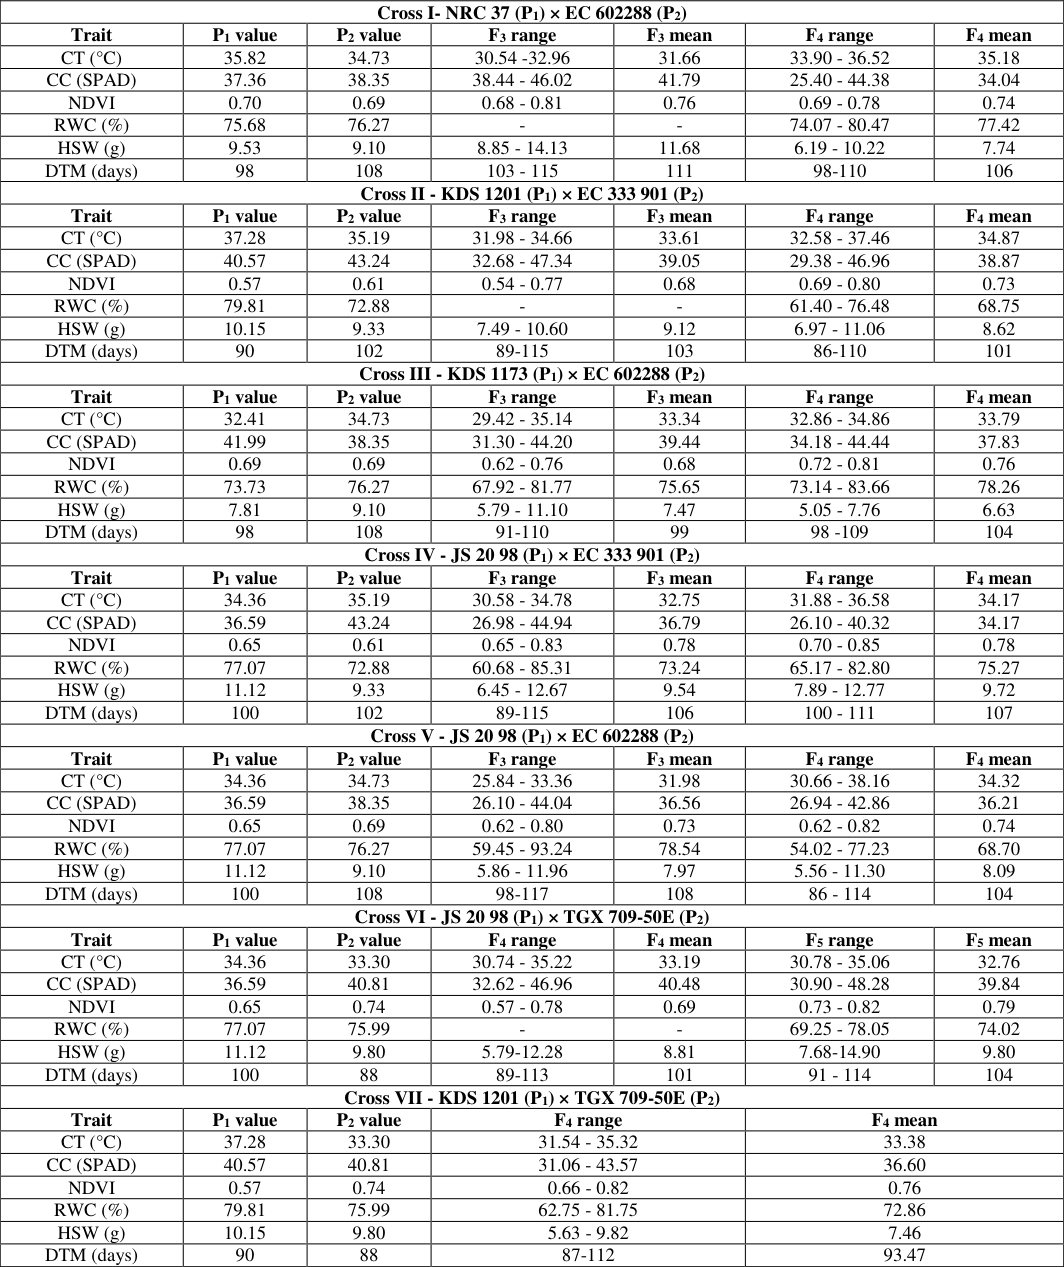 Table 3
Introduction
Soybean (Glycine max L. Merrill), a member of the Fabaceae family, is the world's foremost oilseed crop with high agricultural, nutritional, and economic value. It contains 36-40% protein with all essential amino acids, health-promoting unsaturated fatty acids, essential micronutrients, and bioactive compounds such as isoflavones and flavonoids that contribute to human health. Agronomically, soybean improves soil fertility through biological nitrogen fixation, reducing dependence on synthetic fertilizers, while industrially it serves as raw material for oils, paints, fibers, and other products. Globally, the United States, Brazil, Argentina, China, and India account for more than 90% of production (Rodríguez Navarro et al., 2010) [16] . In India, soybean covers over 118 lakh hectares with major cultivation in Madhya Pradesh, Maharashtra, and Rajasthan. In Maharashtra, it is primarily grown as a rainfed monsoon crop (Anonymous, 2023) [1] . Soybean is highly sensitive to water stress, and drought is the most critical abiotic factor limiting productivity, with yield losses exceeding 40% under severe conditions (Specht et al., 1999; Purcell and Specht, 2016) [19] . The severity of drought impact depends on genotype and stress timing-vegetative-stage drought reduces plant height, stress during flowering reduces seed number, and late stress decreases seed weight. Drought also impairs nitrogen fixation, reducing biomass allocation and yield. Improving drought tolerance in soybean is essential for yield stability. This requires identifying drought-responsive genes, understanding physiological mechanisms such as canopy cooling, water-use efficiency, and symbiotic nitrogen fixation, and applying molecular markers for efficient selection (Turner et al., 2001; Blum, 2009; Sinclair, 2018; Ye et al., 2018) [21,4,17,22] . Given climate change and increasing drought frequency, developing drought-resilient soybean cultivars is vital for food security and sustainable.
Materials and Methods
Materials and Methods
Study site
The experiment was conducted at the Botany Research Farm, Post Graduate Institute, MPKV, Rahuri, during the summer2024-25 season under restricted irrigation. The experiment was laid out under Randomized Block Design (RBD) with two replications under stress conditions. Sowing was done on 24 January 2025; total rainfall during the crop growth period was 4.4 mm.All necessary cultural practices were followed as recommended.
The experimental materials consisted of seven parental genotypes along with their segregants and advanced lines (Table No. 2.1). A total of 248 segregants from 7 crosses and 13 advanced F₅ lines were evaluated (Table No. 2
.2).
All the observations were recorded on five randomly selected plants in each replica. Plants were evaluated for six different physiological parameters viz. Days to maturity, Hundred-seed weight (HSW), Chlorophyll content (SPAD) using SPAD-502 meter (Markwell et al., 1995) [12] , Relative leaf water content (RWC) estimated using fresh, turgid, and dry weights, Canopy temperature (CT) recorded with an infrared thermometer (Guendouz et al., 2012) [6] , and NDVI calculated from reflectance values. For this study, an infrared thermometer (CT Gun) was employed to measure canopy temperature. A SPAD Meter was used to quantify the chlorophyll content. The canopy temperature depression (CTD) was subsequently calculated as the difference between the canopy temperature and the air temperature. All data was collected between 11:00 and 15:00 under bright sunlight. The Relative Water Content (RWC) of leaves was estimated as a percentage by measuring the fresh weight (FW), saturated weight (SW), and dry weight (DW) of leaf samples in grams and applying a given formula. [11] found that HSW of soybean decreases in drought stress. [5] increase in NDVI with higher shoot biomass is attributed to soybean's spectral response, where greater photosynthetically active biomass enhances NIR reflectance and reduces red reflectance. This shift, as noted by Smith et al. (2017) [18] , reflects higher chlorophyll content and overall biomass. [13] found that NDVI and root-to-shoot ratio (RSR) are primarily governed by additive × additive interactions, suggesting these key drought-related traits can be effectively selected in drought-tolerant × susceptible crosses, with minor dominance effects, suggesting its utility in enhancing drought tolerance through selection. HSW of P₁ was 11.12 g and P₂ 9.18 g. In F₃, values ranged from 5.86-11.96 g (mean 7.97 g). The 21 had lower HSW than both parents. In F₄, HSW ranged from 5.56-11.30 g (mean 7.74 g). Of 38 segregants 12 had lower HSW than P₂. The distribution indicates yield sensitivity under stress, with occasional transgressive segregants surpassing parents. P₁ matured in 100 days, while P₂ required 108 days. In F₃, segregants ranged from 98-117 days (mean 107.63). Six matured earlier than P₁ and 15 matured later than P₂. In F₄, maturity ranged from 86-114 days (mean 104 days). Nine matured before P₁ and 16 exceeded P₂. The observed spread suggests both early-and late-maturing lines may contribute to drought escape or extended seed-filling. The results highlight the potential to select for improved canopy temperature, NDVI, and SPAD, but also the challenges in maintaining RWC and HSW under stress. In cross VI (JS 20-98 × TGX 709-50E), the canopy temperature of JS 20-98 (P₁) was 34.36 °C, while TGX 709-50E (P₂) recorded 33.30 °C. In the F₄ generation, 14 segregants showed CT between 30.74 °C and 35.22 °C (mean 33.19 °C). The2 had more CT than P₁ and 5 were cooler than both parents. In advanced lines of F₅ generation, CT ranged from 30.78 °C to 35.06 °C (mean 32.76 °C). Of 13 segregants, 1 exceeded P₁, while 7 were cooler than P₂. The lower mean CT in F₅ suggests improved transpiration cooling and potential drought adaptation. NDVI values were 0.65 for P₁ and 0.74 for P₂. In F₄, segregants recorded values between 0.57 and 0.78 (mean 0.69). One fell below P₁ and 2 exceeded the parental range. In advanced lines of F₅ generation, NDVI improved, ranging from 0.73 to 0.82 (mean 0.79). Ten segregants surpassed P₂. Previously, [3] demonstrated that drought-tolerant soybean genotypes typically maintain higher NDVI values and exhibit superior canopy retention during mid-to-late reproductive stages. SPAD values were 36.59 for P₁ and 40.81 for P₂. The F₄ segregants ranged from 32.62-46.96 (mean 40.48). Two fell below P₁ and 8 exceeded both parents. In F₅, SPAD ranged from 30.90-48.28 (mean 39.84). Three segregants below P₁ and 7 surpassed both parents. The predominance of higher SPAD segregants indicates improved chlorophyll retention, a desirable trait for sustaining photosynthesis under drought. Parental values of RWC were 77.07% (P₁) and 75.99% (P₂). In F₅, segregants showed a range of 69.25-78.05% (mean 74.02%). One exceeded P₁, while 8 were lower than P₂. The improved mean RWC highlights the presence of individuals with superior water retention, beneficial for maintaining turgor under stress. HSW of P₁ recorded 11.12 g and P₂ 9.80 g. In F₄, HSW ranged from 5.79-12.28 g (mean 8.81 g). Two segregants exceeded HSW than P₁ and 7 were below P₂.
Bendig et al. (2019)
Similarly in Hauser et al. (2025) [7] individual seed weight decreased with increasing temperature. In advanced lines of F₅ generation, values extended from 7.68-14.90 g (mean 9.80 g). One exceeded P₁ and 4 fell below P₂. The wider distribution and higher extremes in F₅ indicate transgressive segregation and potential for yield improvement. JS 20-98 (P₁) matured in 100 days, while TGX 709-50E (P₂) matured in 88 days. In F₄, maturity ranged 89-113 days (mean 101 days). Six segregants matured after P1. In advanced lines of F₅ generation, maturity extended to 91-114 days (mean 104 days). Twelve segregants took more time than both parents to get matured. The shift toward later maturity in advanced lines may indicate drought escape mechanisms through prolonged seed filling. The presence of segregants exceeding parental values for traits like SPAD, NDVI, HSW, and maturity in later generations (F₄ and F₅) demonstrates successful genetic recombination. In cross VII (KDS 1201× TGX 709-50E), the canopy temperature of KDS 1201 (P₁) was 37.28°C, while TGX 709-50E (P₂) recorded 33.30°C. The F₄ segregants exhibited CT values ranging from 31.54°C to 35.32°C (mean 33.38°C). Among them 8 were cooler than P₂. The predominance of lower CT segregants suggests inheritance of thermal regulation traits under stress. NDVI values were 0.57 in KDS 1201 (P₁) and 0.74 in TGX 709-50E (P₂). The F₄ population ranged from 0.66 to 0.82, with a mean of 0.76. Nine segregants had exceeded NDVI than P₂. The majority of lines showed transgressive segregation with enhanced NDVI, indicating improved canopy vigour and photosynthetic performance under drought stress. Chlorophyll content was 40.57 SPAD in P₁ and 40.81 SPAD in P₂. The F₄ segregants varied between 31.06 and 43.57 SPAD (mean 36.60). The14 segregants displayed lower value of SPAD. Despite reduced chlorophyll in several segregants, the presence of individuals with superior retention reflects differential expression of photosynthetic traits under stress. RWC was 79.81% in P₁ and 75.99% in P₂. F₄ segregants ranged from 62.75% to 81.75%, with a mean of 72.86%. The9 segregants recorded lower values than both parents. Tiwari et al. (2021) [20] also conducted generation mean analysis to assess the genetic architecture of RLWC in soybean. Their results revealed a predominance of additive gene effects with relatively minor contributions from dominance effects. These findings indicate that genetic gain for RLWC can be effectively achieved through selection in early segregating generations. HSW of P₁ recorded 10.15 g and P₂ 9.80 g. In the F₄ generation, HSW ranged between 5.63 g and 9.82 g (mean 7.46 g). The 16 were below both parents. The reduction in seed weight highlights drought-induced constraints on seed filling, though a subset-maintained parent-comparable performance. Maturity was 90 days for P₁ and 88 days for P₂. The F₄ segregants matured within 87-112 days (mean 93 days). Two matured earlier than both parents (87 days), while 8 exceeded P₁, maturing later than 90 days. The extended maturity duration in several lines may indicate drought escape strategies or genotypic variation for phenological plasticity. The results highlight both favorable transgressive segregation for certain traits and negative impacts of drought stress on others. Overall impact: The presence of transgressive segregants for RWC, SPAD, and NDVI highlights the potential of recombination to generate superior drought-tolerant phenotypes.
Hundred Seed Weight (HSW):
The cross JS 20-98 × TGX 709-50E showed the highest seed weight in advanced generation (up to 14.90 g), outperforming both parents, indicating strong potential for yield stability under stress.
Days to Maturity (DTM):
The cross KDS 1201 × TGX 709-50E produced segregants maturing as early as 87 days, suggesting drought escape potential, while other crosses such as JS 20-98 × EC 602288 generated lines with delayed maturity (up to 117 days), useful for prolonged seed filling.
Overall, the crosses JS 20-98 × EC 602288 and JS 20-98 × TGX 709-50E emerged as the most promising, contributing superior segregants across multiple traits, particularly for cooler canopy temperature, higher RWC, greater seed weight, and extended photosynthetic efficiency. These cross offer valuable genetic resources for breeding droughttolerant soybean cultivars and can be utilized in future breeding pipelines aimed at enhancing yield stability under water-limited environments.
Acknowledgement
AcknowledgementWe are very thankful to the Post Graduate Institute and State Level Biotechnology Centre, MPKV, Rahuri, for providing all Facilities and research grants to carry out this research work and to the authors cited in reference for providing necessary literature.
Figures and tables from the paper
| Sr. No. | Genotype | Character |
|---|---|---|
| 1 | TGX 709-50E | Drought tolerant (Delayed wilting) |
| 2 | EC 333901 | Drought tolerant (Delayed wilting) |
| 3 | EC 602288 | Drought tolerant |
| 4 | NRC 37 | Drought sensitive |
| 5 | JS 20-98 | Moderate Drought Tolerant Widely adopted variety |
| 6 | KDS 1173 | High yielding advanced line moderately sensitive |
| 7 | KDS 1201 | High yielding advanced line moderately sensitive |
Table text extracted from the original PDF; superscript letters are shown inline. The original table image is below.
View original table image
| Sr. No. | Cross | Total number of segregants (with generation) | — |
|---|---|---|---|
| 1 | NRC 37 × EC 602288 | 9 (F3) | 18 (F4) |
| 2 | KDS 1201 × EC 333901 | 17 (F3) | 18 (F4) |
| 3 | KDS 1173 × EC 602288 | 18 (F3) | 11 (F4) |
| 4 | JS20-98 × EC 333901 | 34 (F3) | 25 (F4) |
| 5 | JS 20-98 × EC 602288 | 28 (F3) | 38 (F4) |
| 6 | JS 20-98 × TGX 709-50E | 14 (F4) | 13 (F5) |
| 7 | KDS 1201 × TGX 709-50E | - | 18 F4) |
Table text extracted from the original PDF; superscript letters are shown inline. The original table image is below.
View original table image
| Cross I- NRC 37 (P1) × EC 602288 (P2) | — | — | — | — | — | — |
|---|---|---|---|---|---|---|
| Trait | P1 value | P2 value | F3 range | F3 mean | F4 range | F4 mean |
| CT (°C) | 35.82 | 34.73 | 30.54 -32.96 | 31.66 | 33.90 - 36.52 | 35.18 |
| CC (SPAD) | 37.36 | 38.35 | 38.44 - 46.02 | 41.79 | 25.40 - 44.38 | 34.04 |
| NDVI | 0.70 | 0.69 | 0.68 - 0.81 | 0.76 | 0.69 - 0.78 | 0.74 |
| RWC (%) | 75.68 | 76.27 | - | - | 74.07 - 80.47 | 77.42 |
| HSW (g) | 9.53 | 9.10 | 8.85 - 14.13 | 11.68 | 6.19 - 10.22 | 7.74 |
| DTM (days) | 98 | 108 | 103 - 115 | 111 | 98-110 | 106 |
| Cross II - KDS 1201 (P1) × EC 333 901 (P2) | ||||||
| Trait | P1 value | P2 value | F3 range | F3 mean | F4 range | F4 mean |
| CT (°C) | 37.28 | 35.19 | 31.98 - 34.66 | 33.61 | 32.58 - 37.46 | 34.87 |
| CC (SPAD) | 40.57 | 43.24 | 32.68 - 47.34 | 39.05 | 29.38 - 46.96 | 38.87 |
| NDVI | 0.57 | 0.61 | 0.54 - 0.77 | 0.68 | 0.69 - 0.80 | 0.73 |
| RWC (%) | 79.81 | 72.88 | - | - | 61.40 - 76.48 | 68.75 |
| HSW (g) | 10.15 | 9.33 | 7.49 - 10.60 | 9.12 | 6.97 - 11.06 | 8.62 |
| DTM (days) | 90 | 102 | 89-115 | 103 | 86-110 | 101 |
| Cross III - KDS 1173 (P1) × EC 602288 (P2) | ||||||
| Trait | P1 value | P2 value | F3 range | F3 mean | F4 range | F4 mean |
| CT (°C) | 32.41 | 34.73 | 29.42 - 35.14 | 33.34 | 32.86 - 34.86 | 33.79 |
| CC (SPAD) | 41.99 | 38.35 | 31.30 - 44.20 | 39.44 | 34.18 - 44.44 | 37.83 |
| NDVI | 0.69 | 0.69 | 0.62 - 0.76 | 0.68 | 0.72 - 0.81 | 0.76 |
| RWC (%) | 73.73 | 76.27 | 67.92 - 81.77 | 75.65 | 73.14 - 83.66 | 78.26 |
| HSW (g) | 7.81 | 9.10 | 5.79 - 11.10 | 7.47 | 5.05 - 7.76 | 6.63 |
| DTM (days) | 98 | 108 | 91-110 | 99 | 98 -109 | 104 |
| Cross IV - JS 20 98 (P1) × EC 333 901 (P2) | ||||||
| Trait | P1 value | P2 value | F3 range | F3 mean | F4 range | F4 mean |
| CT (°C) | 34.36 | 35.19 | 30.58 - 34.78 | 32.75 | 31.88 - 36.58 | 34.17 |
| CC (SPAD) | 36.59 | 43.24 | 26.98 - 44.94 | 36.79 | 26.10 - 40.32 | 34.17 |
| NDVI | 0.65 | 0.61 | 0.65 - 0.83 | 0.78 | 0.70 - 0.85 | 0.78 |
| RWC (%) | 77.07 | 72.88 | 60.68 - 85.31 | 73.24 | 65.17 - 82.80 | 75.27 |
| HSW (g) | 11.12 | 9.33 | 6.45 - 12.67 | 9.54 | 7.89 - 12.77 | 9.72 |
| DTM (days) | 100 | 102 | 89-115 | 106 | 100 - 111 | 107 |
| Cross V - JS 20 98 (P1) × EC 602288 (P2) | ||||||
| Trait | P1 value | P2 value | F3 range | F3 mean | F4 range | F4 mean |
| CT (°C) | 34.36 | 34.73 | 25.84 - 33.36 | 31.98 | 30.66 - 38.16 | 34.32 |
| CC (SPAD) | 36.59 | 38.35 | 26.10 - 44.04 | 36.56 | 26.94 - 42.86 | 36.21 |
| NDVI | 0.65 | 0.69 | 0.62 - 0.80 | 0.73 | 0.62 - 0.82 | 0.74 |
| RWC (%) | 77.07 | 76.27 | 59.45 - 93.24 | 78.54 | 54.02 - 77.23 | 68.70 |
| HSW (g) | 11.12 | 9.10 | 5.86 - 11.96 | 7.97 | 5.56 - 11.30 | 8.09 |
| DTM (days) | 100 | 108 | 98-117 | 108 | 86 - 114 | 104 |
| Cross VI - JS 20 98 (P1) × TGX 709-50E (P2) | ||||||
| Trait | P1 value | P2 value | F4 range | F4 mean | F5 range | F5 mean |
| CT (°C) | 34.36 | 33.30 | 30.74 - 35.22 | 33.19 | 30.78 - 35.06 | 32.76 |
| CC (SPAD) | 36.59 | 40.81 | 32.62 - 46.96 | 40.48 | 30.90 - 48.28 | 39.84 |
| NDVI | 0.65 | 0.74 | 0.57 - 0.78 | 0.69 | 0.73 - 0.82 | 0.79 |
| RWC (%) | 77.07 | 75.99 | - | - | 69.25 - 78.05 | 74.02 |
| HSW (g) | 11.12 | 9.80 | 5.79-12.28 | 8.81 | 7.68-14.90 | 9.80 |
| DTM (days) | 100 | 88 | 89-113 | 101 | 91 - 114 | 104 |
| Cross VII - KDS 1201 (P1) × TGX 709-50E (P2) | ||||||
| Trait | P1 value | P2 value | F4 range | F4 mean | ||
| CT (°C) | 37.28 | 33.30 | 31.54 - 35.32 | 33.38 | ||
| CC (SPAD) | 40.57 | 40.81 | 31.06 - 43.57 | 36.60 | ||
| NDVI | 0.57 | 0.74 | 0.66 - 0.82 | 0.76 | ||
| RWC (%) | 79.81 | 75.99 | 62.75 - 81.75 | 72.86 | ||
| HSW (g) | 10.15 | 9.80 | 5.63 - 9.82 | 7.46 | ||
| DTM (days) | 90 | 88 | 87-112 | 93.47 |
Table text extracted from the original PDF; superscript letters are shown inline. The original table image is below.
View original table image
References
22 in the original paper- Anonymous. Soybean hectares planted. The Soybean Processors Association of India (SOPA). 2023. Available from: https://www.sopa.org/statistics/soybean-hectaresplanted/
- Bazzer SK, Purcell LC. Identification of quantitative trait loci associated with canopy temperature in soybean. Sci Rep. 2020;10(1):17604.
- Bendig J, Yu K, Aasen H, Bolten A, Bennertz S, Broscheit J, et al. UAV-based phenotyping of NDVI under drought in soybean. Remote Sens. 2019;11(6):709.
- Blum A. Effective use of water (EUW) and not wateruse efficiency (WUE) is the target of crop yield improvement under drought stress. Field Crops Res. 2009;112(2-3):119-23.
- Farias GD, Bremm C, Bredemeier C, de Lima Menezes J, Alves LA, Tiecher T, et al. Normalized difference vegetation index (NDVI) for soybean biomass and nutrient uptake estimation in response to production systems and fertilization strategies. Front Sustain Food Syst. 2023;6:959681.
- Guendouz A, Guessoum S, Maamari K, Hafsi M. The effect of supplementary irrigation on grain yield, yield components and some morphological traits of durum wheat (Triticum durum Desf.) cultivars. Adv Environ Biol. 2012;6(2):564-72.
- Hauser BA, Wang YY, Boote KJ, Chaturvedi P, McLamore ES, Allen LH Jr. Soybean reproductive traits evaluated in response to temperature stress and elevated oxygen; three peroxidase transgenes reduce seed abortion. Oxygen. 2025;5(2):5.
- Jones SE, Ayanlade TT, Fallen B, Jubery TZ, Singh A, Ganapathysubramanian B, et al. Multi-sensor and multi-temporal high-throughput phenotyping for monitoring and early detection of water-limiting stress in soybean. Plant Phenome J. 2024;7(1):e70009.
- Khan AZ, Shah P, Khan H, Nigar S, Perveen S, Shah MK, et al. Seed quality and vigor of soybean cultivars as influenced by canopy temperature. Pak J Bot. 2011;43(1):642-8.
- Kumar D, Karuppanapandian T, Rajendran K, Sudhakar D, Kumari S, Saravanan M, et al. Nutritional improvement of soybean through breeding and biotechnological interventions. Legume Res. 2020;43(4):457-64.
- Kumar M, Govindasamy V, Rane J, Singh AK, Choudhary RL, Raina SK, et al. Canopy temperature depression (CTD) and canopy greenness associated with variation in seed yield of soybean genotypes grown in semi-arid environment. S Afr J Bot. 2017;113:230-8.
- Markwell J, Osterman JC, Mitchell JL. Calibration of the Minolta SPAD-502 leaf chlorophyll meter. Photosynth Res. 1995;46(3):467-72.
- Nataraj MW, Gawande ND, Pacharne SS, Borse PR. Generation mean analysis of physiological traits under water stress. Legume Res. 2020;43(2):254-60.
- Patil RS, More RD, Vichare DS, Patil SB. Genetic analysis of drought tolerance traits using generation mean analysis in soybean. Legume Genomics. 2013;4(1):14-9.
- Purcell LC, Specht JE. Physiological traits for ameliorating drought stress. In: Agronomy Monograph. Agronomy; 2016. p. 569-620.
- Rodríguez-Navarro DN, Margaret-Oliver I, Contreras M, Ruiz-Sainz JE. Soybean interactions with soil microbes, agronomical and molecular aspects. Agron Sustain Dev. 2010;31(1):173-90.
- Sinclair TR. Effective water use required for improving crop growth rather than transpiration efficiency. Front Plant Sci. 2018;9:1442.
- Smith HL, McAusland L, Murchie EH. Don't ignore the green light: exploring diverse roles in plant processes. J Exp Bot. 2017;68(9):2099-111.
- Specht JE, Hume DJ, Kumudini SV. Soybean yield potential-A genetic and physiological perspective. Crop Sci. 1999;39(6):1560-70.
- Tiwari S, Pathak D, Mishra R. Chlorophyll content and photosynthesis rate as markers for drought tolerance in soybean. Photosynthetica. 2021;59(4):945-53.
- Turner NC, Wright GC, Siddique KHM. Adaptation of grain legumes (pulses) to water-limited environments. In: Sparks DL, editor. Adv Agron. 2001;71:193-231.
- Ye H, Roorkiwal M, Valliyodan B, Zhou L, Chen P, Varshney RK, et al. Genetic diversity of root system architecture in response to drought stress in grain legumes. J Exp Bot. 2018;69(13):3267-77.