
Research article · 2025 · Full text
International Journal of Agriculture and Food ScienceTrait Association and Path Analysis for Grain Yield and Yield Related in Pearl Millet [Pennisetum Glaucum (L.) R. Br.]
Volume 7(9) · Pages 715–719 · DOI: 10.33545/2664844x.2025.v7.i9j.815 ↗
Research areasGenomics and Phylogenetic StudiesMicrobial Community Ecology and PhysiologyCell Image Analysis Techniques
Abstract
Author-writtenPearl millet is a highly nutritious cereal rich in essential micronutrients like iron and zinc, making it an important crop to combat malnutrition and hidden hunger as well as it has climate-resilient property. Thus, a field experiment comprised of 120 genotypes of pearl millet was carried out using the randomized block design with two replications at Pearl Millet Research Station, Junagadh Agricultural University, Jamnagar during Summer, 2023. The results revealed that grain yield per plant showed significant and positive correlation with ear head diameter, ear head weight, test weight and harvest index at both genotypic and phenotypic levels. The phenotypic path analysis revealed that ear head weight and panicle index exhibited the most substantial direct effects on grain yield per plant across and also low residual values were also observed.
Summary
Source-checkedPlain-language reading of the full paper, prepared with AI and checked against the text. Each point links to the authors' own words.
Why it matters
- Pearl millet is a climate-resilient crop that is important for fighting malnutrition and hidden hunger because it is rich in essential micronutrients such as zinc and iron. View evidence ↗
- Because environmental conditions make direct selection for grain yield unreliable, it is necessary to identify specific character traits that influence yield. View evidence ↗
The question
- The study aims to determine effective selection criteria to enhance the yield potential of pearl millet. View evidence ↗
What they did
- The researchers conducted a field experiment in Summer 2023 at the Pearl Millet Research Station in Jamnagar, using 120 pearl millet genotypes in a randomized block design with two replications. View evidence ↗
- The study measured grain yield per plant along with several component traits, including plant height, ear head weight, ear head diameter, test weight, and harvest index. View evidence ↗
- Statistical analysis was performed using R-Studio software to calculate genotypic and phenotypic correlation coefficients and path analysis. View evidence ↗
What they found
- Ear head weight showed a very strong, positive, and highly significant correlation with grain yield per plant at both genotypic (rg = 0.9680) and phenotypic (rp = 0.9000) levels. View evidence ↗
- Test weight was positively and highly significantly correlated with grain yield at both the genotypic (rg = 0.4045) and phenotypic (rp = 0.3332) levels. View evidence ↗
- Harvest index showed a positive and highly significant correlation with grain yield per plant at both genotypic (rg = 0.2796) and phenotypic (rp = 0.3125) levels. View evidence ↗
- Ear head diameter was positively and highly significantly correlated with grain yield per plant at both genotypic (rg = 0.3672) and phenotypic (rp = 0.3443) levels. View evidence ↗
- Days to maturity had a significant negative association with grain yield per plant at both genotypic (rg = -0.2525) and phenotypic (rp = -0.2166) levels. View evidence ↗
- The residual effect of 0.0170 from the phenotypic path analysis suggests that the traits studied were sufficient to explain the variability in grain yield per plant. View evidence ↗
What it means
- The authors conclude that ear head weight is the key selection criterion for improving yield because it has the highest direct effect and the strongest positive correlation with grain yield. View evidence ↗
- The authors recommend using ear head weight, supported by panicle index, test weight, harvest index, and fodder yield, as the basis for selection strategies to improve grain productivity and dual-purpose efficiency. View evidence ↗
Visual summary
2 visualsIllustrations explain the paper; charts are replotted from the paper's own table values.
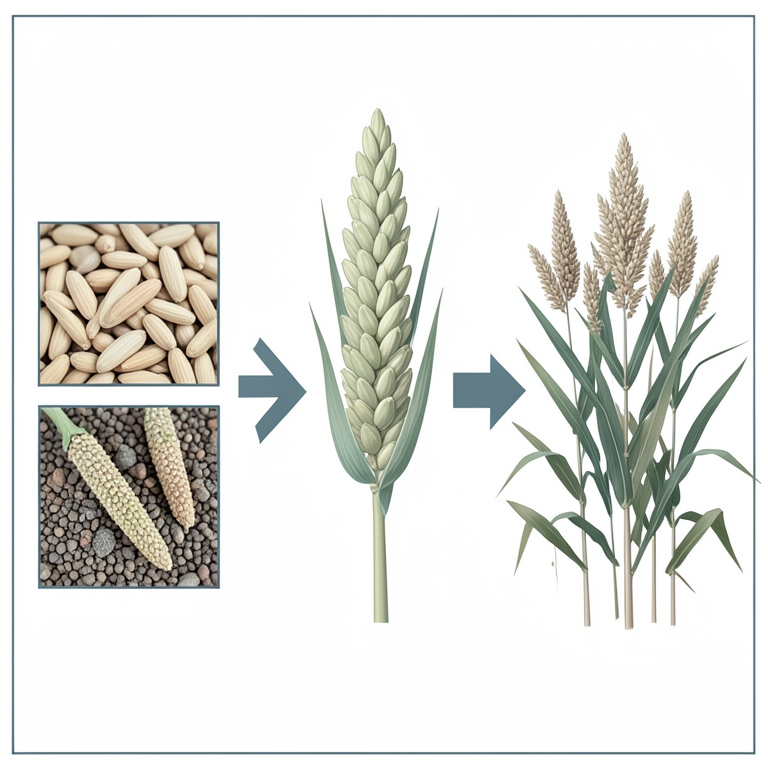
Direct vs Indirect Effects on Yield
AI-generated conceptual illustration (pearl millet plants (Pennisetum glaucum)). It explains the idea and does not show study data.
View source evidence ↗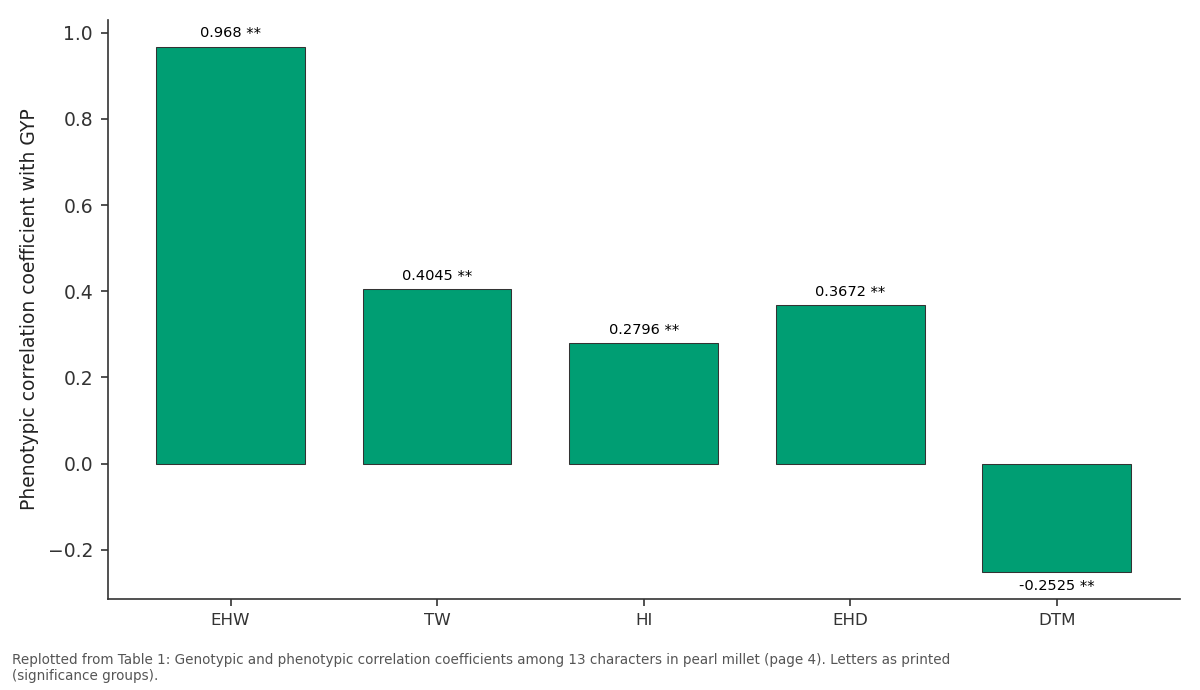
GYP: EHW vs TW vs HI vs EHD vs DTM
Replotted from Table 1 (page 4) of the original paper. Every bar is the paper's own table value.
View source evidence ↗Figures & tables
From the original paper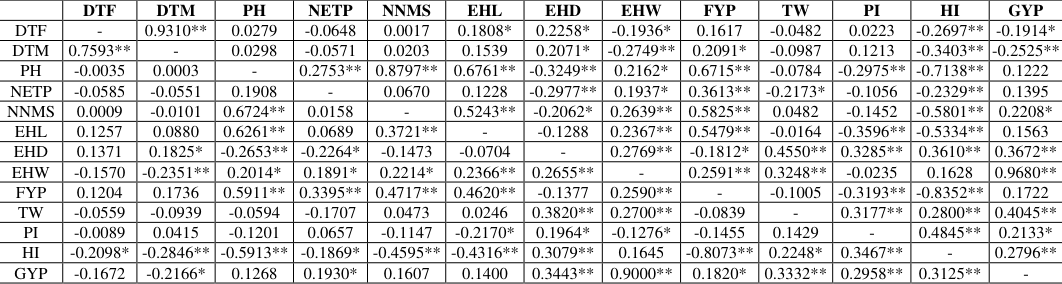 Table 1
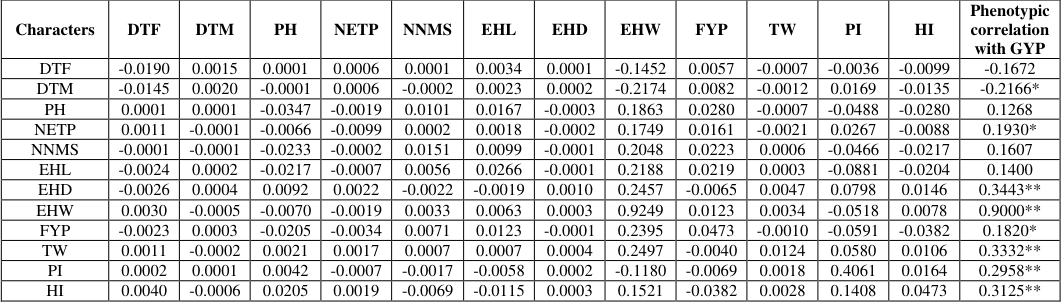 Table 2
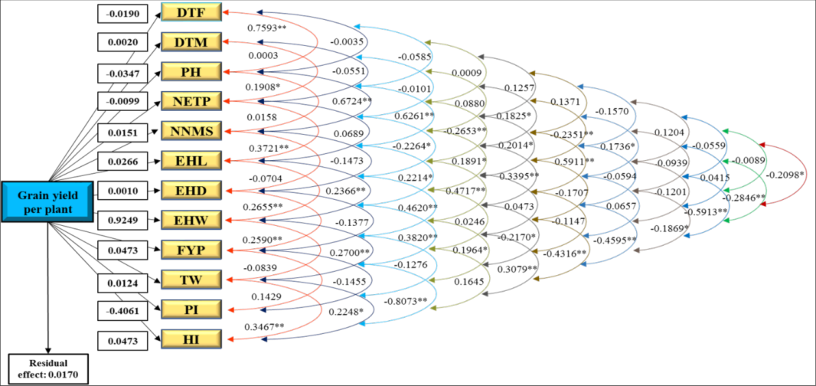 Figure 1
Introduction
Millets are small seeded grains of the grass family, grown in semi-arid climatic zones of the world. For millennia, they have been staple traditional food in African and Asian societies. Millets were traditionally consumed in considerable amount with rice, but their popularity has been declined in recent decades as other cereals such as wheat, oats and maize have become more popular. Pearl millet [Pennisetum glaucum (L.) R. Br.] is an important coarse grain cereal crop of traditional small holder farming systems that belongs to the grass family Poaceae, subfamily Panicoideae and genus Pennisetum. The genus Pennisetum (bristle grass) is the largest and most significant, with over 140 species. Being C 4 plant, it contributes 30% of worldwide terrestrial carbon fixation alongside maize and sorghum (Choudhary et al., 2020) [5] . In India, pearl millet popularly known as 'bajra' or 'bajri'. Pearl millet also known as candle millet, cattail millet and bulrush millet. It is a vigorous, fast growing, rainy season cereal grass with huge stems, leaves and heads, as well as vast genetic variation. Pearl millet is a diploid (2n = 2x = 14), warm season crop with tremendous photosynthetic potential, polymorphic, has short life cycle and an outbreeding nature due to protogynous Grain yield is complex polygenic character and it is composed of several components. Some of which affect the grain yield directly, while others affect indirectly. Understanding of the association of different component characters towards grain yield forms the basic requirement for any selection programme. This study will determine the criteria for selection that could be effectively used to enhance yield potential of pearl millet. Hence, correlation must be worked out among component and yield traits. The path coefficient analysis described by Wright (1921) [12] is standardized as partial regression coefficient, which aids in partitioning the correlation coefficient into direct and indirect effects of independent variables on dependent variables. One variable is assessed by its direct effect on another. As a result, it will assist to reveal the intrinsic nature of the observed correlations and impact the level of confidence in the selection scheme used for the current situation. Direct selection for grain yield is unreliable since it is influenced by the environmental conditions. As a result, it is vital to determine the character traits that might affect grain yield.
Materials and Methods
The experimental material for present investigation was comprised of 120 genotypes of pearl millet [Pennisetum glaucum (L.) R. Br.] collected from Pearl Millet Research Station, JAU, Jamnagar during Summer, 2023. All the experiments were conducted in Randomized Complete Block Design with two replications. Each genotype was planted in a single row of 5.0 m length, 60 cm apart, with a 15 cm plant-to-plant spacing. To avoid damage and border effects, each experiment was surrounded by border rows. The recommended agronomical and plant protection practices were followed for the successful raising of the crop in each environment. The observations were recorded on grain yield per plant and other component traits like days to 50% flowering, days to maturity, plant height, number of effective tillers per plant, number of nodes on main shoot, ear head length, ear head diameter, ear head weight, fodder yield per plant, test weight, panicle index and harvest index. Observations were collected from five randomly selected competing plants from each entry in each replication for various traits and the averages were used in the statistical analysis. The days to 50 per cent flowering and days to maturity was be recorded on plot basis. The analysis of variance for randomized block design (RBD) was done for each character with the method suggested by Panse and Sukhatme (1995) [8] . Genotypic (r g ) and phenotypic (r p ) correlation coefficients were calculated by adopting the method explained by Al-Jibouri et al. (1958). The genotypic and phenotypic path analysis was carried out as per the method suggested by Dewey and Lu (1959) [6] . Analysis was done in R-Studio software.
Result and Discussions
Grain yield is polygenic in nature, its inheritance is complex and highly dependent on genetic factors. Understanding the extent of genetic associations between grain yield and its contributing traits is highly essential for identifying desirable genotypes. Therefore, analyzing the genetic association between grain yield and its components provides insight into their collective impact on economic yield. The correlation coefficients between grain yield per plant and its component traits and among themselves were estimated at genotypic (r g ) and phenotypic (r p ) levels showed in Table 1.
| — | DTF | DTM | PH | NETP | NNMS | EHL | EHD | EHW | FYP | TW | PI | HI | GYP |
|---|---|---|---|---|---|---|---|---|---|---|---|---|---|
| DTF | - | 0.9310** | 0.0279 | -0.0648 | 0.0017 | 0.1808* | 0.2258* | -0.1936* | 0.1617 | -0.0482 | 0.0223 | -0.2697** | -0.1914* |
| DTM | 0.7593** | - | 0.0298 | -0.0571 | 0.0203 | 0.1539 | 0.2071* | -0.2749** | 0.2091* | -0.0987 | 0.1213 | -0.3403** | -0.2525** |
| PH | -0.0035 | 0.0003 | - | 0.2753** | 0.8797** | 0.6761** | -0.3249** | 0.2162* | 0.6715** | -0.0784 | -0.2975** | -0.7138** | 0.1222 |
| NETP | -0.0585 | -0.0551 | 0.1908 | - | 0.0670 | 0.1228 | -0.2977** | 0.1937* | 0.3613** | -0.2173* | -0.1056 | -0.2329** | 0.1395 |
| NNMS | 0.0009 | -0.0101 | 0.6724** | 0.0158 | - | 0.5243** | -0.2062* | 0.2639** | 0.5825** | 0.0482 | -0.1452 | -0.5801** | 0.2208* |
| EHL | 0.1257 | 0.0880 | 0.6261** | 0.0689 | 0.3721** | - | -0.1288 | 0.2367** | 0.5479** | -0.0164 | -0.3596** | -0.5334** | 0.1563 |
| EHD | 0.1371 | 0.1825* | -0.2653** | -0.2264* | -0.1473 | -0.0704 | - | 0.2769** | -0.1812* | 0.4550** | 0.3285** | 0.3610** | 0.3672** |
| EHW | -0.1570 | -0.2351** | 0.2014* | 0.1891* | 0.2214* | 0.2366** | 0.2655** | - | 0.2591** | 0.3248** | -0.0235 | 0.1628 | 0.9680** |
| FYP | 0.1204 | 0.1736 | 0.5911** | 0.3395** | 0.4717** | 0.4620** | -0.1377 | 0.2590** | - | -0.1005 | -0.3193** | -0.8352** | 0.1722 |
| TW | -0.0559 | -0.0939 | -0.0594 | -0.1707 | 0.0473 | 0.0246 | 0.3820** | 0.2700** | -0.0839 | - | 0.3177** | 0.2800** | 0.4045** |
| PI | -0.0089 | 0.0415 | -0.1201 | 0.0657 | -0.1147 | -0.2170* | 0.1964* | -0.1276* | -0.1455 | 0.1429 | - | 0.4845** | 0.2133* |
| HI | -0.2098* | -0.2846** | -0.5913** | -0.1869* | -0.4595** | -0.4316** | 0.3079** | 0.1645 | -0.8073** | 0.2248* | 0.3467** | - | 0.2796** |
| GYP | -0.1672 | -0.2166* | 0.1268 | 0.1930* | 0.1607 | 0.1400 | 0.3443** | 0.9000** | 0.1820* | 0.3332** | 0.2958** | 0.3125** | - |
Table text extracted from the original PDF; superscript letters are shown inline. The original table image is below.
View original table image
Days to 50% Flowering
Days to 50% flowering showed significant and negative correlation with grain yield per plant at genotypic level (r g = -0.1914) and non-significant and negative correlation at phenotypic (r p = -0.1672) level. Days to 50% flowering exhibited significant and positive correlation with days to maturity (r g = 0.9310, r p = 0.7593) at both genotypic and phenotypic levels. Conversely, it showed significant and negative correlation with ear head weight (r g = -0.1936) and harvest index (r g = -0.2697, r p = -0.2098).
Days to Maturity
Days to maturity showed negative and significant association with grain yield per plant at both genotypic and phenotypic levels (r g = -0.2525, r p = -0.2166). Days to maturity exhibited significant and positive correlation with ear head diameter (r g = 0.2071, r p = 0.1825), while showing significant and negative association with ear head weight (r g = -0.2749, r p = -0.2351) and harvest index (r g = -0.3403, r p = -0.2846) at both genotypic and phenotypic levels.
Plant Height
Plant height exhibited positive but non-significant association with grain yield per plant at both genotypic and phenotypic levels (r g = 0.1222, r p = 0.1268). Plant height exhibited significant and positive correlations with number of effective tillers per plant (r g = 0.2753), number of nodes on the main shoot (r g = 0.8797, r p = 0.6724), ear head length (r g = 0.6761, r p = 0.6261) and fodder yield per plant (r g = 0.6715, r p = 0.5911). Conversely, it showed significant and negative association with ear head diameter (r g = -0.3249, r p = -0.2653) and harvest index (r g = -0.7138, r p = -0.5913) at both genotypic and phenotypic levels.
Number of Effective Tillers per Plant
Number of effective tillers per plant exhibited positive but non-significant correlation with grain yield per plant at the both the levels (r g = 0.1395, r p = 0.1930). Number of effective tillers per plant showed significant and positive correlation with ear head weight (r p = 0.1891) and fodder yield per plant (r g = 0.3613, r p = 0.3395). However, it exhibited significant but negative correlation with ear head diameter (r g = -0.2977, r p = -0.2264) and harvest index (r g = -0.7138, r p = -0.1869) at both genotypic and phenotypic levels.
Number of Nodes on Main Shoot
Number of nodes on the main shoot exhibited significant and positive correlation with grain yield per plant at the genotypic (r g = 0.2208) and non-significant and positive correlation at phenotypic (r p = 0.1607) levels. Number of nodes on the main shoot showed significant and positive correlation with plant height (r g = 0.8797, r p = 0.6724), ear head length (r g = 0.5243, r p = 0.3721) and fodder yield per plant (r g = 0.5825, r p = 0.4717), while it exhibited significant and negative association with ear head diameter (r g = -0.2062) and harvest index (r g = -0.5801, r p = -0.4595).
Ear Head Length
Ear head length exhibited positive but non-significant association with grain yield per plant at the genotypic and phenotypic levels (r g = 0.1563, r p = 0.1400). Ear head length demonstrated significant and positive correlation with ear head weight (r g = 0.2367, r p = 0.2366) and fodder yield per plant (r g = 0.5479, r p = 0.4620), whereas it showed significant but negative association with harvest index (r g = -0.3596, r p = -0.4316) and panicle index (r g = -0.5334, r p = -0.2170) at both genotypic and phenotypic levels.
Ear Head Diameter
Ear head diameter exhibited positive and highly significant correlation with grain yield per plant at both the genotypic and phenotypic levels (r g = 0.3672, r p = 0.3443). Ear head diameter showed significant and positive correlation with ear head weight (r g = 0.2769, r p = 0.2655), test weight (r g = 0.4550, r p = 0.3820), panicle index (r g = 0.3285, r p = 0.1964) and harvest index (r g = 0.3610, r p = 0.3079).
Ear Head Weight
Ear head weight exhibited strong highly significant and positive association with grain yield per plant at both the genotypic and phenotypic levels (r g = 0.9680, r p = 0.9000) highlighting its dependable role as key yield-contributing trait. In terms of associated traits, ear head weight showed significant and positive correlations with fodder yield per plant (r g = 0.2591, r p = 0.2590) and test weight (r g = 0.3248, r p = 0.2700).
Fodder Yield per Plant
Fodder yield per plant showed positive but non-significant correlation at the genotypic level (r g = 0.1722) and positive and significant association at the phenotypic level (r p = 0.1820). Fodder yield per plant had significant but negative correlations with both panicle index (r g = -0.3193, r p = -0.8352) and harvest index (r p = -0.8073).
Test Weight
Test weight exhibited positive and highly significant at both the genotypic (r g = 0.4045) and phenotypic (r p = 0.3332) levels, indicating a strong link between heavier grains and grain yield performance.
Panicle Index
Panicle index positive and significant association with grain yield per plant at the genotypic level (r g = 0.2133) and showed highly significant and positive relationship at the phenotypic level (r p = 0.2958). It had highly significant and positive association with harvest index, reinforcing its role in determining yield efficiency. The strength of these relationships was consistent at both genotypic and phenotypic levels, with correlations (r g = 0.4845, r p = 0.3467).
Harvest index
Harvest index exhibited positive and highly significant correlation with grain yield per plant at both the genotypic (r g = 0.2796) and phenotypic (r p = 0.3125) levels, indicating strong and consistent relationship.
Grain yield per plant
Grain yield per plant exhibited positive and highly significant correlation with ear head weight (r g = 0.9680, r p = 0.9000), test weight (r g = 0.4045, r p = 0.3332), harvest index (r g = 0.2796, r p = 0.3125) and ear head diameter (r g = 0.3672, r p = 0.4430) at both the genotypic and phenotypic levels, indicating a strong and consistent relationship.
Path Coefficient Analysis
Path coefficient analysis, originally developed by Wright (1921) [12] , partitions the associations among variables to quantify the relative contributions of direct and indirect effects of independent variables on a dependent variable. This technique was first applied in plant breeding by Dewey and Lu (1959) [6] in the selection program of crested wheatgrass, providing a framework to understand the complex relationships among yield-related traits. Path analysis was conducted at phenotypic level, with grain yield per plant as the dependent variable and several agronomic traits as independent variables, including days to 50% flowering, days to maturity, plant height, number of effective tillers per plant, number of nodes on main shoot, ear head length, ear head diameter, ear head weight, grain yield per plant, fodder yield per plant, test weight, panicle index and harvest index. Each trait was examined for both its direct effect on grain yield per plant and its indirect effect through other traits, which are not captured by simple correlation analysis. The results of the phenotypic path coefficient analysis are summarized in Table 2. The cause and effect relationships identified by the path coefficient analysis are visually represented at the phenotypic level in Figure 1. The direct effect of days to 50% flowering on grain yield per plant was negative and negligible (-0.0190), with a low negative indirect effect via ear head weight (-0.1452). Similarly, days to maturity showed negligible but positive direct effect (0.0020) and moderate negative indirect effect through ear head weight (-0.2174). Plant height also exerted negligible and negative direct effect (-0.0347) but had low positive indirect effect via ear head weight (0.1863). Number of effective tillers per plant, followed the same trend, with negligible and negative direct effect (-0.0099) but low positive indirect effect (0.1749) via ear head weight. Number of nodes on the main shoot recorded moderate positive indirect effect through ear head weight (0.2048). Ear head length, though non-significantly correlated with grain yield, exerted a moderate indirect effect via ear head weight (0.2188), while ear head diameter also influenced yield moderately through its impact on ear head weight (0.2457). Fodder yield per plant, while limited in direct influence, exerted substantial positive indirect effects through ear head weight, confirming its importance as selection criterion for dual-purpose productivity. Test weight also displayed negligible direct effect, but indirectly had moderate positive effect via ear head weight (0.2497), showing its dependent role in boosting yield. Panicle index contributed strongly and directly to grain yield (0.4061), but its negative indirect effects via ear head weight (-0.1180) indicate that selection for this trait should be balanced against ear head development. Similarly, harvest index showed negligible but positive direct effects (0.0473) and low positive indirect effect via ear head weight (0.1521). Overall, the residual effect from phenotypic path analysis was 0.0170, indicating that the studied traits were sufficient to explain the variability in grain yield per plant. Collectively, these results point to ear head weight and panicle index as the most valuable direct contributors, while traits like fodder yield, test weight, and harvest index support yield indirectly through their consistent positive relation with ear head weight, making them crucial in breeding programs for pearl millet improvement.
| Characters | DTF | DTM | PH | NETP | NNMS | EHL | EHD | EHW | FYP | TW | PI | HI | Phenotypic correlation with GYP |
|---|---|---|---|---|---|---|---|---|---|---|---|---|---|
| DTF | -0.0190 | 0.0015 | 0.0001 | 0.0006 | 0.0001 | 0.0034 | 0.0001 | -0.1452 | 0.0057 | -0.0007 | -0.0036 | -0.0099 | -0.1672 |
| DTM | -0.0145 | 0.0020 | -0.0001 | 0.0006 | -0.0002 | 0.0023 | 0.0002 | -0.2174 | 0.0082 | -0.0012 | 0.0169 | -0.0135 | -0.2166* |
| PH | 0.0001 | 0.0001 | -0.0347 | -0.0019 | 0.0101 | 0.0167 | -0.0003 | 0.1863 | 0.0280 | -0.0007 | -0.0488 | -0.0280 | 0.1268 |
| NETP | 0.0011 | -0.0001 | -0.0066 | -0.0099 | 0.0002 | 0.0018 | -0.0002 | 0.1749 | 0.0161 | -0.0021 | 0.0267 | -0.0088 | 0.1930* |
| NNMS | -0.0001 | -0.0001 | -0.0233 | -0.0002 | 0.0151 | 0.0099 | -0.0001 | 0.2048 | 0.0223 | 0.0006 | -0.0466 | -0.0217 | 0.1607 |
| EHL | -0.0024 | 0.0002 | -0.0217 | -0.0007 | 0.0056 | 0.0266 | -0.0001 | 0.2188 | 0.0219 | 0.0003 | -0.0881 | -0.0204 | 0.1400 |
| EHD | -0.0026 | 0.0004 | 0.0092 | 0.0022 | -0.0022 | -0.0019 | 0.0010 | 0.2457 | -0.0065 | 0.0047 | 0.0798 | 0.0146 | 0.3443** |
| EHW | 0.0030 | -0.0005 | -0.0070 | -0.0019 | 0.0033 | 0.0063 | 0.0003 | 0.9249 | 0.0123 | 0.0034 | -0.0518 | 0.0078 | 0.9000** |
| FYP | -0.0023 | 0.0003 | -0.0205 | -0.0034 | 0.0071 | 0.0123 | -0.0001 | 0.2395 | 0.0473 | -0.0010 | -0.0591 | -0.0382 | 0.1820* |
| TW | 0.0011 | -0.0002 | 0.0021 | 0.0017 | 0.0007 | 0.0007 | 0.0004 | 0.2497 | -0.0040 | 0.0124 | 0.0580 | 0.0106 | 0.3332** |
| PI | 0.0002 | 0.0001 | 0.0042 | -0.0007 | -0.0017 | -0.0058 | 0.0002 | -0.1180 | -0.0069 | 0.0018 | 0.4061 | 0.0164 | 0.2958** |
| HI | 0.0040 | -0.0006 | 0.0205 | 0.0019 | -0.0069 | -0.0115 | 0.0003 | 0.1521 | -0.0382 | 0.0028 | 0.1408 | 0.0473 | 0.3125** |
Table text extracted from the original PDF; superscript letters are shown inline. The original table image is below.
View original table image
Conclusion
The study revealed that grain yield per plant in pearl millet most strongly and consistently influenced by ear head weight, which showed a very high positive correlation and the highest direct effect, establishing it as the key selection criterion for yield improvement. Panicle index also contributed significantly and directly, though its negative indirect effects via ear head weight suggest the need for balanced approach to maintain ear head development. Traits like test weight and harvest index exhibited significant positive correlations with grain yield and further enhanced yield indirectly through ear head weight, while fodder yield per plant, though limited in direct influence, also supported grain yield via indirect contributions. Conversely, days to 50% flowering and days to maturity were generally associated with negative direct or indirect influences on yield. Overall, the correlation and path coefficient analyses highlight ear head weight as the most dependable yieldcontributing trait, supported by panicle index, test weight, harvest index, and fodder yield, which together provide a strong basis for selection strategies aimed at improving both grain productivity and dual-purpose efficiency in pearl millet breeding programs.
Acknowledgement
AcknowledgementI am deeply grateful to the authorities of Junagadh Agricultural University (JAU) for providing the resources necessary to carry out this investigation.
References
12 in the original paper- Anuradha N, Satyavathi CT, Bharadwaj C, Nepolean T, Sankar SM, Singh SP, et al. Deciphering genomics regions for high grain iron and zinc content using association mapping in pearl millet. Front Plant Sci. 2017;8:412.
- Al-Jibouri NA, Miller PA, Robin HF. Genotypic and environmental variances, co-variances in an upland cotton cross of inter-specific origin. Agron J. 1958;50:633-7.
- Tripathi T. Foxtail millet: Rediscovering a superfood for the 21st century. J Curr Res Food Sci. 2024;5(2):110-115.
- Choudhary S, Guha A, Kholova J, Pandravada A, Messina CD, Cooper M, et al. Maize, sorghum, and pearl millet have highly contrasting species strategies to adapt to water stress and climate change-like conditions. Plant Sci. 2020;295:110297.
- Dewey DR, Lu KH. A correlation and path coefficient analysis of components of crested wheat grass seed production. Agron J. 1959;51:515-8.
- Kumari D, Thakur N, Upmanyu S. The world of millets: A comprehensive overview of millets and their significance. J Cereal Res. 2024;16(3).
- Panse VG, Sukhatme PV. Statistical methods for agricultural workers. 2nd ed. New Delhi: Indian Council of Agricultural Research; 1967. p. 381.
- Rai KN, Govindaraj M, Rao AS. Genetic enhancement of grain iron and zinc content in pearl millet. Qual Assur Saf Crops Foods. 2012;4:119-25.
- Rao PP, Birthal PS, Reddy BV, Rai KN, Ramesh S. Diagnostics of sorghum and pearl millet grains-based nutrition in India. Int Sorghum Millets Newsl. 2006;47:93-6.
- Singhal T, Satyavathi CT, Kumar A, Sankar SM, Singh SP, Bharadwaj C, et al. Genotype × environment interaction and genetic association of grain iron and zinc content with other agronomic traits in RIL population of pearl millet. Crop Pasture Sci. 2018;69:1092-102.
- Wright S. Correlation and causation. J Agric Res. 1921;20:557-85.
- Anonymous. Third advance estimates data of area, production and yield of major crops of Gujarat state for the year 2023-24. Directorate of Agriculture, Department of Agriculture, Farmers Welfare and Cooperation, Government of Gujarat, Gandhinagar; 2023b.