
Research article · 2025 · Full text
International Journal of Agriculture and Food ScienceInfluence of intercropping and fertilizer management on nutrient uptake and soil nutrient dynamics in sweet corn
Volume 7(9) · Pages 646–650 · DOI: 10.33545/2664844x.2025.v7.i9i.806 ↗
Research areasGeochemistry and Geologic MappingGeological Modeling and AnalysisElectrical and Electromagnetic Research
Abstract
Author-writtenA field experiment was carried out during Rabi 2020-21 at S.V. Agricultural College, Tirupati, Andhra Pradesh, to evaluate the effect of intercropping and nutrient management on nutrient uptake by sweet corn and the post-harvest soil nutrient status. The experiment was conducted on sandy clay loam soils under a split-plot design with three replications. Treatments included three intercropping systems: sweet corn + knol khol (I₁), sweet corn + radish (I₂) and sweet corn + onion (I₃), along with four nutrient levels: 100% recommended dose of fertilizer (RDF) to sweet corn alone (N₁), 100% RDF to sweet corn + 75% RDF to intercrop (N₂), 100% RDF to sweet corn + 50% RDF to intercrop (N₃) and 100% RDF to sweet corn + 25% RDF to intercrop (N₄). Results indicated that sweet corn + knol khol (I₁) along with 100% RDF to sweet corn + 75% RDF to intercrop (N₂) recorded significantly higher N, P and K uptake. Post-harvest soil available nutrients were comparatively higher with sweet corn + radish (I₂) and nutrient management through N₂.
Summary
Source-checkedPlain-language reading of the full paper, prepared with AI and checked against the text. Each point links to the authors' own words.
Why it matters
- India's growing population creates pressure on food security, making it essential to increase crop productivity per unit of land. View evidence ↗
- Intercropping is considered a sustainable method for optimizing resources, maintaining soil fertility, and increasing productivity. View evidence ↗
- Using short-duration vegetables as intercrops can improve profitability and enhance the management of soil and resources. View evidence ↗
The question
- The study aimed to evaluate how different nutrient levels and intercropping systems affect nutrient uptake in sweet corn and intercrops, as well as the resulting soil nutrient status. View evidence ↗
What they did
- The field experiment took place during Rabi 2020-21 in Tirupati, Andhra Pradesh, using a split-plot design with three replications on sandy clay loam soils. View evidence ↗
- The study tested three intercropping combinations (knol khol, radish, and onion) and four nutrient levels ranging from fertilizer for sweet corn alone to adding up to 75% of the recommended dose for the intercrop. View evidence ↗
- Sweet corn (cv. Sweet Gold-99) was planted at 60 x 20 cm spacing, with intercrops (knol khol, radish, and onion) planted in inter-rows at 15 cm spacing. View evidence ↗
- Nutrient uptake was measured using the micro-Kjeldahl method for nitrogen, the vanado-molybdo phosphoric acid method for phosphorus, and flame photometry for potassium. View evidence ↗
What they found
- Sweet corn achieved the highest nutrient uptake when intercropped with knol khol (148 kg N, 18.5 kg P, and 155 kg K ha-1). View evidence ↗
- The nutrient management practice of providing 100% RDF to sweet corn and 75% RDF to the intercrop (N2) led to significantly higher nutrient uptake in sweet corn (151 kg N, 18.8 kg P, and 158 kg K ha-1). View evidence ↗
- Intercrops showed higher nitrogen uptake when grown alone compared to when they were intercropped with sweet corn. View evidence ↗
- Post-harvest soil nutrient availability was highest in the sweet corn + radish system (179 kg N, 41.7 kg P2O5, and 206 kg K2O ha-1). View evidence ↗
- The N2 nutrient level (100% RDF to sweet corn + 75% RDF to intercrop) resulted in the highest post-harvest soil available nutrients (184 kg N, 42.6 kg P2O5, and 212 kg K2O ha-1). View evidence ↗
What it means
- The authors concluded that applying 100% RDF to sweet corn and 75% RDF to intercrops is the most efficient nutrient management strategy. View evidence ↗
- The authors recommend that farmers use the sweet corn + knol khol system for maximum nutrient uptake or the sweet corn + radish system to sustain soil fertility. View evidence ↗
Visual summary
3 visualsIllustrations explain the paper; charts are replotted from the paper's own table values.
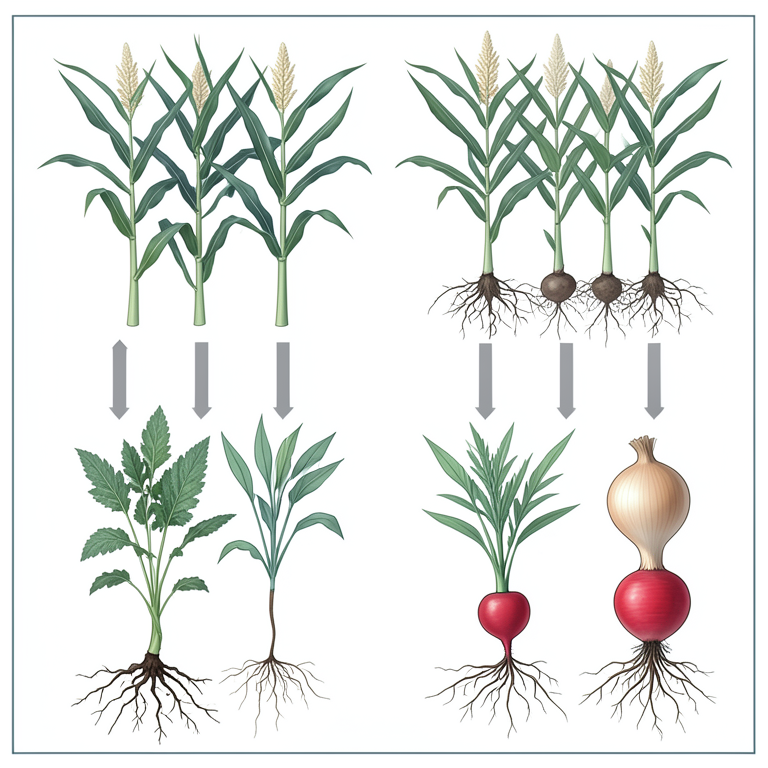
Experimental Treatment Layout
AI-generated conceptual illustration (sweet corn plants intercropped with knol khol, radish, and onion in a field). It explains the idea and does not show study data.
View source evidence ↗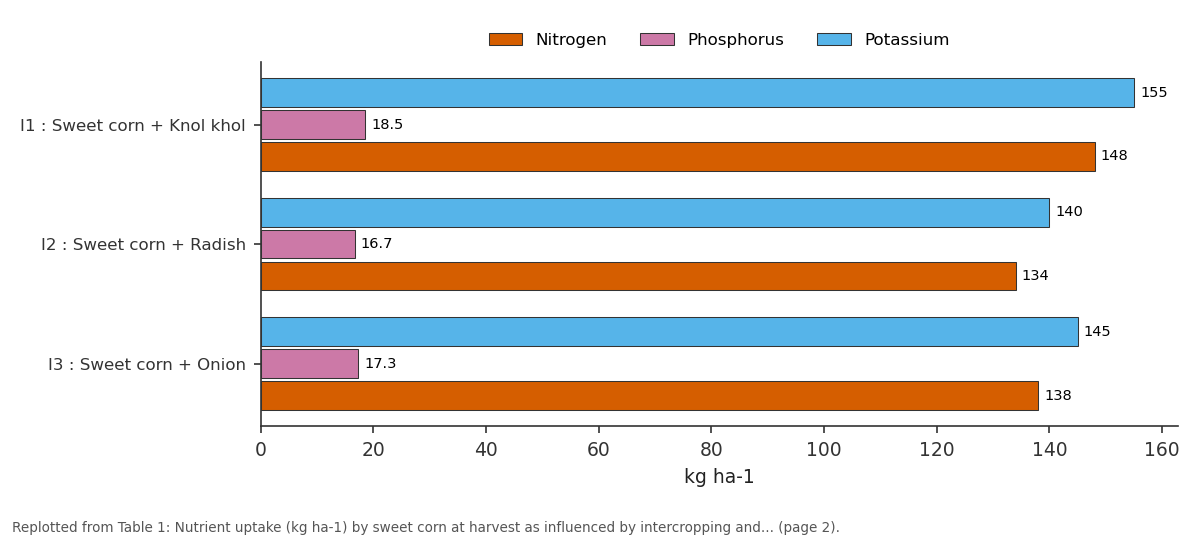
Nitrogen and Phosphorus and more: I1 : Sweet corn + Knol... vs I2 : Sweet corn + Radish vs I3 : Sweet corn + Onion
Replotted from Table 1 (page 2) of the original paper. Every bar is the paper's own table value.
View source evidence ↗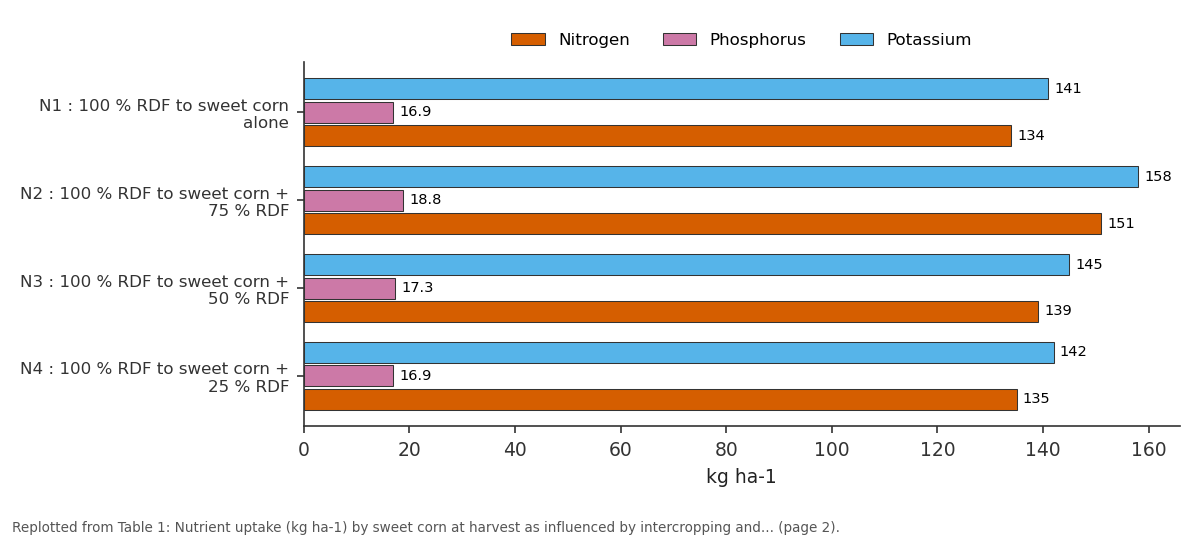
Nitrogen and Phosphorus and more: N1 : 100 % RDF to sweet... vs N2 : 100 % RDF to sweet... vs N3 : 100 % RDF to sweet... vs N4 : 100 % RDF to sweet...
Replotted from Table 1 (page 2) of the original paper. Every bar is the paper's own table value.
View source evidence ↗Figures & tables
From the original paper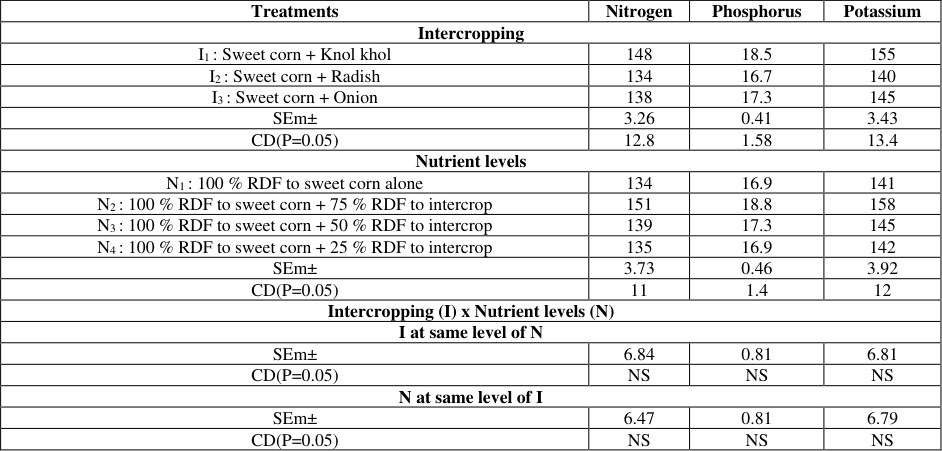 Table 1
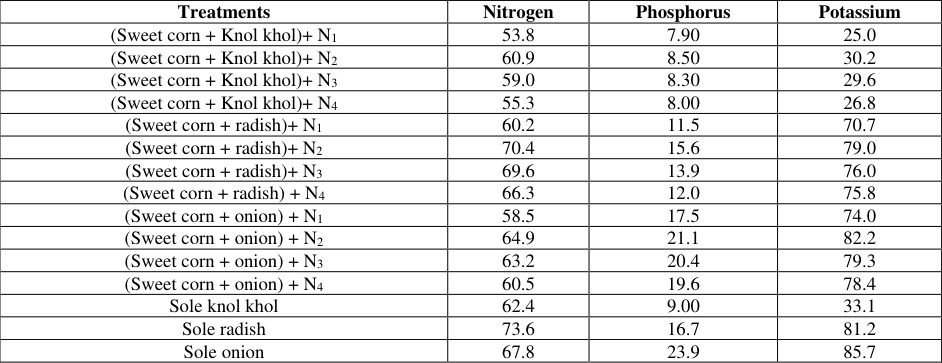 Table 2
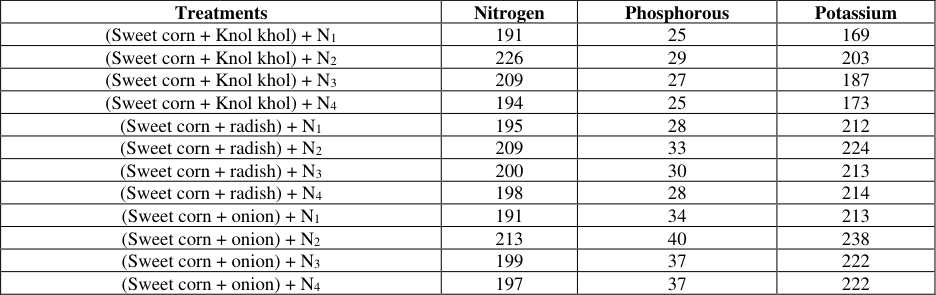 Table 3
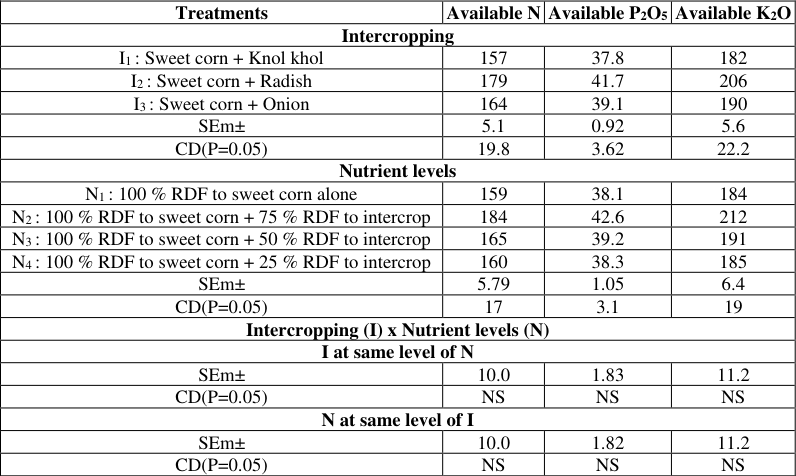 Table 4
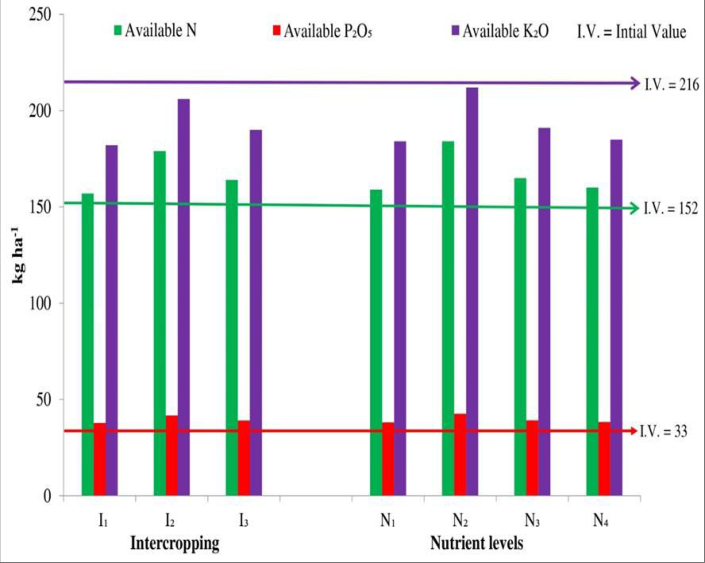 Figure 1
Introduction
The increasing population of India continues to exert pressure on food and nutritional security. Enhancing crop productivity per unit area through efficient use of limited land and resources is vital. Intercropping has been recognized as a sustainable approach to optimize resource utilization, maintain soil fertility and improve overall productivity (Tejaswitha et al., 2021) [21] . Maize (Zea mays L.) is the third most important cereal crop worldwide. In India, it occupies 9.2 million hectares with an annual production of 27.8 million tonnes, while in Andhra Pradesh it is grown on 3.01 lakh hectares producing 21.21 lakh tonnes. Sweet corn (Zea mays saccharata), a special type of maize, is valued for its higher sugar content. Vegetables, being rich sources of vitamins, minerals and dietary fiber, are also considered "protective foods." Short-duration vegetables as intercrops not only improve profitability but also contribute to better soil and resource management. Nutrient requirement in intercropping systems varies depending on the crop combination. Optimizing fertilizer application is, therefore, essential to sustain productivity of sweet corn-based intercropping systems. Hence, this study was undertaken to assess nutrient uptake by sweet corn and intercrops under varying nutrient levels and their effect on soil nutrient status.
Materials and Methods
The study was conducted at the Wetland Farm, S.V. Agricultural College, Tirupati (13.5°N latitude, 79.5°E longitude and altitude 182.9 m), which falls under the Southern Agro-Climatic Zone of Andhra Pradesh. The soil was sandy clay loam, neutral in reaction, low in organic carbon and available nitrogen and medium in phosphorus and potassium. The experiment was conducted in a split-plot design with three replications. The main plot treatments consisted of three intercropping systems: sweet corn + knol khol (I₁), sweet corn + radish (I₂), and sweet corn + onion (I₃). The sub-plot treatments comprised four nutrient levels: 100% RDF to sweet corn alone (N₁), 100% RDF to sweet corn + 75% RDF to intercrop (N₂), 100% RDF to sweet corn + 50% RDF to intercrop (N₃) and 100% RDF to sweet corn + 25% RDF to intercrop (N₄).
Sweet corn (cv. Sweet Gold-99) was sown at a spacing of 60 × 20 cm, while intercrops knol khol (Indam Early White), radish (Chetki Long) and onion (KP onion) were sown in the inter-rows with 15 cm intra-row spacing. Fertilizer requirements were met through urea, single super phosphate and muriate of potash. The recommended doses of fertilizers (kg N-P₂O₅-K₂O ha⁻¹) were 120-60-50 for sweet corn, 100-60-60 for knol khol, 50-100-50 for radish and 80-50-80 for onion. Half of Nitrogen and the full dose of P₂O₅ and K₂O were applied as basal, while the remaining N was topdressed at 30 DAS. Other cultural practices were followed as per recommendations. Well-dried plant samples collected for dry matter estimation were used to assess nutrient uptake at harvest. Nitrogen content in the dry matter was determined by the micro-Kjeldahl method (AOAC, 1960) [4] and uptake was calculated by multiplying nitrogen content with the respective dry matter production. Phosphorus content was analyzed from tri-acid digested samples using the vanado-molybdo phosphoric acid method (Jackson, 1973) [10] with color intensity measured spectrophotometrically; phosphorus uptake was then computed by multiplying content with dry matter yield. Potassium content in the tri-acid digest was estimated using a flame photometer and uptake was calculated in the same way. Immediately after harvest, soil samples were collected from each plot to assess post-harvest nutrient status. Available nitrogen was estimated using the alkaline potassium permanganate method (Subbiah and Asija, 1956) [19] , available phosphorus by Olsen's method (Olsen et al., 1954) [15] , and available potassium by flame photometry (Jackson, 1973) [10,11] .
Results
Results
Nutrient uptake by sweet corn
The higher uptake of nitrogen, phosphorus and potassium by sweet corn was recorded with sweet corn + knol khol (I 1 ) intercropping this was followed by that in sweet corn + onion (I 3 ) and sweet corn + radish (I 2 ) in order of descent with no significant disparity between any two of them. Application of 100% RDF to sweet corn + 75% RDF to intercrop (N 2 ) resulted in significantly higher nutrient uptake of sweet corn. The next best treatment was 100% RDF to sweet corn + 50% RDF to intercrop (N 3 ) which was however comparable with 100% RDF to sweet corn + 25% RDF to intercrop (N 4 ). Application of 100% RDF to sweet corn alone (N 1 ) resulted in lower uptake of nutrients but was comparable with that of N 4 (Table 1).
| Treatments | Nitrogen | Phosphorus | Potassium |
|---|---|---|---|
| Intercropping | |||
| I1 : Sweet corn + Knol khol | 148 | 18.5 | 155 |
| I2 : Sweet corn + Radish | 134 | 16.7 | 140 |
| I3 : Sweet corn + Onion | 138 | 17.3 | 145 |
| SEm± | 3.26 | 0.41 | 3.43 |
| CD(P=0.05) | 12.8 | 1.58 | 13.4 |
| Nutrient levels | |||
| N1 : 100 % RDF to sweet corn alone | 134 | 16.9 | 141 |
| N2 : 100 % RDF to sweet corn + 75 % RDF to intercrop | 151 | 18.8 | 158 |
| N3 : 100 % RDF to sweet corn + 50 % RDF to intercrop | 139 | 17.3 | 145 |
| N4 : 100 % RDF to sweet corn + 25 % RDF to intercrop | 135 | 16.9 | 142 |
| SEm± | 3.73 | 0.46 | 3.92 |
| CD(P=0.05) | 11 | 1.4 | 12 |
| Intercropping (I) x Nutrient levels (N) | |||
| I at same level of N | |||
| SEm± | 6.84 | 0.81 | 6.81 |
| CD(P=0.05) | NS | NS | NS |
| N at same level of I | |||
| SEm± | 6.47 | 0.81 | 6.79 |
| CD(P=0.05) | NS | NS | NS |
Table text extracted from the original PDF; superscript letters are shown inline. The original table image is below.
View original table image
Nutrient uptake by intercrops
Nitrogen uptake was relatively higher in all intercrops when grown as sole as in intercropping with sweet corn. The data was not subjected to statistical analysis due to lack of feasibility. Hence, the mean values were furnished in tables (Table 2). Among the three intercrops the highest nitrogen uptake was recorded with radish followed by that with onion and knol khol at all the nutrient levels. With respect to phosphorus and potassium uptake, higher values were recorded with onion followed by radish and knol khol. Nutrient uptake (N, P 2 O 5 and K 2 O) by intercrops was higher with 100% RDF to sweet corn + 75% RDF to intercrop (N 2 ) followed by that with 100% RDF to sweet corn + 50% RDF to intercrop (N 3 ), 100% RDF to sweet corn + 25% RDF to intercrop (N 4 ) and 100% RDF to sweet corn alone (N 1 ) in order of descent.
| Treatments | Nitrogen | Phosphorus | Potassium |
|---|---|---|---|
| (Sweet corn + Knol khol)+ N1 | 53.8 | 7.90 | 25.0 |
| (Sweet corn + Knol khol)+ N2 | 60.9 | 8.50 | 30.2 |
| (Sweet corn + Knol khol)+ N3 | 59.0 | 8.30 | 29.6 |
| (Sweet corn + Knol khol)+ N4 | 55.3 | 8.00 | 26.8 |
| (Sweet corn + radish)+ N1 | 60.2 | 11.5 | 70.7 |
| (Sweet corn + radish)+ N2 | 70.4 | 15.6 | 79.0 |
| (Sweet corn + radish)+ N3 | 69.6 | 13.9 | 76.0 |
| (Sweet corn + radish) + N4 | 66.3 | 12.0 | 75.8 |
| (Sweet corn + onion) + N1 | 58.5 | 17.5 | 74.0 |
| (Sweet corn + onion) + N2 | 64.9 | 21.1 | 82.2 |
| (Sweet corn + onion) + N3 | 63.2 | 20.4 | 79.3 |
| (Sweet corn + onion) + N4 | 60.5 | 19.6 | 78.4 |
| Sole knol khol | 62.4 | 9.00 | 33.1 |
| Sole radish | 73.6 | 16.7 | 81.2 |
| Sole onion | 67.8 | 23.9 | 85.7 |
Table text extracted from the original PDF; superscript letters are shown inline. The original table image is below.
View original table image
Total system nutrient uptake
The total nutrient uptake (N, P and K) by both sweet corn as well as intercrops i.e. nutrient uptake by intercropping system, data was not subjected to statistical analysis due to lack of feasibility. Hence, the mean values were furnished in tables (Table 3). Nitrogen uptake was higher with sweet corn + knol khol intercropping system supplied with 100 % RDF to sweet corn + 75 % RDF to intercrop (N 2 ). Higher phosphorus and potassium uptake was recorded with sweet corn + onion intercropping system supplied with 100 % RDF to sweet corn + 75 % RDF to intercrop (N 2 ). Onion require higher amount of phosphorus for their growth and development [11] .
| Treatments | Nitrogen | Phosphorous | Potassium |
|---|---|---|---|
| (Sweet corn + Knol khol) + N1 | 191 | 25 | 169 |
| (Sweet corn + Knol khol) + N2 | 226 | 29 | 203 |
| (Sweet corn + Knol khol) + N3 | 209 | 27 | 187 |
| (Sweet corn + Knol khol) + N4 | 194 | 25 | 173 |
| (Sweet corn + radish) + N1 | 195 | 28 | 212 |
| (Sweet corn + radish) + N2 | 209 | 33 | 224 |
| (Sweet corn + radish) + N3 | 200 | 30 | 213 |
| (Sweet corn + radish) + N4 | 198 | 28 | 214 |
| (Sweet corn + onion) + N1 | 191 | 34 | 213 |
| (Sweet corn + onion) + N2 | 213 | 40 | 238 |
| (Sweet corn + onion) + N3 | 199 | 37 | 222 |
| (Sweet corn + onion) + N4 | 197 | 37 | 222 |
Table text extracted from the original PDF; superscript letters are shown inline. The original table image is below.
View original table image
Post-harvest soil nutrient status
Higher soil available nutrients were observed with sweet corn + radish (I 2 ), followed by sweet corn + onion (I 3 ) and sweet corn + knol khol (I 1 ) intercropping in order of descent with no significant disparity between any two of them (Fig 1). Post-harvest soil available nutrients were higher with 100% to sweet corn + 75% RDF to intercrop (N 2 ) (Table 4). This was followed by that of 100% RDF to sweet corn + 50% RDF to intercrop (N 3 ) which was however comparable with 100% RDF to sweet corn + 25% RDF to intercrop (N 4 ) and lower values of soil available nutrients were recorded with application of 100% RDF to sweet corn alone (N 1 ).
| Treatments | Available N | Available P2O5 | Available K2O |
|---|---|---|---|
| Intercropping | |||
| I1 : Sweet corn + Knol khol | 157 | 37.8 | 182 |
| I2 : Sweet corn + Radish | 179 | 41.7 | 206 |
| I3 : Sweet corn + Onion | 164 | 39.1 | 190 |
| SEm± | 5.1 | 0.92 | 5.6 |
| CD(P=0.05) | 19.8 | 3.62 | 22.2 |
| Nutrient levels | |||
| N1 : 100 % RDF to sweet corn alone | 159 | 38.1 | 184 |
| N2 : 100 % RDF to sweet corn + 75 % RDF to intercrop | 184 | 42.6 | 212 |
| N3 : 100 % RDF to sweet corn + 50 % RDF to intercrop | 165 | 39.2 | 191 |
| N4 : 100 % RDF to sweet corn + 25 % RDF to intercrop | 160 | 38.3 | 185 |
| SEm± | 5.79 | 1.05 | 6.4 |
| CD(P=0.05) | 17 | 3.1 | 19 |
| Intercropping (I) x Nutrient levels (N) | |||
| I at same level of N | |||
| SEm± | 10.0 | 1.83 | 11.2 |
| CD(P=0.05) | NS | NS | NS |
| N at same level of I | |||
| SEm± | 10.0 | 1.82 | 11.2 |
| CD(P=0.05) | NS | NS | NS |
Table text extracted from the original PDF; superscript letters are shown inline. The original table image is below.
View original table image
Discussion
The higher uptake of N, P and K by sweet corn in the sweet corn + knol khol system (I₁) can be attributed to reduced competition for resources, complementary rooting patterns and efficient nutrient utilization. Onion and radish, though beneficial as intercrops, showed comparatively lower nutrient uptake by sweet corn. Similar findings were reported by Naik et al. (2017) [13] and Zhang et al. (2014) [25] , where diversified cropping enhanced nutrient absorption efficiency. Application of 100% RDF to sweet corn + 75% RDF to intercrops (N₂) consistently improved nutrient uptake by both main and intercrops. This might be due to better crop growth, enhanced photosynthetic activity and increased dry matter accumulation, which in turn enhanced nutrient absorption. The balanced nutrient supply under N₂ also ensured improved root activity, facilitating efficient uptake. Intercrops such as radish and onion demonstrated higher individual nutrient uptake compared to knol khol. This may be linked to their faster growth rate and higher nutrient demand, particularly in radish for nitrogen and in onion for phosphorus and potassium. Post-harvest soil fertility was highest in sweet corn + radish system, suggesting that radish might have improved soil nutrient recycling and microbial activity. Higher soil nutrient availability under N₂ further indicates that an optimal level of nutrient application not only supports crop uptake but also maintains soil fertility. These findings are in agreement with Irfan et al. (2020) [9] , who reported enhanced soil nutrient status due to increased root exudation and microbial mineralization under balanced fertilization.
Conclusion
Intercropping of sweet corn with vegetables proved beneficial in enhancing nutrient uptake and soil fertility. Sweet corn + knol khol system (I₁) recorded the highest uptake of nitrogen, phosphorus and potassium by the main crop. Sweet corn + radish system (I₂) improved post-harvest soil nutrient status, indicating better nutrient recycling. Sweet corn + onion system (I₃) performed moderately well for both crop uptake and soil fertility. Application of 100% RDF to sweet corn + 75% RDF to intercrops (N₂) was identified as the most efficient nutrient management practice. Balanced nutrient application under N₂ supported vigorous crop growth, efficient root activity and better soil nutrient retention. Sole application of 100% RDF to sweet corn (N₁) was less effective for crop performance and soil health. Vegetable intercrops such as radish and onion not only enhanced system productivity but also maintained soil fertility. Farmers can adopt sweet corn + knol khol for maximum nutrient uptake or sweet corn + radish for sustaining soil fertility.
References
26 in the original paper- Adhikary S, Pandit MK, Koundinya AVV, Bairagi S, Das A. Examination of system productivity and profitability of baby corn based vegetable intercropping systems. J Crop Weed. 2015;11(1):220-224.
- Ali MR, Rahman MS, Asaduzzaman M, Hossain MM, Mannan MA. Intercropping maize with different vegetables. Bangladesh Agron J. 2015;18(1):49-52.
- Ambos AL, Calipusan BC. Growth and yield performance of sweet corn (Zea mays L.) intercropped with sweet potato applied with mushroom spent and rice ash. Sci Int. 2017;29(2):87.
- AOAC. Official methods of analysis of the Association of Official Agricultural Chemists. 9 th Ed. Washington (DC): AOAC; 1960.
- Bhatnagar A, Pal MH, Singh V. Productivity and profitability of maize based intercropping systems. Madras Agric J. 2012;99(7-9):530-532.
- Chaudhari KD, Rajemahadik VA, Chavan VG, More VG, Chavan AP. Intercropping of different leafy vegetables under paired row planted sweet corn in lateritic soils of Konkan region of Maharashtra state. Int J Agric Sci. 2018;10(8):5834-5837.
- Choudhary SK, Singh RN, Upadhyay PK, Singh RK, Yadav RI, Choudhary HR. Growth and available nutrient in winter maize (Zea mays L.) with vegetable intercrops in Eastern Uttar Pradesh. Bioscan. 2014;9(1):151-4.
- Hossain MH, Bhowal SK, Khan ASMMR. Intercropping system of maize with different winter vegetables. Malays J Med Biol Res. 2016;3(2):91-94.
- Irfan MM, Veeranna HK, Girijesh GK, Kumar DM, Adivappar N. Validation of different fertilizer levels in maize-pole bean based intercropping system in southern transition zone of Karnataka. J Pharmacogn Phytochem. 2020;9(1):1010-1017.
- Jackson ML. Soil chemical analysis. New Delhi: Prentice Hall of India Pvt. Ltd.; 1973, p. 134-204.
- Haranal K, Hanumanthappa M, Mavarkar NS, Salimath SB, Nadukeri S. Foliar application of humic acid with varied nutrient levels on the performance of sweet corn. Int J Res Agron. 2023;6(1):18-21.
- Muyayabantu GM, Kadiata BD, Nkongolo KK. Response of maize to different organic and inorganic fertilization regimes in monocrop and intercrop systems in a Sub-Saharan Africa region. J Soil Sci Environ Manag. 2012;3(2):42-8.
- Naik MSP, Sumathi V, Kadiri L. Response of optimum nitrogen rate in maize with legume intercropping system. SAARC J Agric. 2017;15(1):139-48.
- Obasi CP, Korieocha DS, Ebeniro CN. Response of sweet potato and maize intercrop to nitrogen levels and effect on weed biomass in humid tropical environment of South-Eastern Nigeria. Niger Agric J. 2012;43:1-7.
- Olsen SR, Cole CL, Watanabe PS, Dean LA. Estimation of available phosphorus in soils by extraction with sodium bicarbonate. USDA Circular. 1954;939:1-19.
- Parimaladevi C, Ramanathan SP, Kumar NS, Suresh S. Evaluation of maize based intercropping systems in Thamirabarani basin of Tamil Nadu. J Pharmacogn Phytochem. 2019;8(3):4051-6.
- Samitha U, Zakaria S, Muyassir. Effect of soil amendments on nutrient absorption, growth, and yield of soybean and sweetcorn in podzolic soil by different cropping system. J Agric Vet Sci. 2021;14(1):52-6.
- Sawargaonkar GL, Shelke DK, Shinde SA, Kshirsagar. Performance of kharif maize based legume intercropping systems under different fertilizer doses. Int J Agric Sci. 2008;4(1):152-5.
- Subbiah BV, Asija GL. A rapid procedure for determination of available nitrogen in soils. Curr Sci. 1956;25:259-60.
- Swain B, Garnayak LM, Mangaraj S. Effect of crop combination and nutrient management on yield, nutrient uptake and economics of sweet corn based cropping system. J Crop Weed. 2019;15(1):114-20.
- Tejaswitha S, Nagavani AV, Chandrika V, Prasanthi A, Reddy APK. Effect of crop geometry and intercropping systems on growth parameters and yield of baby corn. Int J Chem Stud. 2021;9(1):1134-6.
- Thavaprakash N, Velayudham K, Muthukumar VB. Effect of crop geometry, intercropping systems and integrated nutrient management practices on productivity of baby corn (Zea mays L.) based intercropping systems. Res J Agric Biol Sci. 2005;1(4):295-302.
- Thavaprakash N, Velayudham K. Light interception and productivity of baby corn as influenced by crop geometry, intercropping systems and integrated nutrient management practices. Asian J Sci Res. 2008;1:72-8.
- Yang C, Fan Z, Chai Q. Agronomic and economic benefits of pea/maize intercropping systems in relation to nitrogen fertilizer and maize density. Agronomy. 2018;8(4):52.
- Zhang X, Huang G, Zhao Q. Differences in maize physiological characteristics, nitrogen accumulation, and yield under different cropping patterns and nitrogen levels. Chil J Agric Res. 2014;74(3):326-32.
- Latha PM, Prasad PVN, Subramanyam K. Productive performance of maize-greengram intercropping at different NPK levels. Agric Sci Dig. 2008;28(1):48-50.