
Research article · 2025 · Full text
International Journal of Geography Geology and EnvironmentAssessment of land use land cover (LULC) change using remote sensing, GIS and machine learning approach: A case study of Bathinda local planning area (LPA)-(2005-2025)
Volume 7(9) · Pages 125–128 · DOI: 10.22271/27067483.2025.v7.i9b.415 ↗
Research areasGeochemistry and Geologic MappingGeological Modeling and AnalysisElectrical and Electromagnetic Research
Abstract
Author-writtenLand-use and Land-cover analysis is important to investigate the patterns of how land is being utilized and what changes occur in it with the passage of time. In Countries like India having massive base of population, land always remain under pressure of increasing demand for housing and various economic activities. The present study is based on Bathinda, city of Punjab State of India which incorporates urbanized limit of the same. The spatio-temporal dynamics of land-use and land-cover that increase pressure on agricultural land and vegetation around the expanding City are analyzed and examined from 2005 to 2025. Landsat 7 and Landsat 8 images for year 2005, 2015 and 2025 are exploited in Google Earth Engine (GEE) and QGIS to study the changes in the area of Water-Bodies, Built-up, Crop-land, Vegetation and Fallow-land. For accuracy assessment Error Matrixand Kappa analysis along with the use of‘ smile Random Forest’ classifier was done in GEE.
Summary
Source-checkedPlain-language reading of the full paper, prepared with AI and checked against the text. Each point links to the authors' own words.
Why it matters
- In India, high population levels create constant pressure on land due to the rising demand for housing and economic activities. View evidence ↗
- The expansion of urban built-up areas into agricultural land affects the local environment and can lead to negative economic, social, and health outcomes. View evidence ↗
- Analyzing land-use and land-cover (LULC) is essential for resource management and the creation of sustainable development policies. View evidence ↗
The question
- The study aims to analyze the spatio-temporal dynamics of LULC from 2005 to 2025 to examine the pressure on vegetation and agricultural land around the expanding city of Bathinda. View evidence ↗
What they did
- The study area covers 574.27 km² and includes Bathinda City, the Local Planning Area (LPA), two towns (Bhucho Mandi and Goniana Mandi), and 46 villages. View evidence ↗
- Researchers used Landsat 7 and 8 images from 2005, 2015, and 2025, processed via Google Earth Engine (GEE) and QGIS, to track five LULC classes: Water-Bodies, Built-up, Crop-land, Vegetation, and Fallow-land. View evidence ↗
- The classification used approximately 100 training samples per class, split into a 70:30 ratio for training and testing. View evidence ↗
- Data was classified using the Smile Random Forest classifier, with accuracy verified through an error matrix and Kappa statistics in GEE. View evidence ↗
What they found
- Crop-land remained the dominant land use, increasing from 329.88 km² (57.44%) in 2005 to 367.56 km² (64.00%) in 2025. View evidence ↗
- Built-up areas grew steadily from 90.99 km² (15.84%) in 2005 to 151.75 km² (26.42%) in 2025, moving from the third to the second most prevalent land use. View evidence ↗
- Vegetation experienced a significant decline, dropping from 118.26 km² (20.59%) in 2005 to 40.31 km² (7.02%) in 2025. View evidence ↗
- Between 2005 and 2025, the built-up category saw a total increase of 60.76 km², representing a 66.78% growth. View evidence ↗
- The observed decrease in vegetation is interpreted by the authors as a sign of environmental degradation in the study region. View evidence ↗
What it means
- The authors conclude that Bathinda has experienced constant urban expansion in multiple directions along major highways, primarily encroaching on peripheral agricultural land. View evidence ↗
- The authors recommend that policymakers account for these LULC changes when planning the region's future development. View evidence ↗
Visual summary
3 visualsIllustrations explain the paper; charts are replotted from the paper's own table values.
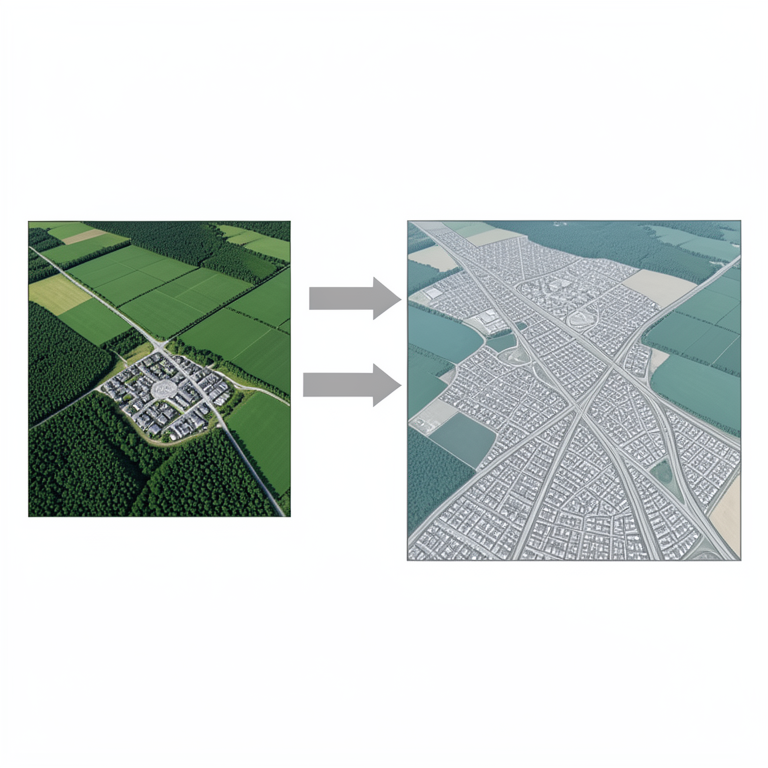
Urban Expansion Dynamics
AI-generated conceptual illustration (Satellite view of the Bathinda local planning area landscape). It explains the idea and does not show study data.
View source evidence ↗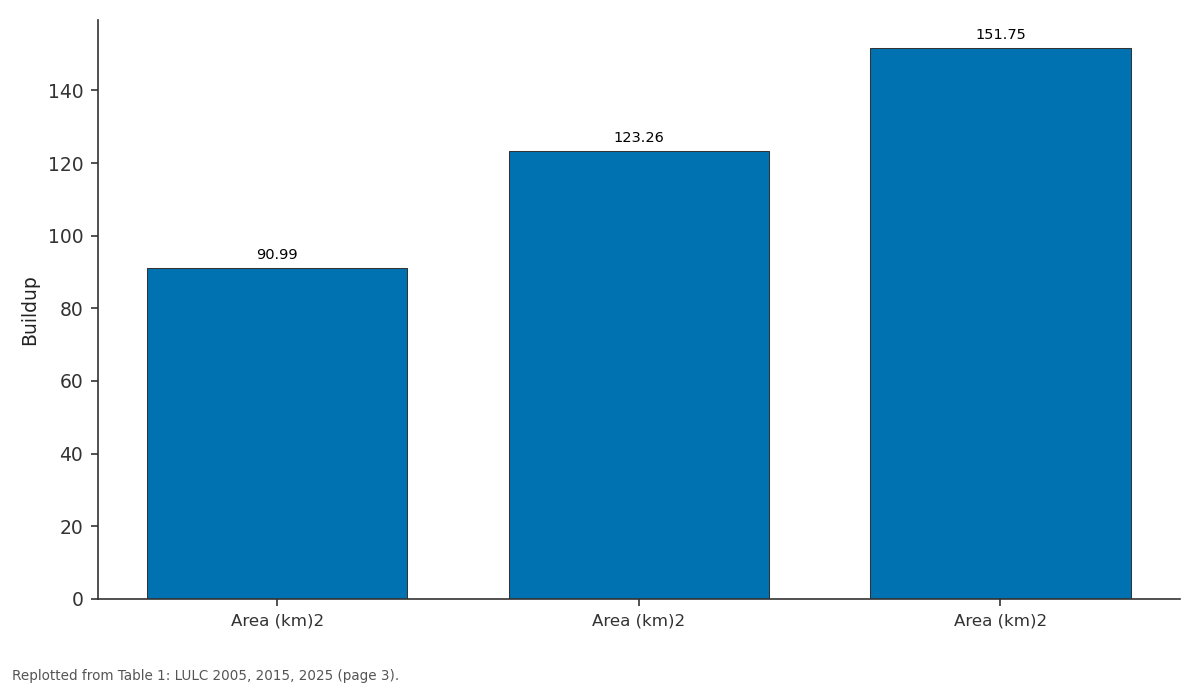
Buildup: Area (km)2 vs Area (km)2 vs Area (km)2
Replotted from Table 1 (page 3) of the original paper. Every bar is the paper's own table value.
View source evidence ↗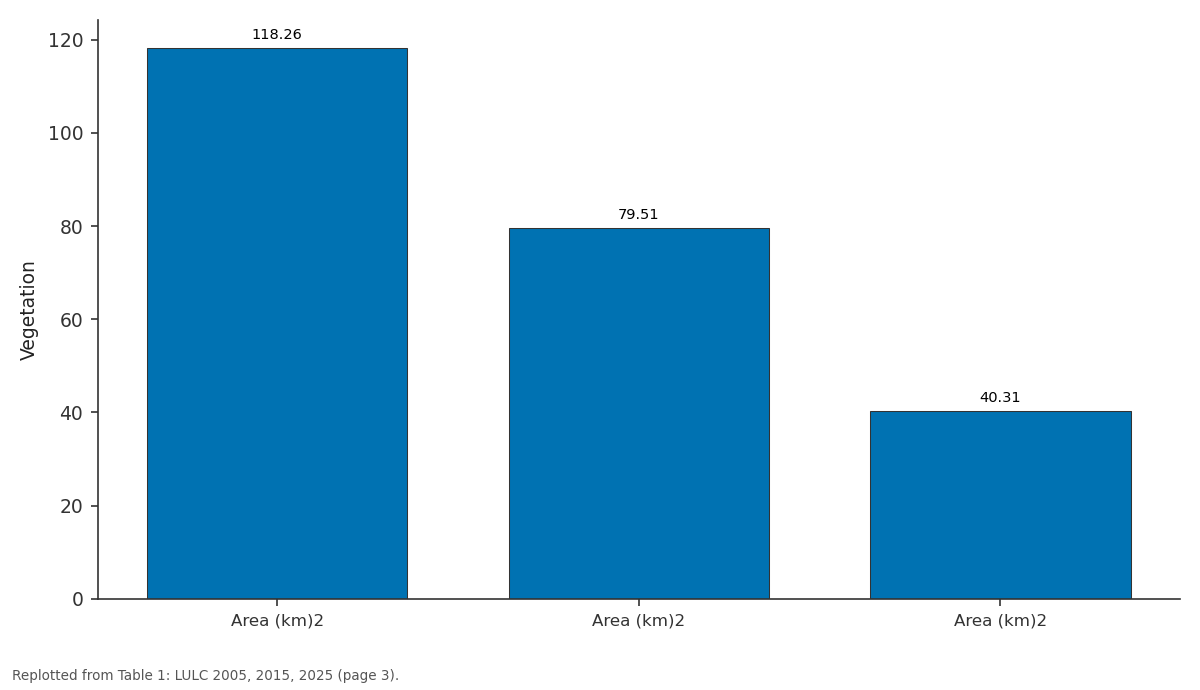
Vegetation: Area (km)2 vs Area (km)2 vs Area (km)2
Replotted from Table 1 (page 3) of the original paper. Every bar is the paper's own table value.
View source evidence ↗Figures & tables
From the original paper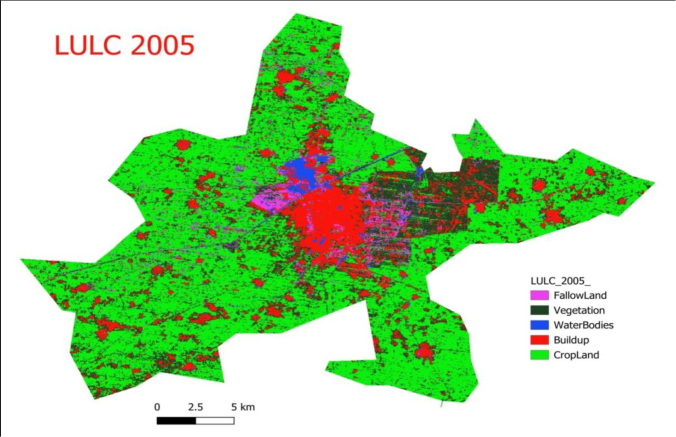 Figure 1
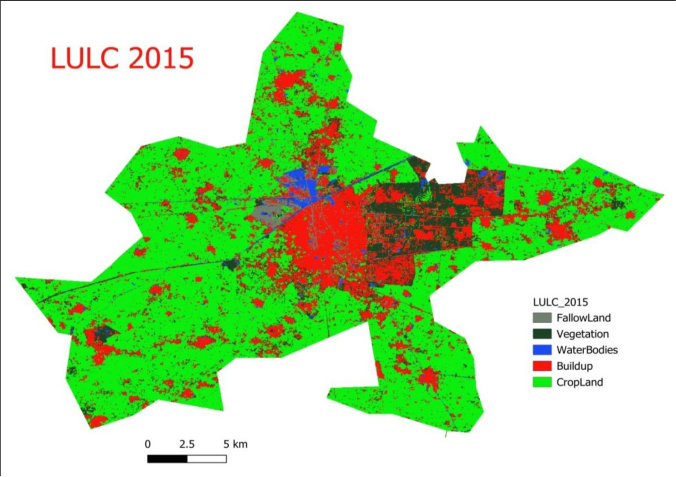 Figure 2
 Table 1
 Table 2
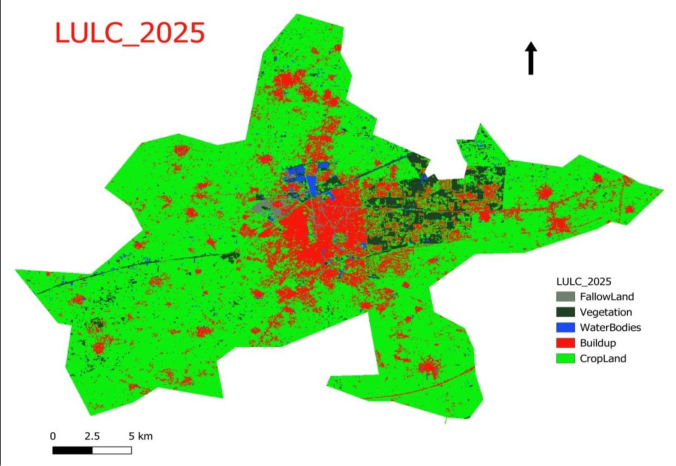 Figure 3
Introduction
Land-use Land-cover(LULC) becomes an important component to manage resources and to make policies for sustainable development. Remote Sensing and GIS have major role in analyzing LULC changes. The rapid urbanization leads to the expansion of cities and the changes in patterns of land-use. The Expansion of Urban Built-up on Agricultural areas does not alter only LULC but makes an impact on local Environment also.
Haphazard growth leads to not only the deterioration of Environment but also have economic, social and health implications. Therefore, LULC analysis has importance in academia, policy making and future planning. Area of Study The current study focuses on Bathinda city Local Planning Area (LPA). Bathinda city is the headquarter of Bathinda District of Punjab, located in south western part of Punjab State of India.
Located at the coordinates of 30°4’30’’ N. to 30°21’20’’N and 74°47’50’’E to 75°10’00’’ E. Bathinda is famous for its semiarid Climate, Historical roots, fort ‘Qila Mubarak’, Cantonment, Railway Junction and more for its growth, for instance, the establishment of All India Institute of Medical Sciences (AIIMS) and Central University of Punjab(CUPB). The shape file of study area is created by taking ‘Bathinda: proposed land- use plan 2009-2031’, a map prepared by Punjab Urban Development Authority (PUDA) as base Map. The research coversa total of 574.27 km2 area in its analysis.
Bathinda LPA along with Bathinda City includes two towns, Bhucho Mandi and Goniana Mandi and 46 villages. It is important to note that the Physiographical Bathinda LPA has primarily sandy soils. There is no major river in the area; only Bathinda Branch of Sirhind Canal flows through the study area. Temperatures range from as high as 48º C in Summers to as low as 0º C in Winters.
Due to Semi-Arid Climate, rainfall is relatively low as compared to North -Eastern parts of the Punjab.
Methodology
Landsat 7 and Landsat 8 images for the years of 2005, 2015 and 2025 are used for the present study to analyze the changes in LULC in last three decades. NAAS Rating (2025): 4.5 IJGGE 2025; 7(9): xx-xx Amanpreet Singh Assistant Professor, Department of Geography, Govt. Rajindra College, Bathinda, Punjab, India Dr. Lakhveer Singh Assistant Professor, Department of Geography, Govt.
Rajindra College, Bathinda, Punjab, India Jaskaran Singh Assistant Professor, Department of History, Govt. Rajindra College, Bathinda, Punjab, India Amanpreet Singh Assistant Professor, Department of Geography, Govt. Rajindra College, Bathinda, Punjab, India https://www.geojournal.net The images are first filtered for Cloud Cover less than5% and median is taken to Google Earth Engine. True and False Color composite images are created by assigning suitable bands to each channel (Red, Green, and Blue).
A Supervised Classification method is exploited to train the algorithm for five major land-use and land-cover classes of ‘Water- bodies’, ‘Built-up’, ‘Crop-land’, ‘Vegetation’ and ‘Fallow- land’ in GEE. About 100 training samples for each class are taken and 70:30 ratio is used for training and testing. Assigned training samples are cross verified through truth ground points by visiting in the field and with the help of satellite view of Google Earth pro. Smile Random Forest classifier is employed to classify data.
Error matrix and Kappa statistics for all images are created in GEE.
Results
and Analysis The classified images for each study year are presented in figure 1, 2, and 3. The overall accuracy of each year’s classification is 86.3%, 93.3%, and 94.5% with Kappa coefficient Fig 1: LULC 2005 0.823, 0.91 and 0.95 for the years of 2005,2015 and 2025. The Attribute table prepared from these images demonstrates area under each Class in km2. Crop-land with area of 329.88 km2 (57.44%) in 2005, 345.64. km2 (60.19%) in 2010 and 367.56km2 (64.00%) in 2025 remains at first rank.
Second rank was occupied by Vegetation in 2005 with area of 118.26 km2 (20.59%) but ended up at third rank in 2025 with significant loss of area under it which remains only at 40.31 km2 (7.02%). Built-up which was at third rank in 2005 with an area of 90.99 km2 (15.84%) shows constant increase in area with 123.26 km2 (21.46%) in 2015 and ended up at second rank in 2025 with significant increase of area under it, that is 151.75km2 (26.42%). There can be seen continuous decrease of area under Fallow-land because of reclamation of land for agriculture and Built-up. The artificial Lakes near Thermal Plant, small pounds, Bathinda Canal andstagnant water in low laying areas were major Water-Bodies in study area in 2005.
The recent reclamations of land from stagnant water in low laying areas causes decline in area under Water Bodies. Fig 2: LULC 2015 https://www.geojournal.net Fig 3: LULC 2025 Area under Vegetation continues to decrease mainly because of the pressure of Built-up and the clearing of land by farmers for cultivation. Large part of vegetation remains concentrated in pockets in Cantonment and at the banks of Bathinda Canal in 2025 whereas most of the vegetation in rural areas is now cleared for agriculture. Fallow Land at the vicinity of the city which was used for ash deposition from thermal power plant and other Industries also decreases due to reclamation by housing projects.
The fallow land in rural areas is also decreased due to continuous expansion of agriculture and allied activities. Punjab is known for its fertile soil and agricultural activities. It is also important to remember that agriculture boosts its economy at large scale.. Therefore, one can witness an intensive increase in agricultural activities and farm output after Green Revolution of 1960s in Punjab.
The study also shows the same trend with progressive increase of area brought under agriculture by farmers. This increase in Crop- land is due to bringing up of Fallow-land, Barren land and Natural Vegetation areas under agriculture. Urban Growth of Bathinda City and its satellite towns to their fringe areas leads to major shift in land-use patterns around the city. The City is continuously spreading to all directions.
Industrial Units, new Residential Colonies and Commercial Colonies are establishing in suburbs on Crop Land. From 2005 to 2025, there is an upsurge of 60.76 km2 (66.78%) in Built-up category. In 2025, Built-up covers 10 % more Geographical area than 2005. The recent decadal trend (2015-25) demonstrates that all the Land Use types are losing area except Crop-Land and Built-up.
Expansion of the city is observed along the Major Roads viz. Bathinda- Dabwali road, Bathinda-Faridkot road, Bathinda-Mansa road and Bathinda -Chandigarh highway. Table 1: LULC 2005, 2015, 2025 LULC Classes 2005 2015 2025 Area (km)2 Area (%) Area (km)2 Area (%) Area (km)2 Area (%) fallow Land 24.50 4.27 15.41 2.68 7.07 1.23 Vegetation 118.26 20.59 79.51 13.85 40.31 7.02 waterbodies 10.64 1.85 10.46 1.82 7.58 1.32 Buildup 90.99 15.84 123.26 21.46 151.75 26.42 Cropland 329.88 57.44 345.64 60.19 367.56 64.00 Source: Computed from Classification Images. Table 2: LULC changes from 2005 to 2025 LULC Classes Change in Change in Change in 2005-2015 2015-2025 2005-2025 Change in Area (km)2 Area (%) Change in Area (km)2 Area (%) Change in Area (km)2 Area (%) fallow Land -9.09 -37.08% -8.34 -54.10% -17.43 -71.12% Vegetation -38.75 -32.76% -39.20 -49.30% -77.95 -65.91% Waterbodies -0.19 -1.77% -2.88 -27.51% -3.07 -28.80% Buildup 32.27 35.46% 28.49 23.12% 60.76 66.78% Cropland 15.75 4.77% 21.93 6.34% 37.68 11.42% Source: Computed from Classification Images (TGA=Total Geographical Area).
| LULC Classes | 2005 | — | 2015 | — | 2025 | — |
|---|---|---|---|---|---|---|
| Area (km)2 | Area (%) | Area (km)2 | Area (%) | Area (km)2 | Area (%) | |
| fallow Land | 24.50 | 4.27 | 15.41 | 2.68 | 7.07 | 1.23 |
| Vegetation | 118.26 | 20.59 | 79.51 | 13.85 | 40.31 | 7.02 |
| waterbodies | 10.64 | 1.85 | 10.46 | 1.82 | 7.58 | 1.32 |
| Buildup | 90.99 | 15.84 | 123.26 | 21.46 | 151.75 | 26.42 |
| Cropland | 329.88 | 57.44 | 345.64 | 60.19 | 367.56 | 64.00 |
Table text extracted from the original PDF; superscript letters are shown inline. The original table image is below.
View original table image
Conclusion
Based on this study, it can be concluded that the Land Use Land Cover analysis of Bathinda Urbanised area (juxtaposition of City and its satellite towns) exhibits how a constant expansion of city along major Highways in multi- directions and on agricultural land around its periphery, https://www.geojournal.net resulting increased rates per square feet and expanding slum areas. Next, it is observed that the area under agriculture increases in rural parts of study area due to decrease in Vegetation and Fallow-land. The decreasing trend of Vegetation appears a sign of degrading environment in the study region. Decreasing area under agricultural land near City is correlated with horizontal expansion of Built-up areas.
It is the need of the hour that the policy makers must be conscious about the occurring changes in LULC around the study area while preparing plans for the development of region.
Introduction
to Human Impacts on the Environment. Chichester: John Wiley & Sons; 2013. 5. Vivekananda GN, Swathi R, Sujith AVLN. Multi- temporal image analysis for LULC classification and change detection.
Eur J Remote Sens. 2021;54(sup2):189-199. 6. Lillesand M, Kiefer RW, Chipman JW. Remote Sensing and Image Interpretation. 6th ed. Chichester: John Wiley & Sons; c2004. 7.
Kaushal SS, Gold AJ, Mayer PM. Land use, climate, and water resources—global stages of interaction. Water. 2017;9(10):815. 8. Ganaie TA, Jamal S, Ahmad WS.
Changing land use/land cover patterns and growing human population in Wular catchment of Kashmir Valley, India. GeoJournal. 2021;86(4):1589-1606. 9. Kaloop MR, Iqbal M, Elnabwy MT, Mustafa EK, Hu JW. A novel AI approach for modeling land surface temperature of Freetown, Sierra Leone, based on land- cover changes.
Int J Digit Earth. 2022;15(1):1236-1258. 10. Qacami M, Khattabi A, Lahssini S, Rifai N, Meliho M. Land-cover/land-use change dynamics modeling based on land change modeler. Ann Reg Sci. 2023;70:237- 258. 11. https://puda.punjab.gov.in/sites/default/files/PROPOSE D_batLPAlanduse.pdf 12. www.bdabathinda.in
References
4 in the original paper- Verburg PH, Kok K, Pontius RG, Veldkamp A. Modeling land-use and land-cover change. In: Lambin EF, Geist H, editors. Land-Use and Land-Cover Change: Local Processes and Global Impacts. Berlin/Heidelberg: Springer; c2006. p. 117-135.
- Kolb M, Mas JF, Galicia L. Evaluating drivers of land- use change and transition potential models in a complex landscape in southern Mexico. Int J Geogr Inf Sci. 2013;27(9):1804-1827.
- Wang J, Bretz M, Dewan MAA, Delavar MA. Machine learning in modelling land-use and land-cover change (LULCC): Current status, challenges and prospects. Sci Total Environ. 2022;822:153559.
- Goudie AS, Viles HA. The Earth Transformed: An