
Research article · 2025 · Full text
International Journal of Agriculture and Food ScienceAgricultural practices and livelihood strategies of tribes in Mayurbhanj district, Odisha
Volume 7(9) · Pages 502–510 · DOI: 10.33545/2664844x.2025.v7.i9g.785 ↗
Research areasCanadian Policy and GovernanceSAS software applications and methodsIsland Studies and Pacific Affairs
Abstract
Author-writtenTribal agriculture in Mayurbhanj district of Odisha reflects a unique blend of ecological adaptation, cultural tradition, and livelihood necessity. The indigenous communities, particularly the Santals, Bhumija, and Kolha, rely on time-tested farming practices such as shifting cultivation, mixed cropping, and organic soil management that are closely tied to their social and spiritual life. These practices not only ensure household food security but also sustain ecological balance in a resource-constrained environment. Agriculture continues to serve as the backbone of livelihoods, complementing forest-based subsistence activities and seasonal wage labor. A recent study conducted in three blocks of the district Khunta, Baripada, and Samakhunta underscored the central role of agriculture in tribal households while also revealing emerging challenges such as climate variability, declining land productivity, and policy constraints. The findings highlight the need for integrated strategies that preserve indigenous knowledge, strengthen food security, and promote sustainable agricultural development among the tribal communities of Mayurbhanj.
Summary
Source-checkedPlain-language reading of the full paper, prepared with AI and checked against the text. Each point links to the authors' own words.
Why it matters
- Mayurbhanj is the district in Odisha with the highest concentration of tribal populations, accounting for 58.7% of the population based on 2011 census data. View evidence ↗
- Tribal communities often lack access to modern agricultural technologies, which keeps them isolated from mainstream economic growth. View evidence ↗
- Agriculture for tribes in Mayurbhanj is a combination of cultural traditions, ecological adaptation, and a necessity for survival. View evidence ↗
The question
- The study aims to understand agricultural practices and livelihood strategies to identify strategies that can preserve indigenous knowledge and promote sustainable development. View evidence ↗
What they did
- The researchers collected data from tribal villages in selected blocks, with sample sizes reported between 1,140 and 1,175 households. View evidence ↗
- The study focused on three specific blocks: Khunta, Samakhunta, and Baripada. View evidence ↗
- A mixed-method approach was used, integrating field surveys with geospatial analysis to examine how slope conditions relate to livelihoods and farming. View evidence ↗
- Data analysis involved percentage analysis for agricultural engagement and Chi-square tests to study variations in occupation. View evidence ↗
What they found
- Land ownership is limited, with 9.7% of the population being landless and 47.3% owning less than 3 Mana of agricultural land. View evidence ↗
- Rice is the dominant crop in the region, with 68% of households engaged in its cultivation. View evidence ↗
- Sabai grass is a specialized crop grown by a much smaller portion of the population, specifically 26% of households. View evidence ↗
- A large majority of the total population (63.1%) depends on the labor and output of the tribal agricultural workforce. View evidence ↗
What it means
- The authors conclude that agriculture serves as the fundamental economic cornerstone for tribal communities in the Khunta and Samakhunta blocks. View evidence ↗
- The authors recommend addressing the specific challenges of agricultural workers to improve the region's overall economic stability and well-being. View evidence ↗
Visual summary
3 visualsIllustrations explain the paper; charts are replotted from the paper's own table values.
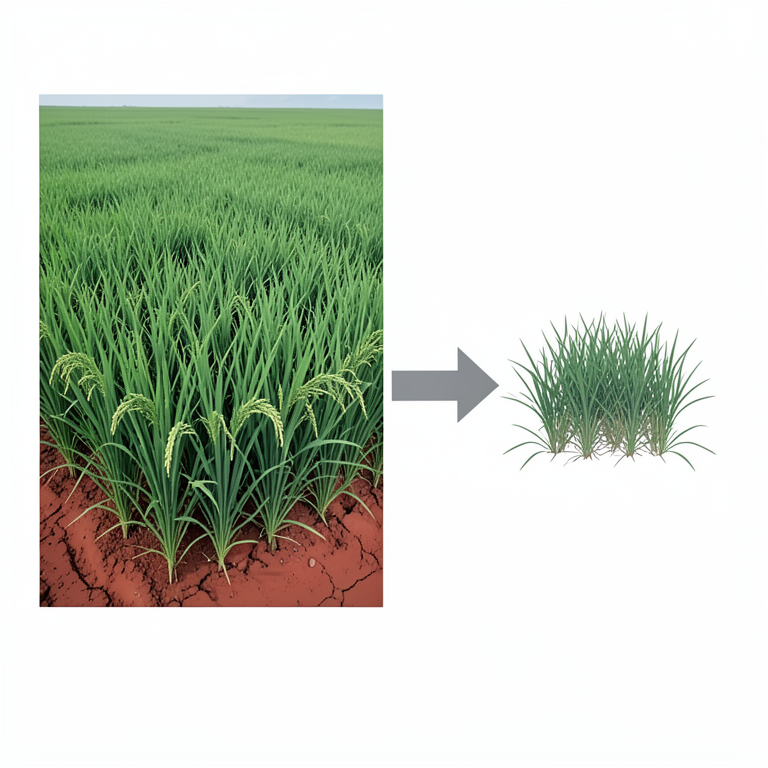
Crop Distribution Comparison
AI-generated conceptual illustration (Rice plants and Sabai grass in a rural Odisha landscape). It explains the idea and does not show study data.
View source evidence ↗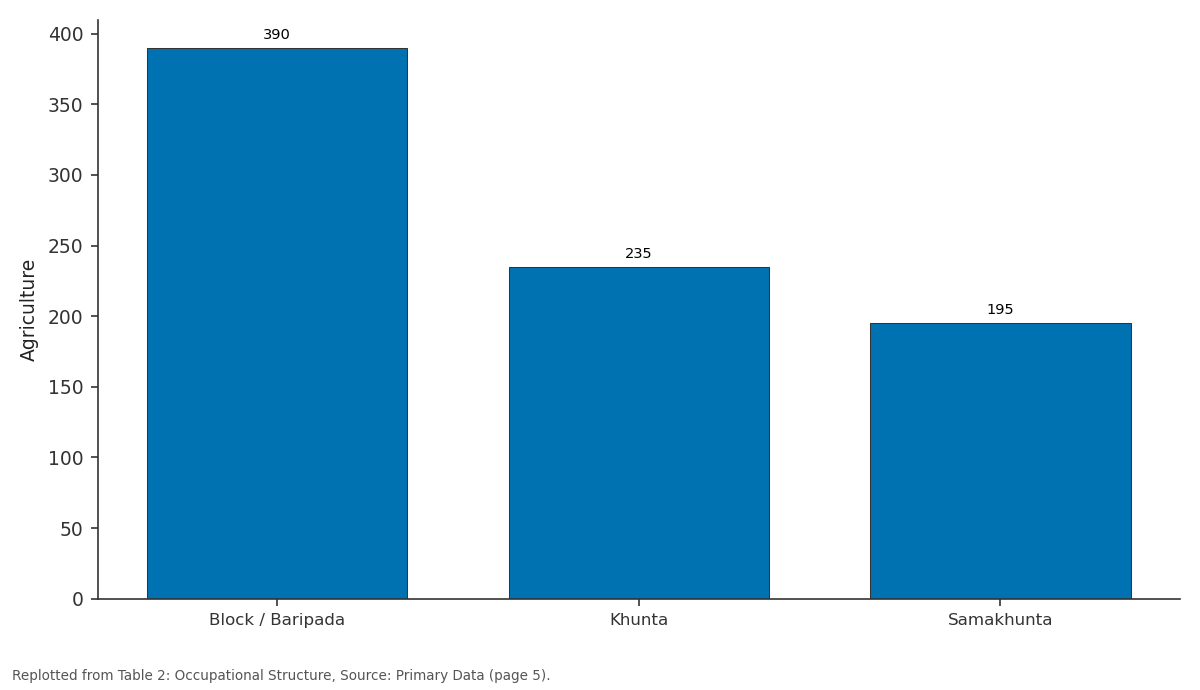
Agriculture: Block / Baripada vs Khunta vs Samakhunta
Replotted from Table 2 (page 5) of the original paper. Every bar is the paper's own table value.
View source evidence ↗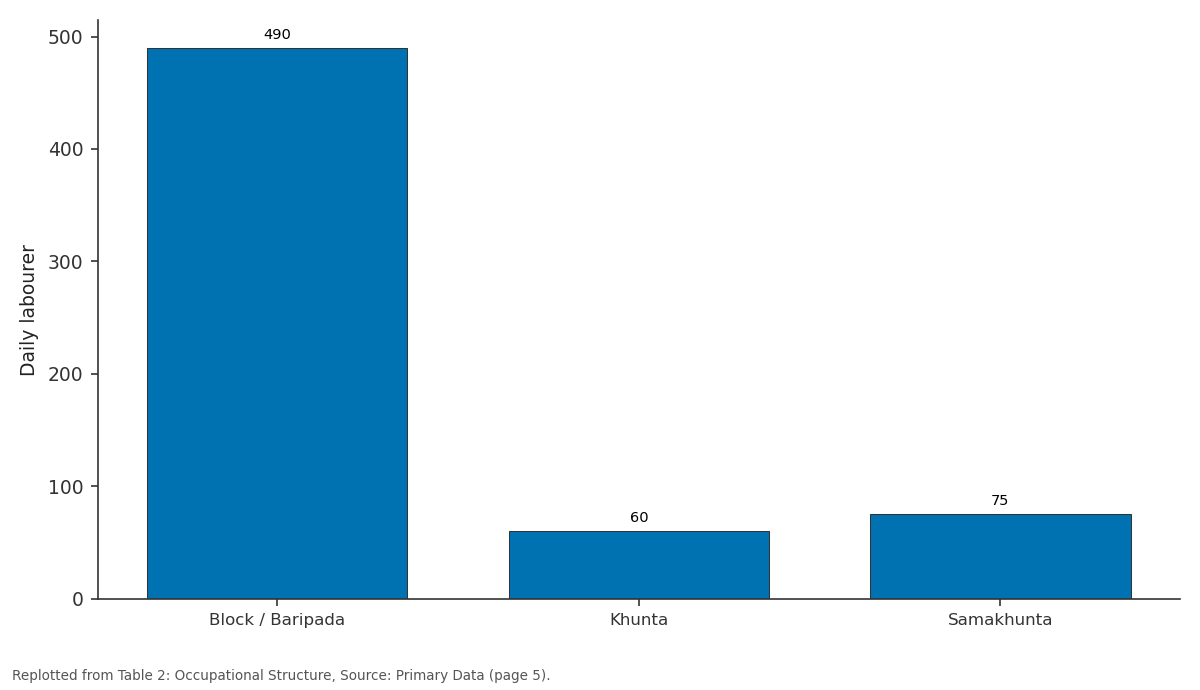
Daily labourer: Block / Baripada vs Khunta vs Samakhunta
Replotted from Table 2 (page 5) of the original paper. Every bar is the paper's own table value.
View source evidence ↗Figures & tables
From the original paper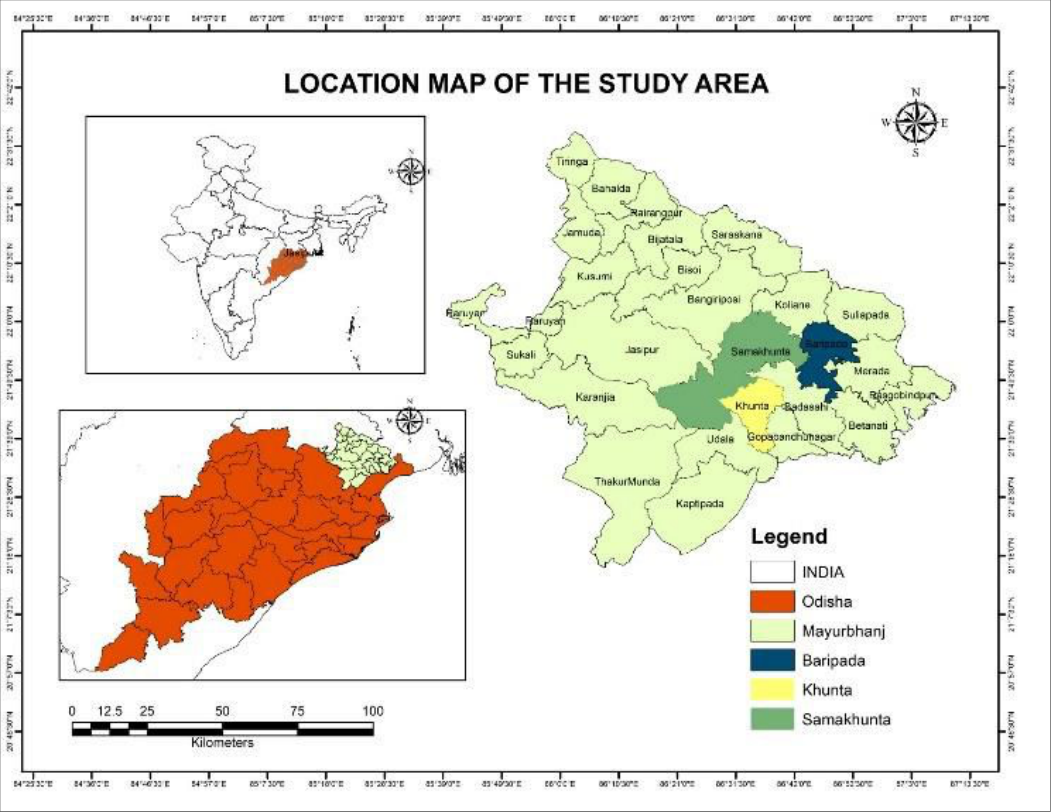 Fig. 1
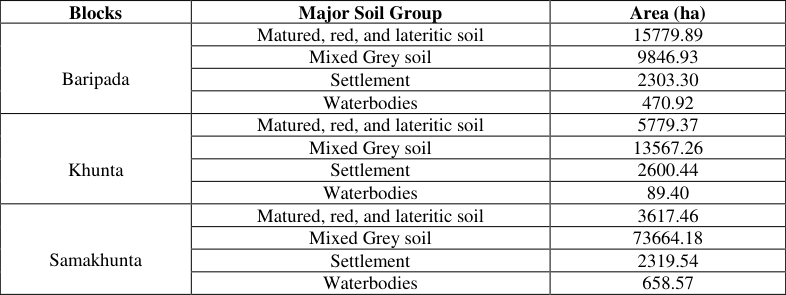 Table 1
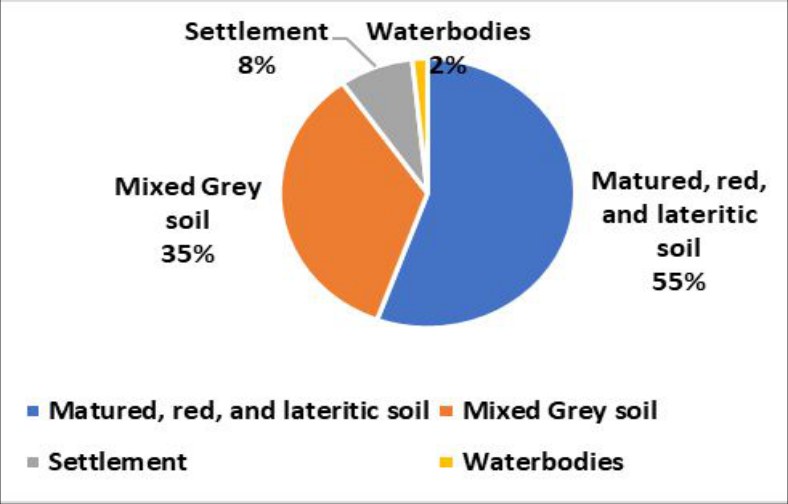 Fig. 2
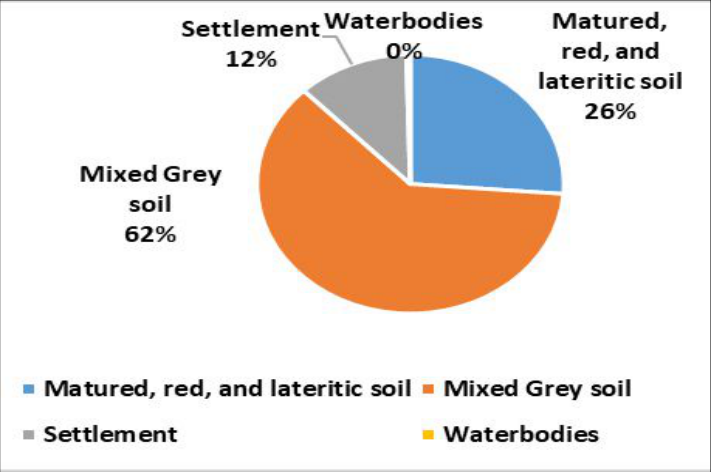 Fig. 3
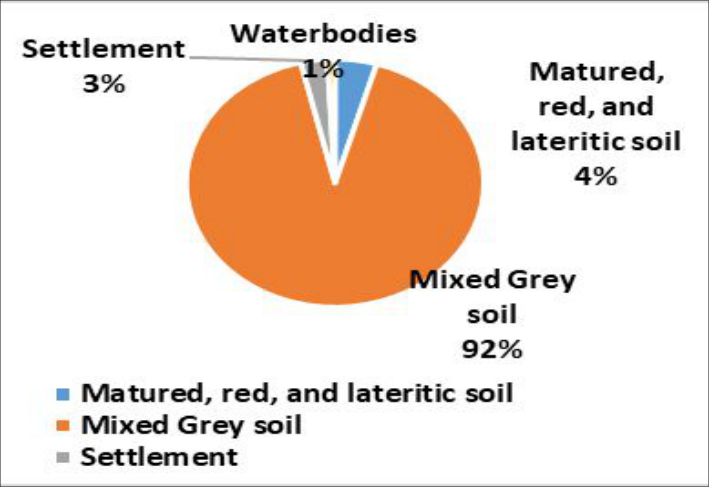 Fig. 4
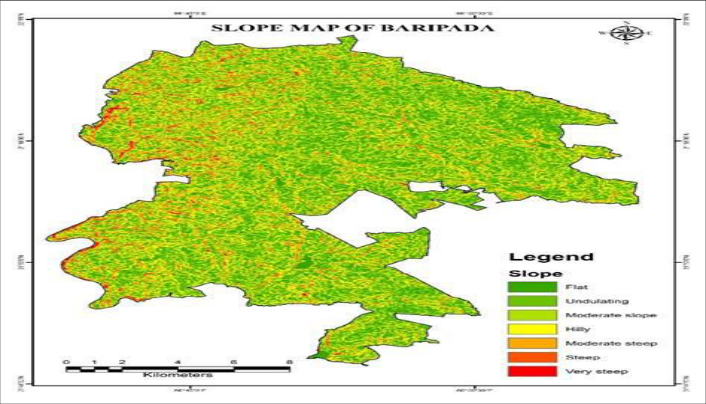 Fig. 4
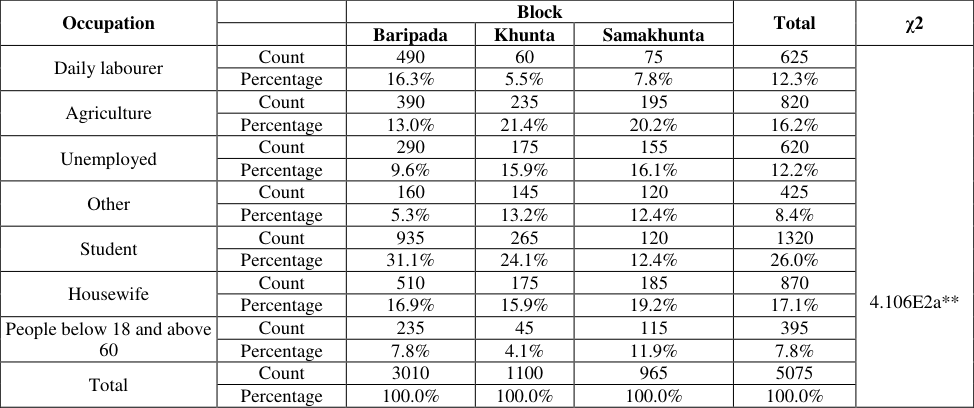 Table 2
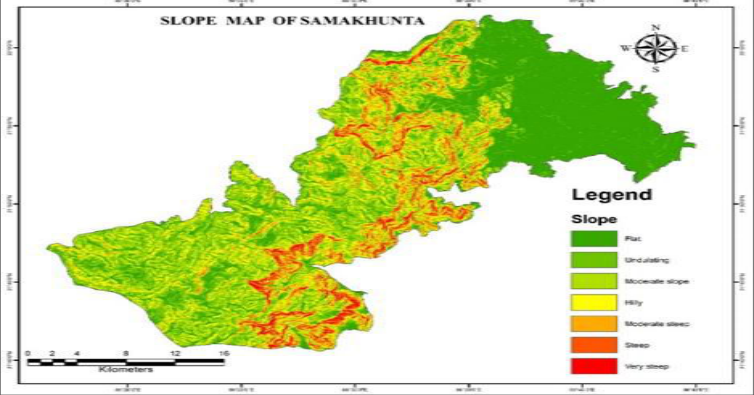 Fig. 5
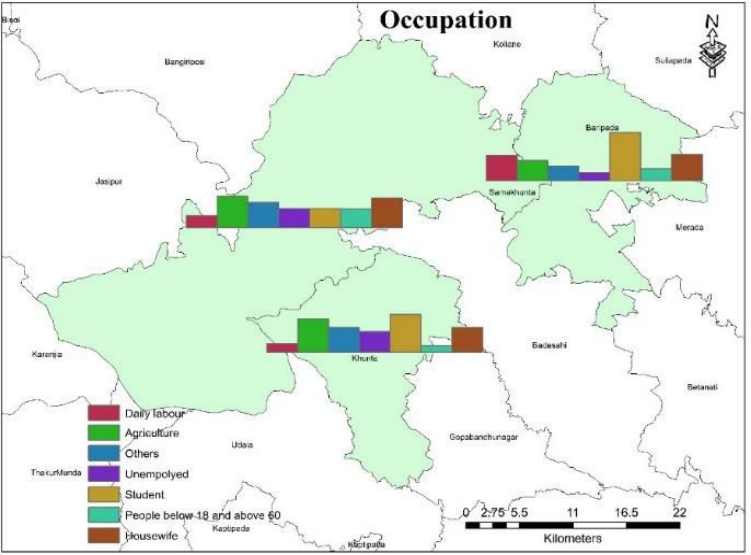 Fig. 6
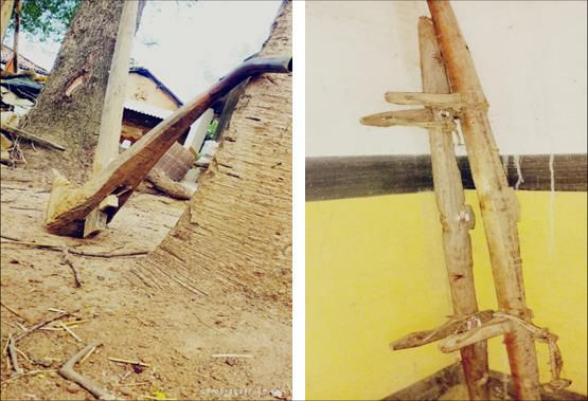 Fig. 7
 Table 3
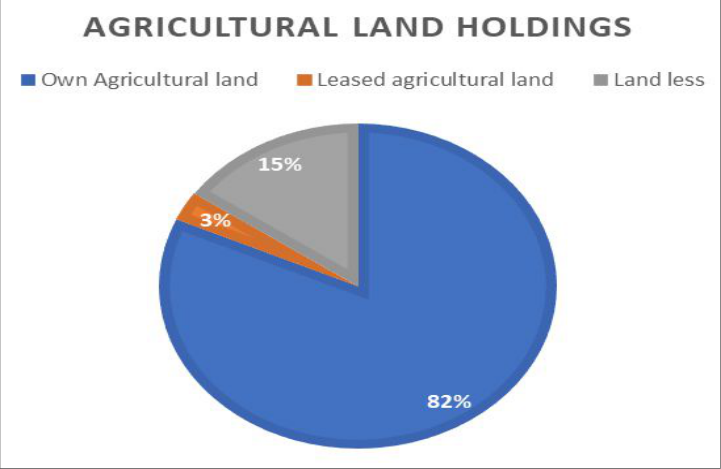 Fig. 8
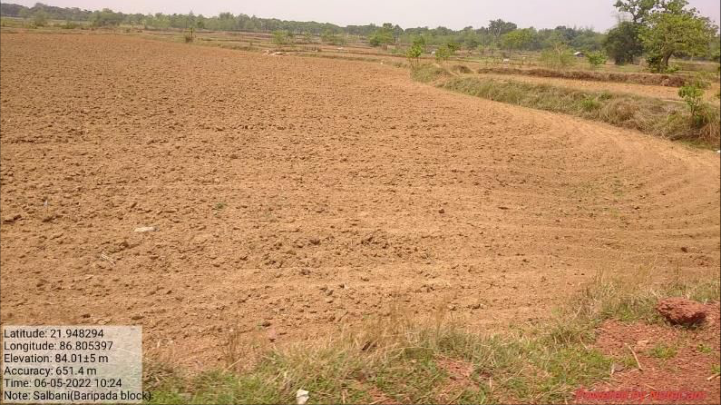 Fig. 9
 Table 4
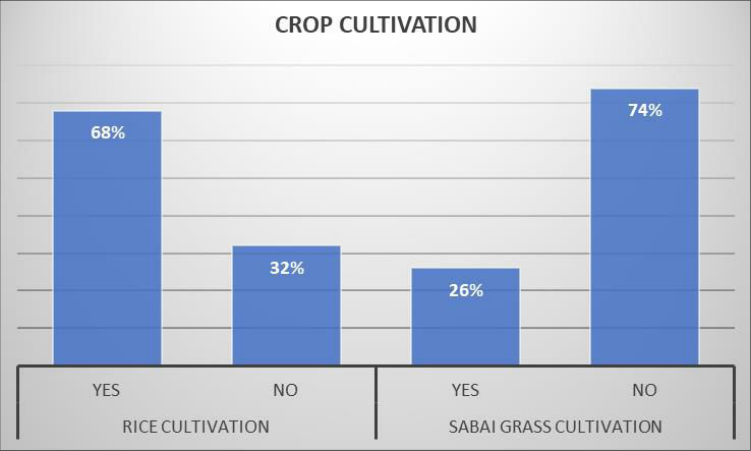 Fig. 10
Introduction
India is home to several indigenous tribes that maintain traditional ways of life (Singh, 2017) [17] . The tribe is a social group typically characterized by shared territory, language, cultural similarities, and social and political structures (Sinha, 1958) [18] . It often comprises various sub-groups. In India, a group is officially recognized as a Scheduled Tribe when it is designated as such under Article 342 of the Indian Constitution (Maurya, 2022) [9] . One area where targeted development efforts can be beneficial is agriculture, particularly for tribes involved in farming (Mandi & Chakravarty, 2020) [8] . Many tribal communities have limited exposure to modern agricultural technologies and remain outside the mainstream economic progress (Shamna et al., 2018) [16] . Mayurbhanj is the highest tribal concentrated district of Odisha, with 58.7% according to the 2011 census (Sahoo et al., 2017) [14] . The data was collected from 1140 households from 14 tribal villages of selected Blocks to understand the agricultural practices. Tribal farmers in Mayurbhanj typically employ a range of traditional agricultural techniques well-suited to their unique environmental conditions (Pattnayak & Sagarika, 2022) [10] . Among these methods, shifting cultivation, often called slash-and-burn agriculture, was a prominent practice in the ancient period (Tangjang, 2009) [19] . This technique involves clearing a section of forest or woodland by cutting down and burning vegetation. The resulting ash enriches the soil with essential nutrients, which support crop growth for a few years. After the soil's fertility diminishes, the farmers move to a new area, allowing the previously used land to naturally regenerate (Heinimann et al., 2017) [4] . Now slash-and-burn agriculture has declined. Jana, Banerjee & Ghosh, (2022) [5] explained the sustainable livelihood condition of tribes in Mayurbhanj that the dominant economic activities are cultivation, agricultural labourer, and industrial labourer. Furthermore, these farmers utilize organic fertilizers to enhance soil fertility. These natural fertilizers, which can include compost, manure, and other organic matter, are used to enrich the soil and improve its structure (Verma, 2019) [20] . This approach not only contributes to sustainable farming practices but also helps to maintain the long-term health of the soil. In Mayurbhanj, local agriculture is characterized by the cultivation of rice, millet, maize, and pulses, all of which thrive in the region's climate and soil (Ray & Patro, 2016) [12] . The area also supports livestock farming, with cattle, goats, and poultry being commonly raised (Kumar, 2020) [7] . These animals play a crucial role in the agricultural economy, offering vital resources and supporting the livelihoods of the community. In tribal Mayurbhanj, agriculture goes beyond being a mere economic pursuit; it is deeply woven into the social and cultural life of the community. Agricultural practices are closely linked with rituals, festivals, and ancestral knowledge, all of which influence how crops are grown and managed. These cultural elements are integral to the farming process, reflecting the rich traditions and values of the tribal society. Modernization had a greater impact on non-tribal people's sustainable livelihoods than on tribal communities Prajapati, et al. (2014) [11] . Tribal agriculture encounters numerous obstacles, such as restricted access to advanced technology, insufficient infrastructure, and the impacts of climate change. Despite these difficulties, tribal farmers have crafted innovative solutions, relying on their traditional knowledge to adapt and sustain their customary practices. This approach helps them navigate the challenges while preserving their unique agricultural heritage.
Study area: The present study was carried out in Mayurbhanj district, which lies in the northern part of Odisha and covers an area of about 10,418 square kilometers. Baripada, the district headquarters, serves as the main administrative center. Geographically, the district is located between 21°17′-22°34′ N latitudes and 85°40′-87°10′ E longitudes. Mayurbhanj is landlocked, bordered by Jharkhand and West Bengal in the north and northeast, and by other districts of Odisha along its southern and western boundaries. Topographically, the district is characterized by undulating uplands, fertile valleys, and hilly terrain, forming part of the Chotanagpur Plateau extension. Its climate is tropical with distinct seasonal variations, and the monsoon plays a crucial role in supporting rainfed farming. A large portion of its population belongs to tribal communities, whose livelihoods are closely associated with subsistence farming, shifting cultivation, and forest-based activities.
For the present research, three blocks Khunta, Samakhunta, and Baripada were selected as the study area. These blocks were chosen because they represent diverse physiographic settings and a high concentration of tribal population engaged in agriculture. The variation in slope, soil profile, and land use across these blocks provides a suitable framework for analyzing how environmental conditions influence tribal agricultural practices and livelihood strategies.
Materials and Methods
The study employed a mixed-method approach combining geospatial analysis and field-based surveys to understand the link between slope conditions, agricultural practices, and livelihoods in Mayurbhanj district. Satellite imagery was processed in ArcGIS to generate slope maps and categorize terrain suitability, while household surveys using structured questionnaires and interviews provided information on occupation and agricultural dependence. Secondary data from government records and soil surveys were used to assess soil characteristics and fertility. The data were analyzed through statistical techniques, including Chisquare tests to examine occupational variations and percentage analysis to evaluate agricultural engagement. This integrated methodology allowed for a holistic assessment of how topography, soil profile, and socioeconomic factors shape tribal agriculture in the region.
Results and Discussion Soil Profile and Slope Analysis
The soils of Mayurbhanj district may broadly be classified into three major categories: Matured Red and Lateritic Soils (Alfisols), Mixed Grey Soils (Inceptisols), and Unaltered Coarse-Textured Soils (Entisols). Among these, red soils are further subdivided into three variants: Typical Red Soil, Red Loamy Soil, and Clay-Loam Soil. Typical Red Soil, which predominates in the hilly tracts of Bamanghaty and Panchpir subdivisions, is largely suited to the cultivation of paddy, millets, sabai grass, and other minor food crops (Kullu et. al, 2021) [6] . Red Loamy Soil, occurring along riverbanks, provides fertile conditions for early paddy varieties as well as cash crops such as groundnut, sesame, castor, black gram, and kulthi (Behera, 2016) [2] . In contrast, Clay-Loam Soil, concentrated in Kaptipada and Baripada subdivisions, supports medium and late varieties of paddy; however, these lands frequently remain fallow after the initial harvest, though pulses such as gram and oilseeds such as linseed are occasionally cultivated as secondary crops (Sahu & Mishra, 2013) [15] . Lateritic soils, occurring across the district's uplands and plateau regions, may be further divided into Laterite Morrum and Laterite Rocks. Both are of limited agricultural utility due to their poor fertility and shallow profile, restricting their productive potential (Rout & Behera, 2014) [13] . The majority of tribal livelihoods depend upon agriculture, either they work as a cultivator or agricultural labourer. The above analysis depicted that 16.2% of the total working population was engaged in agriculture and 12.3% of the tribe worked as daily labourers who are involved in agricultural work in the Khunta and the Samakhunta Blocks.
Where 63.1% of the population depends upon the working population of the tribes which is 36.9%.
Fig. 6: Figure showing occupational
Fig. 6: Figure showing occupational
Agricultural Practices
In the sample villages, tribal households classified as small and marginal farmers rely on a variety of traditional agricultural tools to carry out their farming activities. These implements, integral to their daily agricultural operations, include wooden and iron ploughs, yokes, harrows, levelers, bullock carts, and crowbars.
Wooden and iron ploughs are fundamental for tilling the soil, preparing it for sowing crops. Yokes, typically made from wood, are used to harness bullocks, facilitating tasks such as ploughing and hauling. Harrows and levelers, also traditional tools, are employed to break up soil clumps and create an even surface for planting. Bullock carts are essential for transporting goods and farm produce, while crowbars assist in digging and moving earth.
In contrast, wage earners and artisans within these tribal communities use a more limited set of tools, reflecting their different roles in the agricultural process. Their daily activities are typically supported by simpler, more common implements such as sickles and crowbars. Sickles are used for harvesting crops like rice and wheat, while crowbars aid in basic excavation tasks. This distinction in tool usage highlights the specialized nature of small and marginal farming versus the more generalized needs of wage earners and artisans. Each group's choice of implements aligns with their specific agricultural or labor tasks, demonstrating the diverse ways in which traditional tools are adapted to meet varying agricultural needs within the tribal communities .
Agricultural Landholdings
A uniform sampling was collected from three blocks of Mayurbhanj having three major tribal concentrations that is santal, Kolha, and Bhumjia provided information on household ownership and operational land holding size. The survey covered 1175 samples from 13 tribal villages of Mayurbhanj and collected information regarding whether there were any land operations during the last 1 year. It was concluded that 9.7% of the total people did not have land for agriculture whereas 47.3% of people had less than 3 Mana of agricultural land. Only 9% of the tribes have more than 6 Mana land for agriculture and allied activities. In contrast, the cultivation of Sabai grass, which is a more specialized crop, involves a much smaller proportion of the population. Only 26% of households participate in growing Sabai grass. This lower percentage suggests that while Sabai grass is of some importance, it does not have the same level of centrality in the region's agricultural practices as rice does. Sabai grass is often used for various traditional purposes, including crafting and construction, which may explain its cultivation among a smaller subset of the population. However, its limited cultivation compared to rice highlights the primary role of rice in the local agricultural economy. Overall, the data indicates a clear preference and dependency on rice farming in the study region, with Sabai grass cultivation serving a more niche role. This disparity reflects both the economic priorities and the agricultural practices of the local communities, with rice cultivation being a dominant feature of the region's farming landscape. The relationship between the working population and the broader community is also noteworthy. The data indicates that 63.1% of the total population is dependent on the agricultural output and labor provided by the tribal workforce. This significant dependence underscores how crucial agriculture is not just as an occupation but as a fundamental aspect of the region's socio-economic structure. The 36.9% of the population engaged in agricultural work plays a pivotal role in supporting the livelihoods of a larger proportion of the community.
In conclusion, agriculture is the cornerstone of the tribal economy in the Khunta and Samakhunta Blocks. The data illustrates that a majority of the tribal population is either directly involved in cultivation or contributes to the agricultural sector as laborers. This reliance highlights the essential nature of agricultural work in sustaining the community and the broader population's dependence on the agricultural labor force. Addressing the needs and challenges faced by those working in agriculture is crucial for maintaining and improving the economic stability and overall well-being of the region.
Figures and tables from the paper
| Blocks | Major Soil Group | Area (ha) |
|---|---|---|
| Baripada | Matured, red, and lateritic soil | 15779.89 |
| Mixed Grey soil | 9846.93 | |
| Settlement | 2303.30 | |
| Waterbodies | 470.92 | |
| Khunta | Matured, red, and lateritic soil | 5779.37 |
| Mixed Grey soil | 13567.26 | |
| Settlement | 2600.44 | |
| Waterbodies | 89.40 | |
| Samakhunta | Matured, red, and lateritic soil | 3617.46 |
| Mixed Grey soil | 73664.18 | |
| Settlement | 2319.54 | |
| Waterbodies | 658.57 |
Table text extracted from the original PDF; superscript letters are shown inline. The original table image is below.
View original table image
| Occupation | — | Block | — | — | Total | χ2 |
|---|---|---|---|---|---|---|
| Baripada | Khunta | Samakhunta | ||||
| Daily labourer | Count | 490 | 60 | 75 | 625 | 4.106E2a** |
| Percentage | 16.3% | 5.5% | 7.8% | 12.3% | ||
| Agriculture | Count | 390 | 235 | 195 | 820 | |
| Percentage | 13.0% | 21.4% | 20.2% | 16.2% | ||
| Unemployed | Count | 290 | 175 | 155 | 620 | |
| Percentage | 9.6% | 15.9% | 16.1% | 12.2% | ||
| Other | Count | 160 | 145 | 120 | 425 | |
| Percentage | 5.3% | 13.2% | 12.4% | 8.4% | ||
| Student | Count | 935 | 265 | 120 | 1320 | |
| Percentage | 31.1% | 24.1% | 12.4% | 26.0% | ||
| Housewife | Count | 510 | 175 | 185 | 870 | |
| Percentage | 16.9% | 15.9% | 19.2% | 17.1% | ||
| People below 18 and above 60 | Count | 235 | 45 | 115 | 395 | |
| Percentage | 7.8% | 4.1% | 11.9% | 7.8% | ||
| Total | Count | 3010 | 1100 | 965 | 5075 | |
| Percentage | 100.0% | 100.0% | 100.0% | 100.0% |
Table text extracted from the original PDF; superscript letters are shown inline. The original table image is below.
View original table image
| Size in Mana | Percentage |
|---|---|
| Land less | 9.7% |
| Less than 3 Mana | 47.3% |
| 3-6 mana | 34% |
| Above 6 Mana | 9% |
Table text extracted from the original PDF; superscript letters are shown inline. The original table image is below.
View original table image
| Parameters | Rice production in Quintal | — | Sabi grass Production | — |
|---|---|---|---|---|
| < 5 Quintal | > 5 Quintal | < 5 Quintal | > 5 Quintal | |
| No of Households | 705 | 135 | 275 | 100 |
| Percentage | 84% | 16% | 75% | 27% |
Table text extracted from the original PDF; superscript letters are shown inline. The original table image is below.
View original table image
References
20 in the original paper- Behera D, Kanungo AP, Prangya S, Paik S. Non-timber forest products (NTFPs) for sustainable livelihood of Indian tribals. Futur Trends Agric Eng Food Sci. 2024;3(10):75-81. doi:10.58532/V3BCAG10P2CH2.
- Behera M. Tribal agriculture and livelihoods in Odisha: Challenges and opportunities. Bhubaneswar: Odisha State Tribal Research Institute; 2016.
- Government of Odisha. District statistical handbook: Mayurbhanj. Bhubaneswar: Directorate of Economics and Statistics; 2021.
- Heinimann A, Mertz O, Frolking S, Christensen AE, Hurni K, Sedano F, et al. A global view of shifting cultivation: Recent, current, and future extent. PLoS One. 2017;12(9):e0184479. doi:10.1371/journal.pone.0184479.
- Jana NC, Ghosh PK. Socio-economic conditions and quality of life in the tribal areas of Orissa with special reference to Mayurbhanj District. Space Cult India. 2015;3(2):25-41. doi:10.20896/saci.v3i2.147. International Journal of Agriculture and Food Science https://www.agriculturaljournals.com
- Kullu A, Mohanty A, Prasad B, Rajasmita R, Dehury PP, Pani P, et al. Soil type as one of the major contributing factors for top ten agri-producing states of India. J ISSN. 2021;2766:2276.
- Kumar I. Scheduled Tribes of India and their constitutional safeguards. IOSR J Humanit Soc Sci. 2020;25(12):1-6. doi:10.9790/0837-25120106.
- Maurya A. Schedule Tribe in India: A Critical Study. Int J Law Manag Humanit. 2022;5(6):207.
- Lenka S, Satpathy A. A study on indigenous technical knowledge of tribal farmers in agriculture and livestock sectors of Koraput District. Indian J Ext Educ. 2020;56(2):66-69.
- Pattnayak M, Sagarika S. Globalization and changing pattern of the Santal community of Mayurbhanj District, Odisha. Emerg Trends Dev Res. 2022;29(1&2):3-12.
- Prajapati MM, Patel RN, Dhandhukia RD, Solnaki KD. Impact of agricultural modernization on sustainable livelihood among the tribal and non-tribal farmers. J Agric Ext Rural Dev. 2014;6(4):138-142. doi:10.5897/JAERD2013.0579.
- Ray M, Patro H. Crop planning using probabilistic approach for Mayurbhanj district of Odisha. Int J Agric Sci. 2016;ISSN 0975-3710.
- Rout SK, Behera D. Non-timber forest products and tribal livelihoods: A study in Odisha. J Rural Dev. 2014;33(3):345-362.
- Sahoo AK, Pradhan BB, Sahu NC. Determinants of financial inclusion in tribal districts of Odisha: An empirical investigation. Soc Change. 2017;47(1):45-64. doi:10.1177/0049085716685806.
- Sahu N, Mishra D. Shifting cultivation in eastern India: Practices, problems and policy options. Int J Soc Sci Interdiscip Res. 2013;2(6):102-112.
- Shamna A, Biswas P, Jha SK, Kumar S. Tribal farm women's participation in agriculture and factors influencing it: Evidence from West Bengal, India. J Agric Sci Technol. 2018;20:911-922.
- Singh BP. Biodiversity, tribal knowledge and life in India. Environ Soc Psychol. 2017;2(1):1-10.
- Sinha S. Tribal cultures of peninsular India as a dimension of little tradition in the study of Indian civilization: a preliminary statement. J Am Folklore. 1958;71(281):504-518.
- Tangjang S. Traditional slash and burn agriculture as a historic land use practice: A case study from the ethnic Noctes in Arunachal Pradesh, India. World J Agric Sci. 2009;5(1):70-73.
- Verma P, Singh D, Pathania IP, Aggarwal K. Strategies to improve agriculture sustainability, soil fertility and enhancement of farmers' income for the economic development. In: Soil Fertility Management and Sustainable Development. Singapore: Springer; 2019. p. 43-70. doi:10.1007/978-981-13-5904-0_3.