
Research article · 2025 · Full text
International Journal of Agriculture and Food ScienceAssessing the impacts of climate change on the desertification of southern Iraq
Volume 7(12) · Pages 444–451 · DOI: 10.33545/2664844x.2025.v7.i12f.1075 ↗
Research areasRemote Sensing in AgricultureTransboundary Water Resource ManagementHydrology and Drought Analysis
Abstract
Author-writtenThe global surface temperature has been increasing mainly due to increased greenhouse gas concentration and emissions, which in turn causes global warming and climate change. Iraq has been experiencing the impacts of climate change, but there are no detailed studies up to date, especially at the local scale. This study locally discusses the relationship between changes in climate factors (mainly temperature and rainfall) and land degradation in drought and desertification in southern Iraq. We used the region's historical temperature and rainfall data, including satellite images from 1988 and 2018, to understand the extent of land use, land cover change, and degradation over 30 years. To accurately assess the extent of desertification in the study area, we used unsupervised classification to analyze the two satellite images. We found that the annual average temperature consistently increased while the yearly average rainfall showed significant fluctuation in the study. Changes in temperature and precipitation have contributed considerably to drought, which has led to the expansion of desertification in southern Iraq. Results generally showed a clear relationship between the change in climatic factors and desertification. In addition, there was a significant increase in the land covered by dunes, but barren lands and wetlands have shown a noticeable decrease. We concluded that climate change combined with land degradation has caused an increase in the extent of desertification in the study area. Therefore, southern Iraq needs mitigation measures and strategies for climate change and desertification.
Summary
Source-checkedPlain-language reading of the full paper, prepared with AI and checked against the text. Each point links to the authors' own words.
Why it matters
- Global surface temperatures are rising primarily because of increased greenhouse gas emissions, leading to global warming and climate change. View evidence ↗
- Iraq and the Middle East are severely impacted by climate change, characterized by rising air temperatures, severe heat waves, erratic precipitation, and depleted water resources. View evidence ↗
- Desertification is defined as land degradation in arid, semi-arid, and dry sub-humid areas caused by factors such as human activities and climate change. View evidence ↗
The question
- The study aims to examine the local relationship between changes in temperature and rainfall and the resulting land degradation, drought, and desertification in southern Iraq. View evidence ↗
What they did
- The research focused on southern Iraq, specifically the Al-Muthanna and Dhi Qar governorates, covering the western desert plateau and sedimentary plain. View evidence ↗
- The researchers analyzed historical temperature and rainfall data alongside satellite imagery from 1988 and 2018 to assess land cover changes over a 30-year period. View evidence ↗
- Unsupervised classification was applied to the satellite images to accurately measure the extent of desertification. View evidence ↗
- The land classification categorized the area into four distinct classes: water bodies, wetlands, barren lands, and sand dunes. View evidence ↗
What they found
- Mean temperatures in the 21st century increased significantly compared to the 20th century, where the average for 1979-2008 was 24.51°C. View evidence ↗
- In 2018, temperatures at both the Samawah and Nasiriyah stations rose by more than 2°C above their respective yearly averages. View evidence ↗
- Annual rainfall showed significant fluctuations between 1973 and 2018; for instance, Samawah station recorded 247.9 mm in 2013 but only 29.7 mm in 2017. View evidence ↗
- Satellite classification revealed a significant increase in land covered by sand dunes, while areas of wetlands and barren lands decreased. View evidence ↗
- The study found a clear relationship between changes in climatic factors (temperature and rainfall) and the process of desertification. View evidence ↗
What it means
- The authors conclude that the combination of climate change and land degradation has increased drought and desertification in southern Iraq. View evidence ↗
- The authors recommend that southern Iraq implement mitigation measures and strategies to combat climate change and desertification. View evidence ↗
Visual summary
3 visualsIllustrations explain the paper; charts are replotted from the paper's own table values.
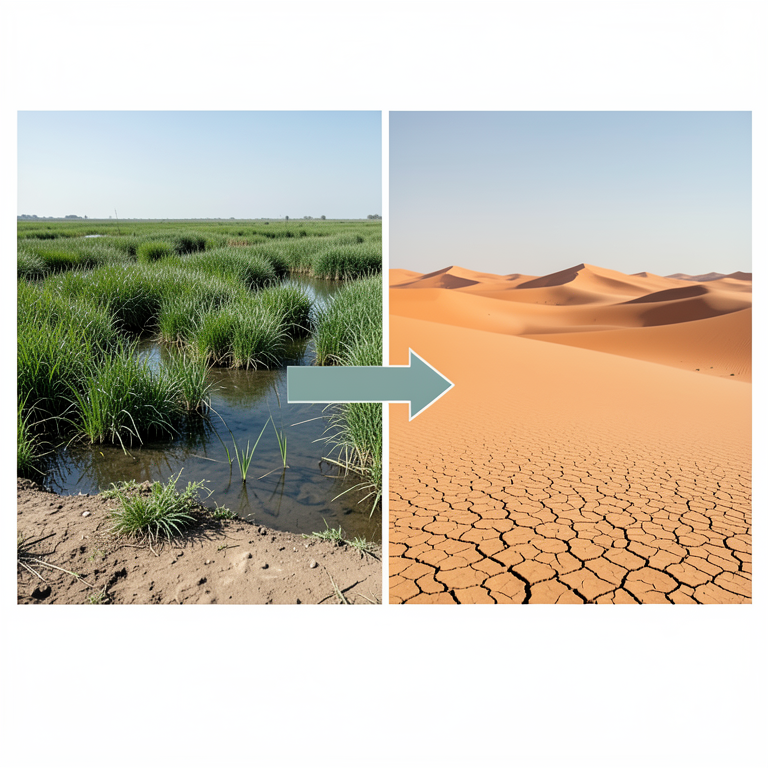
Land Cover Shift
AI-generated conceptual illustration (Southern Iraqi landscape featuring marshes and sand dunes). It explains the idea and does not show study data.
View source evidence ↗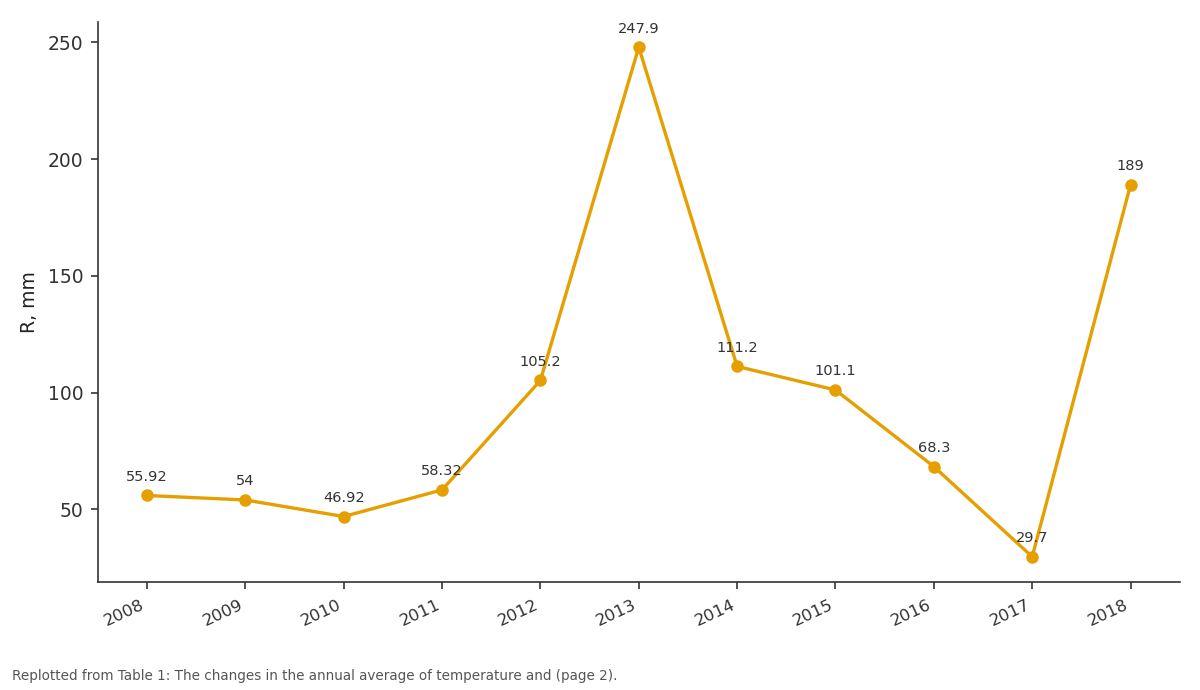
R, mm: 2008 vs 2009 vs 2010 vs 2011 vs 2012
Replotted from Table 1 (page 2) of the original paper. Every bar is the paper's own table value.
View source evidence ↗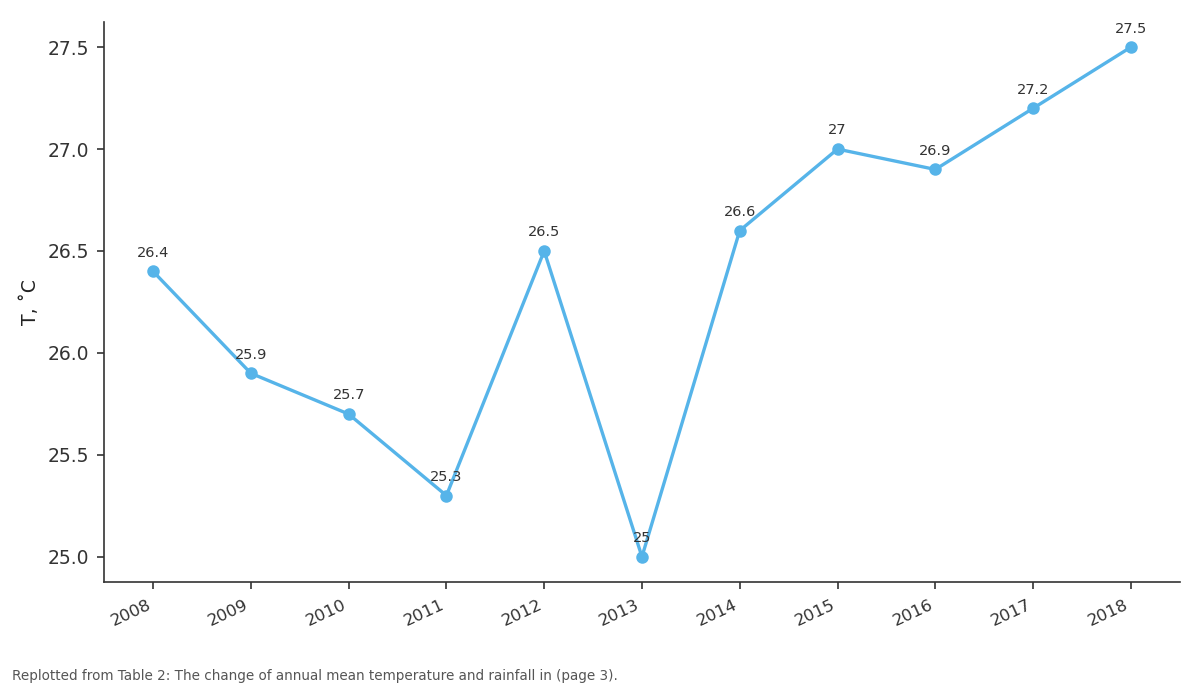
T, ˚C: 2008 vs 2009 vs 2010 vs 2011 vs 2012
Replotted from Table 2 (page 3) of the original paper. Every bar is the paper's own table value.
View source evidence ↗Figures & tables
From the original paper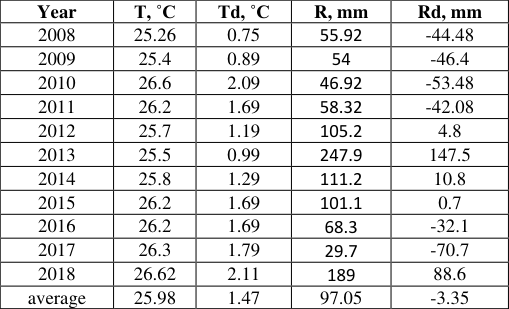 Table 1
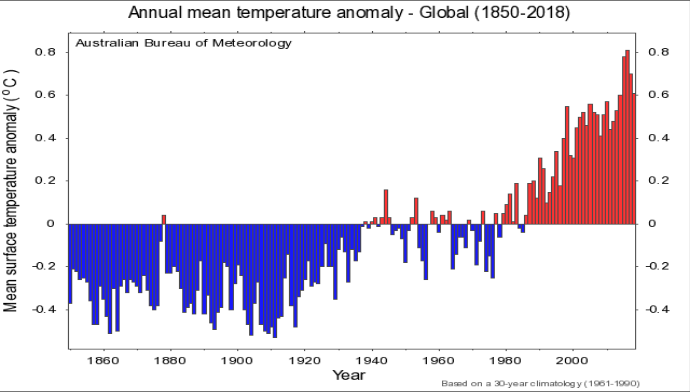 Figure 1
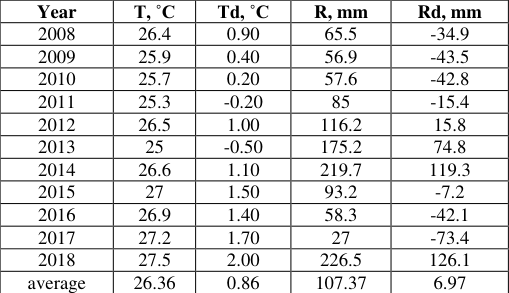 Table 2
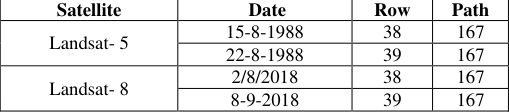 Table 3
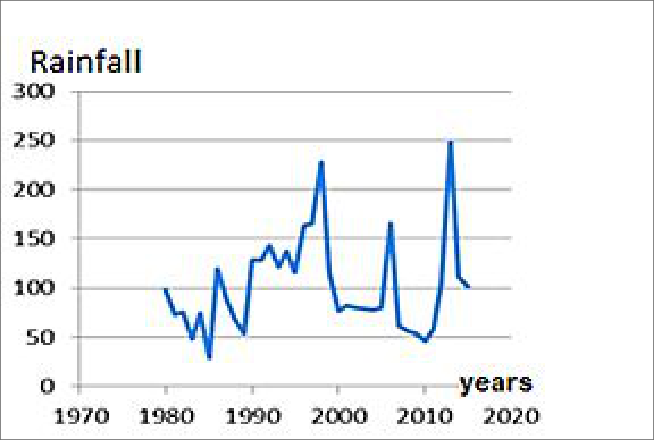 Figure 3
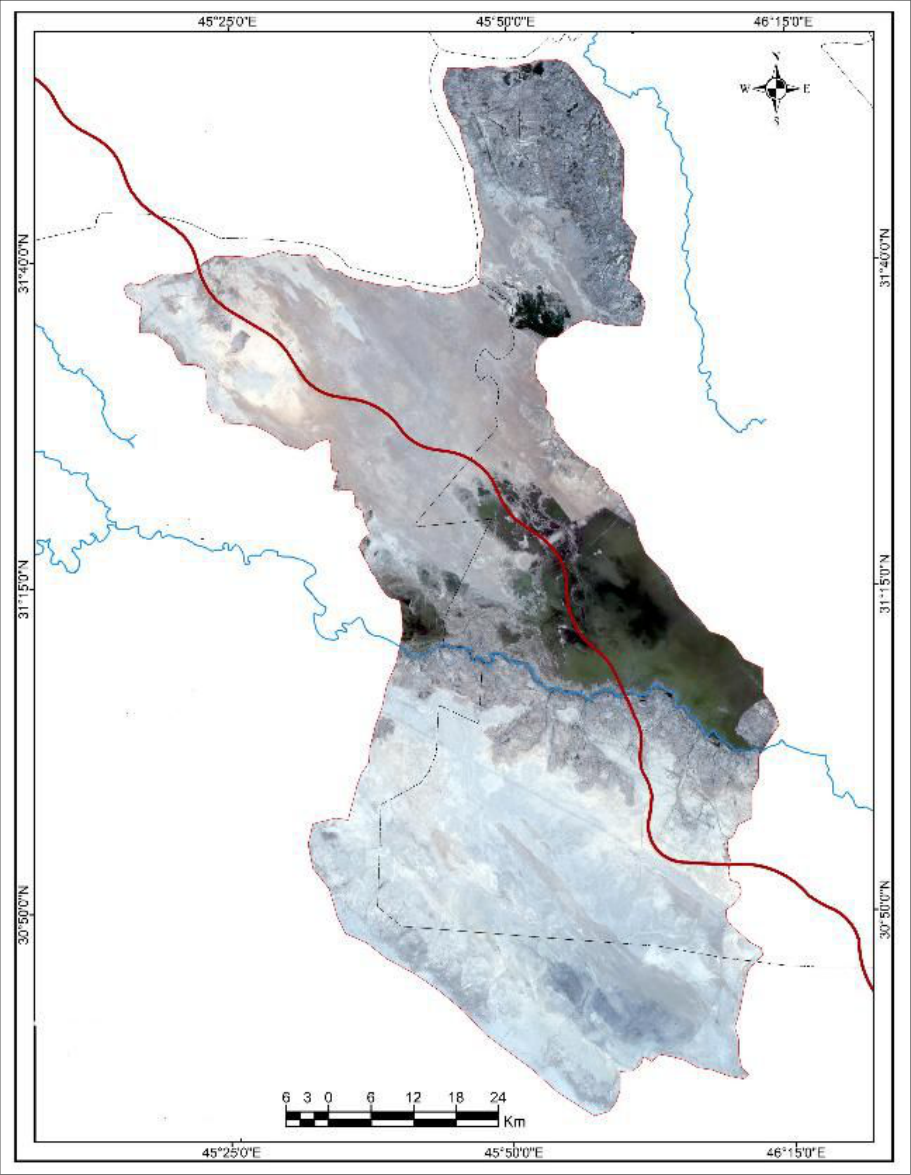 Figure 4
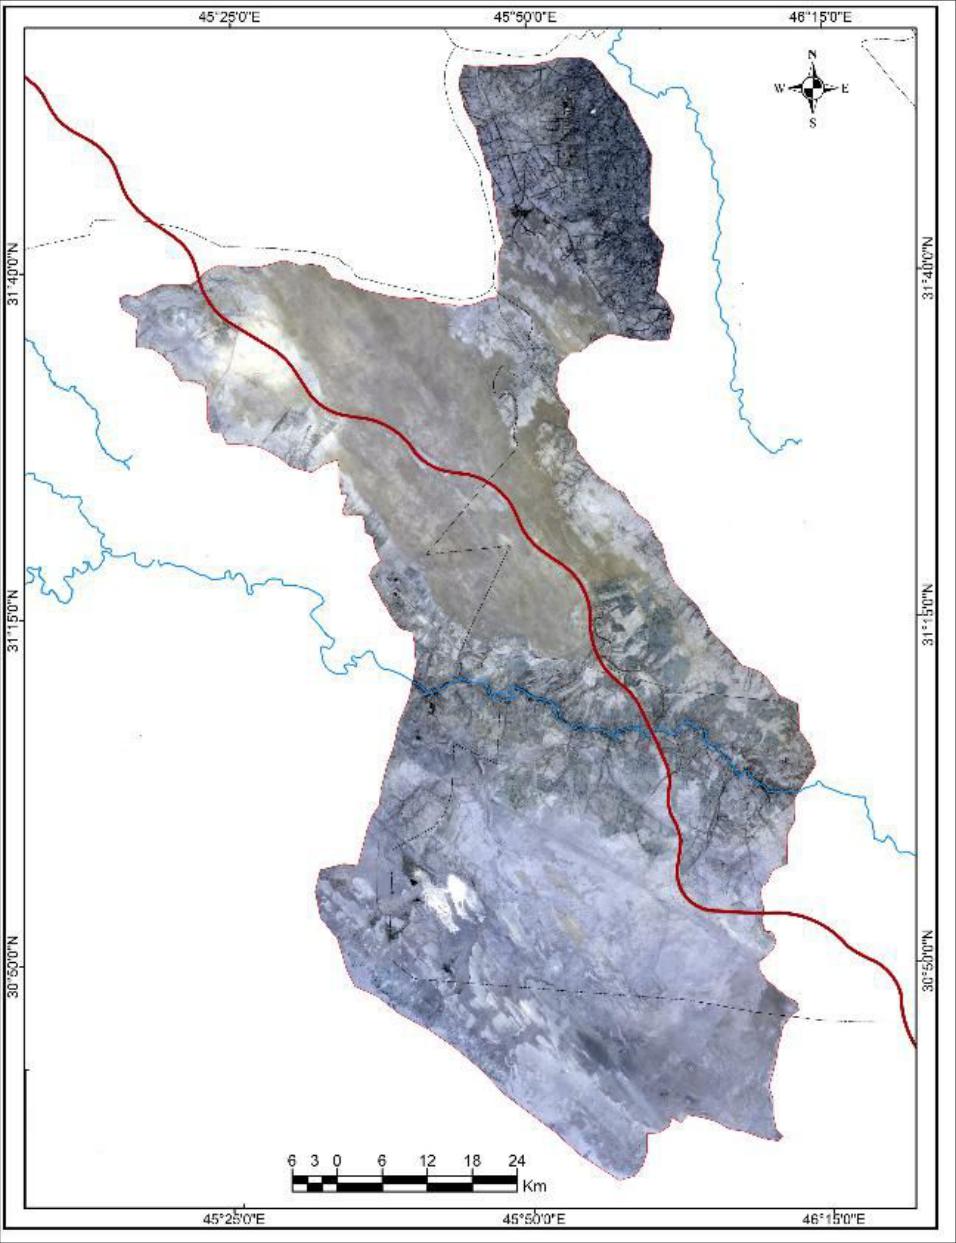 Figure 5
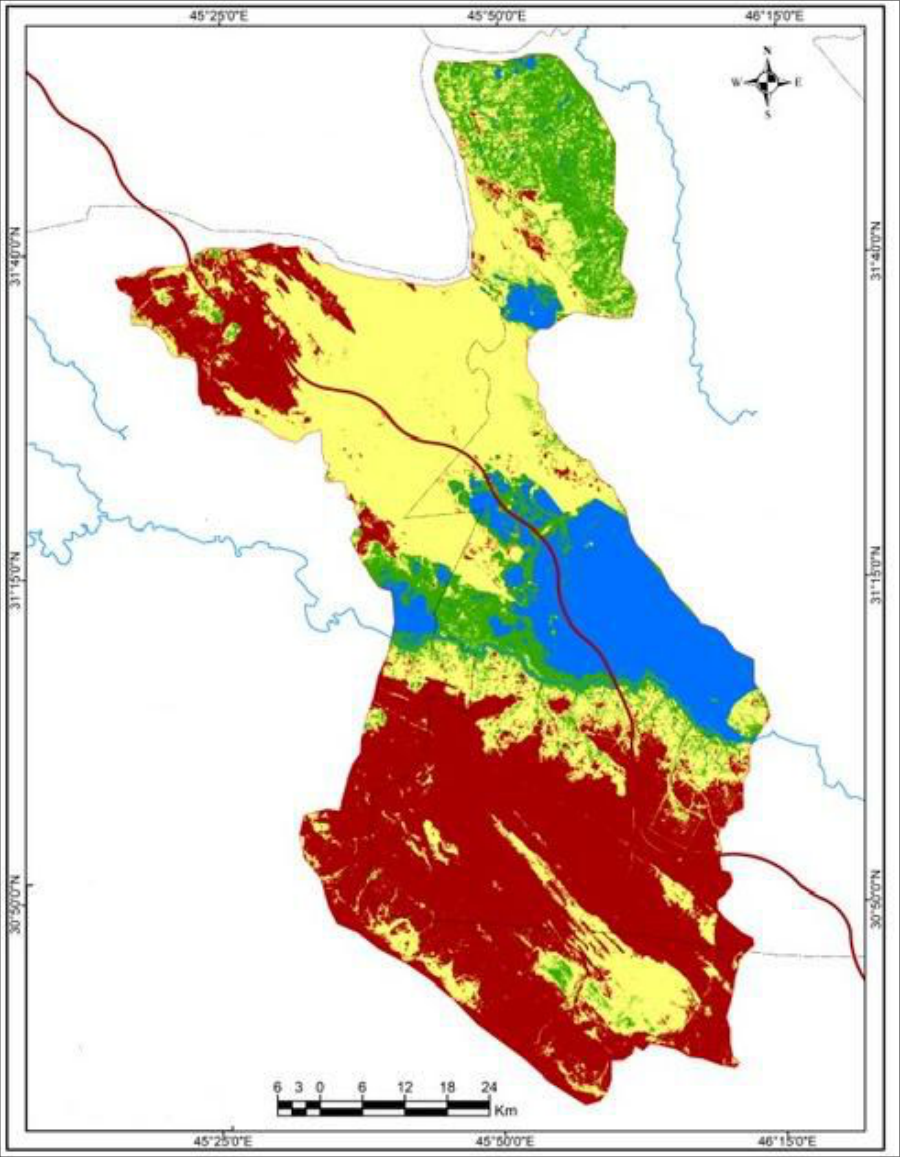 Figure 6
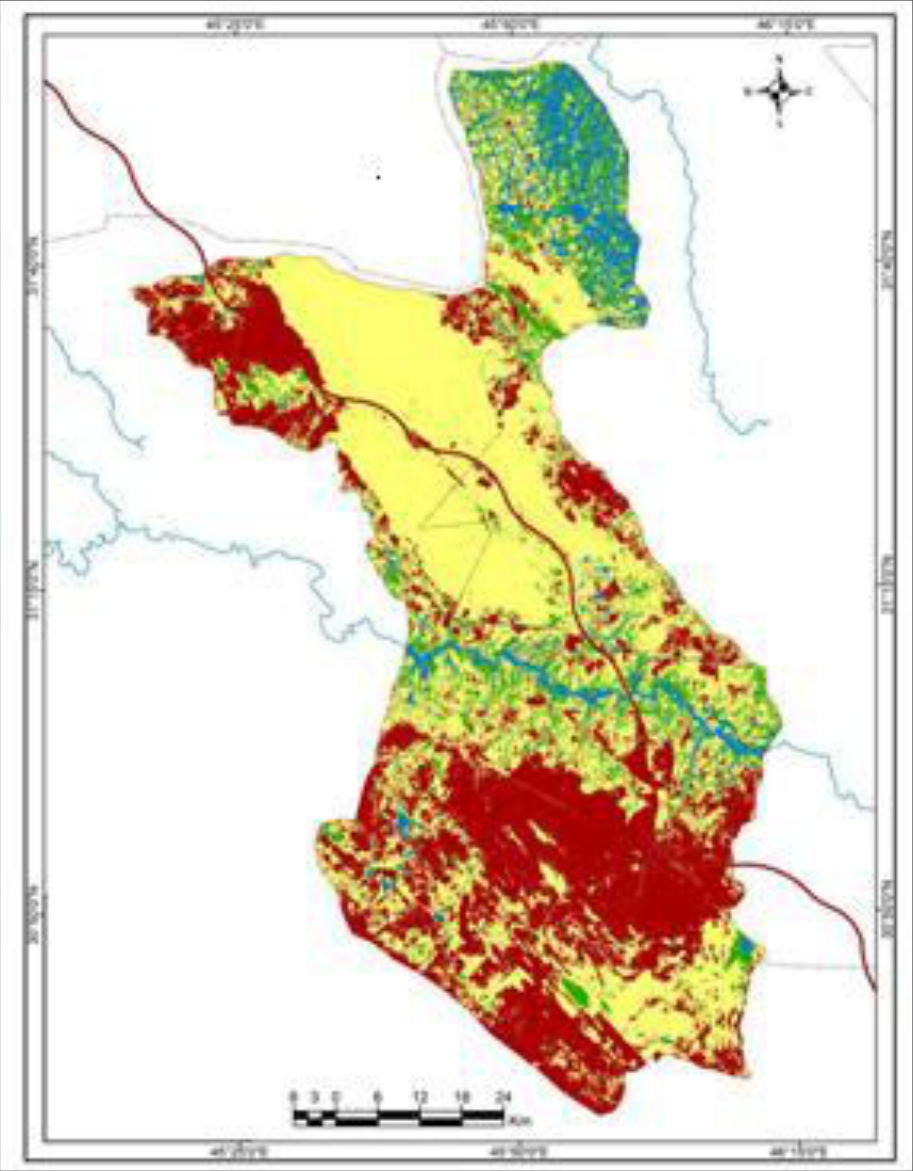 Figure 7
Introduction
Climate change effects on Earth's atmosphere have caused significant changes in most of the world's environments. Iraq and the Middle East are among the most severely affected by these locations (Adamo, Al-Ansari et al., 2022) [20] . Air temperatures have increased, heat waves have been severe, precipitation has been erratic and diminishing, and water resources have generally depleted. In conjunction with the increase in CO 2 concentration, the global mean temperature is expected to rise. The researchers have expected that the worldwide temperature average for 2081-2100 will be 2 ℃ up to the 1850-1900 average. The inevitable consequences of rising temperatures with lower precipitation decrease the soil moisture and hide the vegetation cover. In addition, drought, as a consequence of climate change, represents the driving force of desertification. According to the United Nations Convention to Combat Desertification (UNCCD), desertification is 'land degradation in the arid, semiarid and dry sub-humid areas resulting from various factors, including climate change and human activities (Sivakumar 2007). Climate change, drought, and desertification are, therefore, strongly interlinked. Desertification is a serious threat to arid and semi-arid lands covering 40% of the Earth's surface. Hot extremes' duration, frequency, and magnitude are expected worldwide (Collins, Knutti, et al., 2013). On the other hand, the current models may not be able to simulate the trends of climate factors (Kondratyev 2004). Moreover, increasing the Earth's temperature will be responsible for the spatial variation of the precipitation average. For instance, precipitation increased in arid and semi-arid regions as well as in mid-latitude and subtropical areas (Collins, Knutti et al. 2013). There is a projection that climate change will lead to severe impacts on natural systems in many regions worldwide [2] . Different ecosystems are expected to be affected by climate change [12] .
International Journal of Agriculture and Food Science https://www.agriculturaljournals.com
Over 200 years, atmospheric carbon dioxide (CO2) concentration has increased by about 120 ppm and thus caused an increase in greenhouse gas emissions. Fossil fuel consumption was the primary cause of the rise in greenhouse gases that blocked radiation from moving into free space [1] . The CO2 concentration and other greenhouse gases have increased significantly in the first decade of the twenty-first century [2] , which has made the rise in surface temperature worse, even though the increase in CO2 concentration occurred between 1970 and 2010. y using a simple model, researchers have predicted the change in global temperature with increasing greenhouse gas in the atmosphere [3] . Another natural driver, sun activity, can also cause an increase in global temperature. Climate change should be studied using long-term data at various temporal resolutions [4] . During the 20 th century, the mean surface temperature on the Earth increased by about 0.7 ℃ [5] . Both the Northern and South Hemispheres have experienced increases in surface temperature by 1.12 ℃ and 0.84℃, respectively, from 1901 to 2010 [6] . According to this, the temperature in the Northern Hemisphere has been greater than in the Southern Hemisphere. However, the most significant warming happened in the mid to lower latitudes of the Earth [4] . It is clear that the extent and magnitude of earth temperature are different in different regions around the world, and a few areas have become cooler [4] . For example, during the 1970s, the level of land surface warming was higher than that of sea warming [7] . Surface air temperature can be changed by many factors. To accurately determine temperature change, the observations of local air temperature should be joined with the temperature observations on a large scale [8] .
(Source: Australian Bureau of Meteorology, 2020).
Study Area
The study area is located in the south of Iraq within latitude 31.38 north and longitude 45.15 east. It extends over two governorates, Al-Muthanna and Dhi Qar, within the sedimentary plain (Figure 2) and the western desert plateau.
Results
The mean temperature and rainfall Samawah meteorological station From examining the trend of mean temperature in the Samawah meteorological station, it is clear that marked temperature change has occurred for the period from 1973 to 2018 (Table 1). Overall, the mean temperature is generally above the mean value of the period 1973 to 2007 (Table 1). Moreover, annual averages experienced a significant increase in the 21st century, especially in the last few years compared to the 20th century, where the average of the previous thirty years (1979-2008) was 24.51℃. The average mean temperature for the years from 1973 to 2007 was 26 ℃ [13] . The significant change in annual temperature occurred from 2008 to 2018 (Table 1) (Anand Kumar et al., 2023) [18] . The yearly average rainfall (97.05 mm) from 2008 to 2018 is very close to the yearly average rainfall of the previous years (1973 to 2007), which is 100.4 mm (Table 1). The rainfall average for the period from 1973 to 2007 was. However, the annual rain values have shown noticeable fluctuation since 1980 (Figure 3).
| Year | T, ˚C | Td, ˚C | R, mm | Rd, mm |
|---|---|---|---|---|
| 2008 | 25.26 | 0.75 | 55.92 | -44.48 |
| 2009 | 25.4 | 0.89 | 54 | -46.4 |
| 2010 | 26.6 | 2.09 | 46.92 | -53.48 |
| 2011 | 26.2 | 1.69 | 58.32 | -42.08 |
| 2012 | 25.7 | 1.19 | 105.2 | 4.8 |
| 2013 | 25.5 | 0.99 | 247.9 | 147.5 |
| 2014 | 25.8 | 1.29 | 111.2 | 10.8 |
| 2015 | 26.2 | 1.69 | 101.1 | 0.7 |
| 2016 | 26.2 | 1.69 | 68.3 | -32.1 |
| 2017 | 26.3 | 1.79 | 29.7 | -70.7 |
| 2018 | 26.62 | 2.11 | 189 | 88.6 |
| average | 25.98 | 1.47 | 97.05 | -3.35 |
Table text extracted from the original PDF; superscript letters are shown inline. The original table image is below.
View original table image
The Unsupervised Classification for the satellite images
Unsupervised classification has been used in this research, which is intended to group the image units (pixels) with similar spectral characteristics into clusters according to the number of classifications to be known or chosen. The computer is permitted to find the feature vectors without the intervention of the analyst. ''In the simplest form, known as the K-means algorithm, K feature vectors are typically selected at random from the data space". When the feature vectors are to be identified, classification rules are applied to assign pixels within the image to one of the feature vectors [14] . The Landsat-5-5 satellite images (Figure 4) of the study area for the year 1988 and the Landsat-8 satellite images for the year 2018 were used after the mosaic was created (Figure 5) for the purpose of doing an unsupervised classification to determine the extent of desertification (Table 3). Four classes were chosen, and these are on the maps of classification: water bodies (blue color), wetlands (green color), barren lands (red color), and sand dunes (yellow color) (Figure 6 and Figure 7).
| Satellite | Date | Row | Path |
|---|---|---|---|
| Landsat- 5 | 15-8-1988 | 38 | 167 |
| 22-8-1988 | 39 | 167 | |
| Landsat- 8 | 2/8/2018 | 38 | 167 |
| 8-9-2018 | 39 | 167 |
Table text extracted from the original PDF; superscript letters are shown inline. The original table image is below.
View original table image
Discussion
Increasing temperatures over the surface of the Earth are considered a strong indicator of the anthropogenic causes of climate change [13] . However, many different drivers can affect the observed temperature within multiple scales. The variation of temperatures globally can be created by natural and anthropogenic drivers [5] . Therefore, it is not easy to examine historical climate data at multiple scales in order to make an assessment of the causes of heat trends [13] . In addition, the temperature of the earth's surface and atmosphere is expected to increase [14] . Although, there are many studies that have tried to determine the changes in the warming rate observed between the earth's surface and troposphere [15] . This study analyzed the average changes in mean annual temperature and rainfall for the southern part of Iraq. We found that there were significant changes in temperature, as some years recorded a large increase in annual temperature values over the averaged historical values. For example, the year 2018 recorded a rise in temperature of more than 2 degrees Celsius than the yearly average temperature for both Samawah and Nasiriyah stations. Also, the annual rainfall values witnessed significant changes and fluctuations over the period from 1973 to 2018. For example, at Samawah station, an annual rainfall of 247.9 mm was recorded in 2013, while the yearly rainfall value in 2017 was 29.7 mm. The Unsupervised Classification for the satellite images of the study area was made, and four classes were chosen for the purpose of determining the extent of desertification. By following up on the results of this classification, we found that there is a significant increase in the area of land covered by sand dunes and a decrease in the areas of barren lands and wetlands in favor of sand dune lands. The land area of sand dunes increased from 1988 to 2018 (Table 3). Overall, climate change and land degradation have contributed to an increase in drought and desertification in the southern region of Iraq.
Conclusion
Climate change has happened all over the world as a result of the high levels of concentrations of greenhouse gases. This study examines the impacts of changing the temperature and rainfall on the extent of desertification phenomenon in southern Iraq as a result of climate changes. The results showed that there are significant increases in the extent of desertification in the study area. Changes in annual mean temperature and rainfall rates were the leading cause of increasing desertification. For example, through the result of the unsupervised classification of satellite images for the study area, it seems clear that the extent of desertification and its aspects are quite different in 2018 from the extent of that phenomenon in 1988. There is a significant increase in the area of land covered by sand dunes and a decrease in the areas of barren lands and wetlands.
Figures and tables from the paper
| Year | T, ˚C | Td, ˚C | R, mm | Rd, mm |
|---|---|---|---|---|
| 2008 | 26.4 | 0.90 | 65.5 | -34.9 |
| 2009 | 25.9 | 0.40 | 56.9 | -43.5 |
| 2010 | 25.7 | 0.20 | 57.6 | -42.8 |
| 2011 | 25.3 | -0.20 | 85 | -15.4 |
| 2012 | 26.5 | 1.00 | 116.2 | 15.8 |
| 2013 | 25 | -0.50 | 175.2 | 74.8 |
| 2014 | 26.6 | 1.10 | 219.7 | 119.3 |
| 2015 | 27 | 1.50 | 93.2 | -7.2 |
| 2016 | 26.9 | 1.40 | 58.3 | -42.1 |
| 2017 | 27.2 | 1.70 | 27 | -73.4 |
| 2018 | 27.5 | 2.00 | 226.5 | 126.1 |
| average | 26.36 | 0.86 | 107.37 | 6.97 |
Table text extracted from the original PDF; superscript letters are shown inline. The original table image is below.
View original table image
References
19 in the original paper- Hertzberg M, Schreuder H. Role of atmospheric carbon dioxide in climate change. Energy and Environment. 2016;27(6):785-797.
- IPCC. Climate change: synthesis report. Contribution of Working Groups I, II and III to the Fifth Assessment Report of the Intergovernmental Panel on Climate Change. Pachauri RK, Meyer LA, editors. Geneva: IPCC; 2014. p. 1-151.
- Benjamin D, Hui Por H, Budescu D. Climate change versus global warming: who is susceptible to the framing of climate change? Environment and Behavior. 2017;49(7):745-770.
- Jones PD, New M, Parker DE, Martin S, Rigor IG. Surface air temperature and its variations over the last 150 years. Reviews of Geophysics. 1999;37(2):173199.
- Lloyd PJ. An estimate of the centennial variability of global temperatures. Energy and Environment. 2015;26(3):417-424.
- Jones PD, Lister DH, Osborn TJ, Harpham C, Salmon M, Morice CP. Hemispheric and large-scale land surface air temperature variations: an extensive revision and an update to 2010. Journal of Geophysical Research. 2012;117:D05127.
- Xu Y, Ramanathan V. Latitudinally asymmetric response of global surface temperature: implication for regional climate change. Geophysical Research Letters. 2012;39(10):L10706.
- Ogurtsov M, Lindholm M. Uncertainties in assessing global warming during the 20th century: disagreement between key data sources. Energy and Environment. 2006;17(5):685-706.
- Sivakumar MVK. Interactions between climate and desertification. Agricultural and Forest Meteorology. 2007;142(2-4):143-155.
- Collins M, Knutti R, Arblaster J, Dufresne JL, Fichefet T, Friedlingstein P, et al. Long-term climate change: projections, commitments and irreversibility. In: Stocker TF, Qin D, Plattner GK, et al., editors. Climate Change 2013: The Physical Science Basis. Cambridge: Cambridge University Press; 2013. p. 1029-1136.
- Kondratyev KY. Key aspects of global climate change. Energy and Environment. 2004;15(3):469-503.
- Feeley KJ, Stroud JT, Perez TM. Most global reviews of species responses to climate change are not truly global. Diversity and Distributions. 2017;23(10):231234.
- Sabri WK. Dune in Muthanna Governorate: applied geomorphic study. Baghdad: University of Baghdad; 2010.
- Loehle C. Trend analysis of satellite global temperature data. Energy and Environment. 2009;20(7):1087-1098.
- Rosema A, Foppes S, Van der J. Meteosat-derived planetary temperature trend 1982-2006. Energy and Environment. 2013;24(3):381-395.
- Douglass DH, Christy JR. Reconciling observations of global temperature change. Energy and Environment. 2013;24(3):415-419.
- Kumar A, DC Gupta. Assessment of LULC and their impact on land surface temperature, using geospatial techniques in Kolar River catchment area, Madhya Pradesh, India. Int J Geogr Geol Environ 2023;5(1):0814. DOI: 10.22271/27067483.2023.v5.i1a.130
- GISTEMP Team. GISS surface temperature analysis (GISTEMP). NASA Goddard Institute for Space Studies; 2018.
- Adamo N, Al-Ansari N, Knutsson S. Climate change: droughts and increasing desertification in the Middle East, with special reference to Iraq. Engineering. 2022;14:235-273.