
Research article · 2025 · Full text
International Journal of Agriculture and Food ScienceGenetic variability studies in finger millet (Eleusine Corcana L.)
Volume 7(12) · Pages 389–391 · DOI: 10.33545/2664844x.2025.v7.i12e.1069 ↗
Research areasLeaf Properties and Growth MeasurementGenetics and Plant BreedingAgricultural Practices and Plant Genetics
Abstract
Author-writtenGenetic diversity was assessed in finger millet (Eleusine coracana L.) germplasms with 33 genotypes of finger millet collected from various sources which were evaluated in RBD at ZARS, Igatpuri during kharif 2024. A treatment sum of squares was significant for all the characters studied indicated considerable amount of variability. Phenotypic coefficient of variation (PCV) was higher than genotypic coefficient of variation (GCV) for all the characters studied indicating the role of environment in expression of characters. The characters viz., fodder yield per plot (kg), number of productive tillers and grain yield per plot (kg) exhibited high GCV and PCV effects indicating the presence of large variation among the genotypes for these characters. The traits plant height, iron content, fodder yield per plot, flag leaf length grain yield per plot, crude fibre, test weight and peduncle length showed high estimates of heritability (b.s.) accompanied by high genetic advance as per cent of mean signifying that these characters could be prominently governed by additive gene action and direct selection of these traits could be rewarded.
Summary
Source-checkedPlain-language reading of the full paper, prepared with AI and checked against the text. Each point links to the authors' own words.
Why it matters
- Finger millet is a valuable crop for arid and semi-arid regions due to its ability to grow in low-fertility soils. View evidence ↗
- In India, finger millet production reached 1.70 million tonnes across 1.07 million hectares during 2022-23. View evidence ↗
- Evaluating local germplasm to identify high-yielding genetic resources is necessary for breeding programs to combat declining production. View evidence ↗
What they did
- The experiment was conducted using a Randomized Block Design (RBD) at ZARS, Igatpuri, during the kharif season of 2024. View evidence ↗
- Fourteen characters were measured, including growth metrics (height, tillers), yield components (grain and fodder yield), and nutritional content (calcium, iron, crude fiber). View evidence ↗
What they found
- Significant differences were found among all studied characters, indicating substantial genetic variability across the genotypes. View evidence ↗
- High genotypic coefficient of variation (GCV) was observed for fodder yield per plot (59.03%), grain yield per plot (37.79%), productive tillers (24.81%), number of fingers per plant (21.11%), and iron content (21.08%). View evidence ↗
- High phenotypic coefficient of variation (PCV) was recorded for fodder yield per plot (59.47%), grain yield per plot (39.36%), productive tillers (25.99%), iron (23.68%), and number of fingers per plant (21.78%). View evidence ↗
- Low GCV was observed for days to maturity (3.24%) and days to 50% flowering (2.88%). View evidence ↗
- High heritability combined with high genetic advance was found for plant height, iron content, fodder yield, flag leaf length, grain yield, crude fiber, test weight, and peduncle length. View evidence ↗
- High heritability was observed for all measured characters except for days to 50% flowering. View evidence ↗
What it means
- The authors conclude that traits with high heritability and genetic advance are likely governed by additive gene action, making direct selection effective. View evidence ↗
- For characters showing high heritability but low genetic advance (excluding flowering and maturity days), the authors suggest that heterosis breeding may be more useful than direct selection due to non-additive gene action. View evidence ↗
Visual summary
3 visualsIllustrations explain the paper; charts are replotted from the paper's own table values.
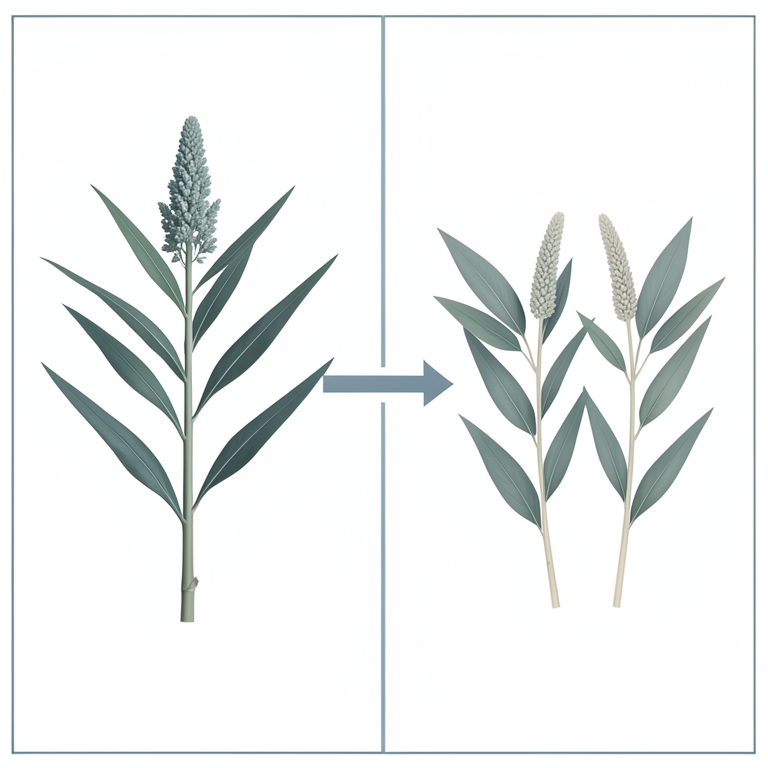
Selection Strategy Decision Tree
AI-generated conceptual illustration (finger millet plants (Eleusine coracana)). It explains the idea and does not show study data.
View source evidence ↗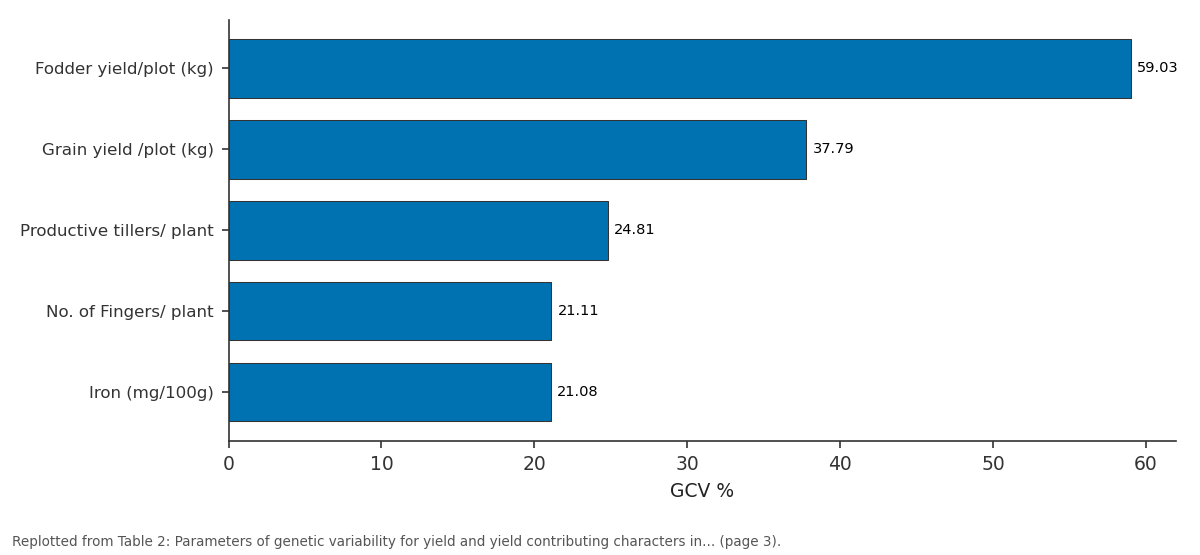
GCV %: Fodder yield/plot (kg) vs Grain yield /plot (kg) vs Productive tillers/... vs No. of Fingers/ plant vs Iron (mg/100g)
Replotted from Table 2 (page 3) of the original paper. Every bar is the paper's own table value.
View source evidence ↗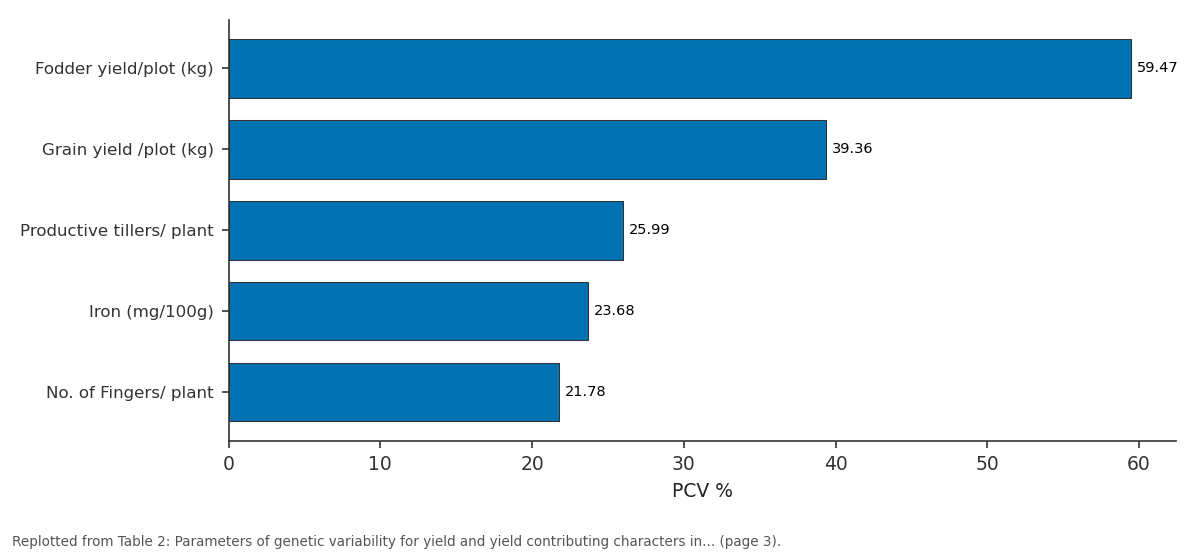
PCV %: Fodder yield/plot (kg) vs Grain yield /plot (kg) vs Productive tillers/... vs Iron (mg/100g) vs No. of Fingers/ plant
Replotted from Table 2 (page 3) of the original paper. Every bar is the paper's own table value.
View source evidence ↗Figures & tables
From the original paper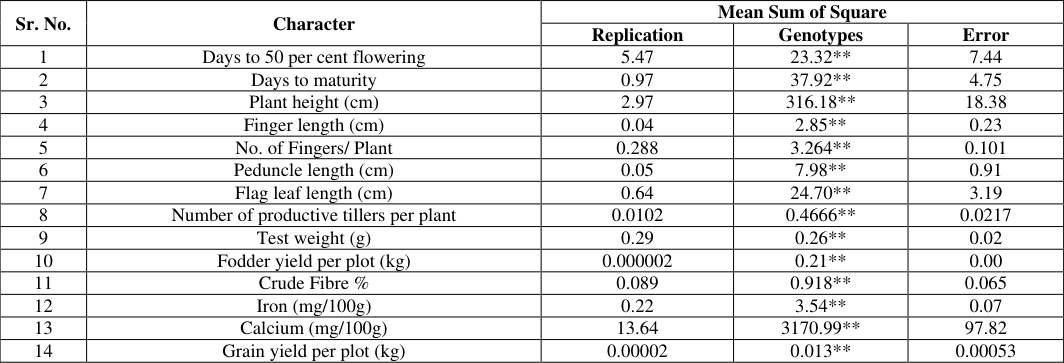 Table 1
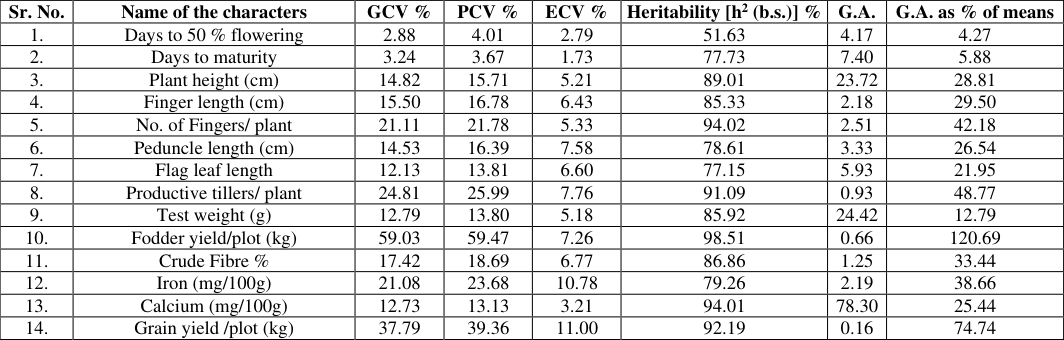 Table 2
Introduction
Finger millet (Eleusine coracana L.) belongs to the family poaceae (gramineae) subfamily panicoideae and genus Eleusine, considered a self-pollinated crop. It is an allotetraploid (2n = 4X = 36), mainly found in the arid and semiarid tropics and subtropics (Fakrudin et al. 2004), the domesticated crop of African origin and it is spread throughout the world. The crop is grown in a wide range of challenging environmental situations. It is a blessing for vast arid and semi-arid regions because it can be cultivated on low-fertility soils. Often regarded as a staple food, used as animal feed (straw) in industrialized countries and as food (grains) in underdeveloped. It is a major crop of semi-arid and arid regions and developing nations of Asia and Africa. The southern states of India are where finger millet is primarily grown in Asia, and these regions have ideal growing conditions. Finger millet is the fourth most produced millet in the world after sorghum, pearl millet and foxtail millet. During the year 2022-23 India produced 1.70 million tonnes of finger millet, which is grown over 1.07 million hectare area (Anonymous, 2023) [1] . The states Karnataka, Andhra Pradesh, Tamil Nadu, Maharashtra, Kerala, Telangana, Uttarakhand, Jharkhand, Madhya Pradesh and Haryana are important producers of finger millet. The area and production under finger millet have reduced over the years in the state. In Maharashtra, Nashik and Kolhapur are major finger millet growing districts and from 1997-98 to 2023-24 they contributed about an average of 46 % area and 48 % production of finger millet in the state. The area and production of finger millet have been reducing over the years in the districts (Anonymous, 2024) [2] . Considering its nutritional composition, the declining production will affect the supply of finger millet to the increasing population across India. Hence, efforts are required to maintain and increase the area and production of finger millet. The use of varied, traditional landraces of finger millet maintained by farmers is one of the reasons for the low area and production hence, the identification of higher-yielding genetic resources to use in breeding programmes by evaluation of local germplasm is prerequisite.
Material and Methods
The experiment entitled, "Genetic diversity and nutraceutical composition analysis in finger millet (Eleusine coracana L)" was conducted at Zonal Agriculture Research Station, Igatpuri during Kharif 2024. The experimental material used for the study consisted of 31 newly collected finger millet genotypes from adjoining area of Igatpuri Tahasil of Nasik district along with two check varieties Phule Nachani and Phule Kasari. All were obtained from the Zonal Agriculture Research Station, Igatpuri. The net plot size was 3.0 m x 2.4 m. The spacing was 22.5 cm x 10.0 cm. The following data were collected for each replication for 14 characters viz; Days to 50% flowering, days to maturity, plant height (cm), number of tillers per plant, finger length (cm), number of fingers per plant, peduncle length (cm), flag leaf length (cm), Thousand seed weight (g), grain yield (kg/plot), fodder yield (kg/plot), Calcium content (mg/100g), Crude fiber content (%) and Iron content (mg/100g). Analysis of variance for the Randomized Block Design were done as per the method suggested by Panse and Sukhatme (1967) [10] . The genotypic and phenotypic covariances were then calculated as per the formulae given by Johnson et al.
(1955) [6] . Heritability estimates in broad sense (h 2 ) were computed by the formula suggested by Lush (1940) [9] . From heritability estimates the genetic advance was estimated by the formula given by Johnson et al. (1955) [6] . In order to estimate the relative utility of genetic advance among characters, genetic advance as percent for mean is usually calculated. The range of genetic advance as percent of mean was classified as per suggestion by Johnson et al. (1955) [6] .
Results and Discussion
Analysis of variance exposed significant differences among the genotypes for all the quantitative characters as presented in Table 1. The mean of square due to genotype showed highly significant difference for all the traits viz., days to 50 per cent flowering, days to maturity, plant height, finger length, number of fingers per plant, peduncle length, flag leaf length, number of productive tillers per plant, Thousand seed weight, fodder yield per plot, crude fiber content, iron content, calcium content and grain yield per plot indicating that adequate variability was found in the genotype studied for these characters because of diverse genotypes. These results were confirmed by Charitha and Lal (2023) and Kumar et al. (2023) [4,8] . The parameters range, GCV and PCV, heritability in broad sense and genetic advance as per cent of mean have been presented in [11] reported high heritability with moderate GCV and genetic advance for days to flowering and maturity. Bharathi et al.
| Sr. No. | Character | Mean Sum of Square | — | — |
|---|---|---|---|---|
| Replication | Genotypes | Error | ||
| 1 | Days to 50 per cent flowering | 5.47 | 23.32** | 7.44 |
| 2 | Days to maturity | 0.97 | 37.92** | 4.75 |
| 3 | Plant height (cm) | 2.97 | 316.18** | 18.38 |
| 4 | Finger length (cm) | 0.04 | 2.85** | 0.23 |
| 5 | No. of Fingers/ Plant | 0.288 | 3.264** | 0.101 |
| 6 | Peduncle length (cm) | 0.05 | 7.98** | 0.91 |
| 7 | Flag leaf length (cm) | 0.64 | 24.70** | 3.19 |
| 8 | Number of productive tillers per plant | 0.0102 | 0.4666** | 0.0217 |
| 9 | Test weight (g) | 0.29 | 0.26** | 0.02 |
| 10 | Fodder yield per plot (kg) | 0.000002 | 0.21** | 0.00 |
| 11 | Crude Fibre % | 0.089 | 0.918** | 0.065 |
| 12 | Iron (mg/100g) | 0.22 | 3.54** | 0.07 |
| 13 | Calcium (mg/100g) | 13.64 | 3170.99** | 97.82 |
| 14 | Grain yield per plot (kg) | 0.00002 | 0.013** | 0.00053 |
Table text extracted from the original PDF; superscript letters are shown inline. The original table image is below.
View original table image
(2023) [3] also noted high heritability for days to flowering, indicating potential for early maturing lines. Ramakrishnan et al. (2016) [12] reported low heritability for plant height in finger millet due to significant environmental effects. This study depicted high heritability for all character except days to 50% flowering indicating that these traits are governed predominantly by additive gene action and have less environmental influence in their expression and direct phenotypic selection can be followed for these characters in breeding programme for development of high yielding genotypes. Similar findings were reported by Ramesh et al. (2002) [13] , who observed high heritability for grain yield, number of fingers per plant, and plant height in finger millet. Kumar et al. (2016) [7] observed high heritability for traits such as days to maturity, flag leaf length, and peduncle length, indicating the possibility of effective phenotypic selection.
Conclusion
The genotypic and phenotypic coefficient of variation (GCV and PCV) were categorized as high, medium, or low. The characters fodder yield per plot, number of productive tillers and grain yield per plot exhibited highest GCV and PCV effects. However, medium estimates of genotypic (GCV) and phenotypic coefficients of variation (PCV) had shown by plant height, finger length, test weight, peduncle length, flag leaf length, crude fibre and calcium. While days to 50 per cent flowering and days to maturity, showed low GCV and PCV effects.
In the present study the characters all characters except days to 50 % flowering and days to maturity showed high heritability coupled with low genetic advance, therefore selection of such character is not rewarding because of presence of non-additive gene action and heterosis breeding may be useful.
Figures and tables from the paper
| Sr. No. | Name of the characters | GCV % | PCV % | ECV % | Heritability [h2 (b.s.)] % | G.A. | G.A. as % of means |
|---|---|---|---|---|---|---|---|
| 1. | Days to 50 % flowering | 2.88 | 4.01 | 2.79 | 51.63 | 4.17 | 4.27 |
| 2. | Days to maturity | 3.24 | 3.67 | 1.73 | 77.73 | 7.40 | 5.88 |
| 3. | Plant height (cm) | 14.82 | 15.71 | 5.21 | 89.01 | 23.72 | 28.81 |
| 4. | Finger length (cm) | 15.50 | 16.78 | 6.43 | 85.33 | 2.18 | 29.50 |
| 5. | No. of Fingers/ plant | 21.11 | 21.78 | 5.33 | 94.02 | 2.51 | 42.18 |
| 6. | Peduncle length (cm) | 14.53 | 16.39 | 7.58 | 78.61 | 3.33 | 26.54 |
| 7. | Flag leaf length | 12.13 | 13.81 | 6.60 | 77.15 | 5.93 | 21.95 |
| 8. | Productive tillers/ plant | 24.81 | 25.99 | 7.76 | 91.09 | 0.93 | 48.77 |
| 9. | Test weight (g) | 12.79 | 13.80 | 5.18 | 85.92 | 24.42 | 12.79 |
| 10. | Fodder yield/plot (kg) | 59.03 | 59.47 | 7.26 | 98.51 | 0.66 | 120.69 |
| 11. | Crude Fibre % | 17.42 | 18.69 | 6.77 | 86.86 | 1.25 | 33.44 |
| 12. | Iron (mg/100g) | 21.08 | 23.68 | 10.78 | 79.26 | 2.19 | 38.66 |
| 13. | Calcium (mg/100g) | 12.73 | 13.13 | 3.21 | 94.01 | 78.30 | 25.44 |
| 14. | Grain yield /plot (kg) | 37.79 | 39.36 | 11.00 | 92.19 | 0.16 | 74.74 |
Table text extracted from the original PDF; superscript letters are shown inline. The original table image is below.
View original table image
References
13 in the original paper- Anonymous. The Agricultural and Processed Food Products Export Development Authority. New Delhi: APEDA; 2023.
- Anonymous. Department of Agriculture, Government of Maharashtra. Mumbai: Government of Maharashtra; 2024.
- Bharathi G, Radhika K, Anuradha N, Jayalalitha K, Rao VS. Genetic divergence studies in finger millet (Eleusine coracana L. Gaertn.) genotypes. Electron J Plant Breed. 2023;14(1):354-359.
- Charitha AV, Lal GM. Genetic diversity analysis for yield and yield attributing traits in finger millet (Eleusine coracana L.). Int J Plant Soil Sci. 2023;35(20):677-687.
- Fakrudin B, Kulkarni RS, Shashidhar HE, Hittalmani SH. Genetic diversity assessment of finger millet (Eleusine coracana (Gaertn.)) germplasm through RAPD analysis. Indian J Genet Plant Breed. 2004;64(4):335-338.
- Johnson HW, Robinson HF, Comstock RE. Estimates of genetic and environmental variability in soybean. Agron J. 1955;47(7):314-318.
- Kumar A, Yadav S, Panwar P, Gaur VS, Sood S. Identification of anchored simple sequence repeat markers associated with calcium content in finger millet (Eleusine coracana). Proc Natl Acad Sci India Sect B Biol Sci. 2016;85(1):311-317.
- Kumar R, Shweta AM, Tiwari P, Prajapati PK, Yadav DA. Correlation and path-coefficient analysis of components of indigenous collections of finger millet (Eleusine coracana (L.) Gaertn.) under varied edaphic conditions. J Pharmacogn Phytochem. 2023;15(2):291301.
- Lush JL. Intra-sire correlations or regressions of offspring on dam as a method of estimating heritability of characteristics. J Anim Sci. 1940;1:293-301.
- Panse VG, Sukhatme PV. Statistical methods for agricultural workers. 2nd ed. New Delhi: Indian Council of Agricultural Research; 1967.
- Patel SN, Patil HE, Popat RC. Genetic diversity study in finger millet (Eleusine coracana L.) genotypes: a multivariate analysis approach. Int J Pure Appl Biosci. 2017;5(5):183-189.
- Ramakrishnan M, Antony Ceasar S, Duraipandiyan V, Al-Dhabi NA, Ignacimuthu S. Assessment of genetic diversity, population structure and relationships in Indian and non-Indian genotypes of finger millet (Eleusine coracana (L.) Gaertn.) using genomic SSR markers. SpringerPlus. 2016;5(1):120.
- Ramesh SM. Character association, path analysis and genetic diversity in finger millet (Eleusine coracana Gaertn.). PhD thesis. Rahuri (India): Mahatma Phule Krishi Vidyapeeth; 2002.