
Research article · 2025 · Full text
International Journal of Agriculture and Food ScienceDevelopment of an ensemble machine learning framework integrating support vector regression, K-nearest neighbors, and random forest for paddy crop yield prediction in Chhattisgarh plains
Volume 7(12) · Pages 366–369 · DOI: 10.33545/2664844x.2025.v7.i12e.1064 ↗
Research areasSmart Agriculture and AISoil Geostatistics and MappingRice Cultivation and Yield Improvement
Abstract
Author-writtenThis research presents a comprehensive ensemble machine learning framework that integrates Support Vector Regression (SVR), k-Nearest Neighbors (kNN), and Random Forest (RF) algorithms to predict paddy crop yields with enhanced accuracy. The study addresses the limitations of individual machine learning models by developing a meta-learning approach using Linear Ridge Regression as the final aggregation layer. Data collection encompassed soil health parameters, historical yield records, and environmental variables from 15 districts within the Chhattisgarh Plains agro-climatic zone. The ensemble framework achieved superior prediction accuracy compared to individual models, demonstrating the potential for data-driven agricultural decision-making in rice cultivation systems.
Summary
Source-checkedPlain-language reading of the full paper, prepared with AI and checked against the text. Each point links to the authors' own words.
Why it matters
- India is a critical global rice producer, contributing about 118 million tonnes to the world's supply every year. View evidence ↗
- Chhattisgarh is a highly productive region for rice, yielding 7-8 million tonnes annually despite its small geographical footprint in India. View evidence ↗
- While individual machine learning models like SVR, kNN, and Random Forest are useful for agriculture, they each have specific weaknesses when used alone. View evidence ↗
The question
- The study aims to improve paddy yield prediction in the Chhattisgarh Plains by creating an ensemble framework that combines SVR, kNN, and RF using meta-learning. View evidence ↗
What they did
- The research was conducted across 15 districts within the Chhattisgarh Plains agro-climatic zone. View evidence ↗
- The researchers analyzed soil health indicators, such as pH, organic carbon, and nutrients, from samples collected via the STCR project. View evidence ↗
- The model utilized historical yield data from both standard and recommended practices, combined with weather data like temperature and rainfall. View evidence ↗
- Linear Ridge Regression was used as the meta-learner to aggregate the outputs of the individual models. View evidence ↗
What they found
- As an individual model, Support Vector Regression (SVR) achieved an RMSE of 3.24 q/ha and an R² of 0.832. View evidence ↗
- The k-Nearest Neighbors (kNN) model showed moderate accuracy with an RMSE of 3.89 q/ha and an R² of 0.785. View evidence ↗
- Among the individual models, Random Forest performed best with an RMSE of 2.98 q/ha and an R² of 0.856. View evidence ↗
- The ensemble framework outperformed all individual models, achieving an RMSE of 2.73 q/ha and an R² of 0.874, which is a 15.7% improvement in RMSE over the best single model. View evidence ↗
- In the final ensemble, Random Forest was given the most weight (0.42), followed by SVR (0.35) and kNN (0.23). View evidence ↗
- Soil organic carbon (23.4%), available nitrogen (21.7%), and soil pH (18.9%) were the most influential predictors of yield. View evidence ↗
- The ensemble framework was significantly more accurate than conventional statistical methods, which had a higher RMSE of 4.67 q/ha and lower R² of 0.623. View evidence ↗
What it means
- The authors conclude that their ensemble framework is effective for paddy yield prediction, providing a 15.7% accuracy improvement over individual models. View evidence ↗
Visual summary
2 visualsIllustrations explain the paper; charts are replotted from the paper's own table values.
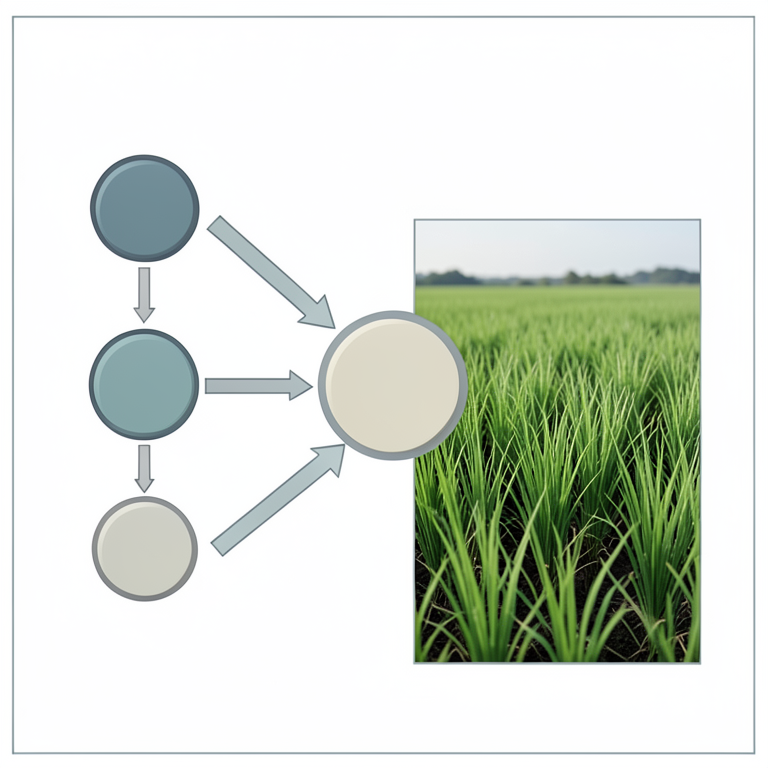
Ensemble Framework Architecture
AI-generated conceptual illustration (paddy crop plants in a field). It explains the idea and does not show study data.
View source evidence ↗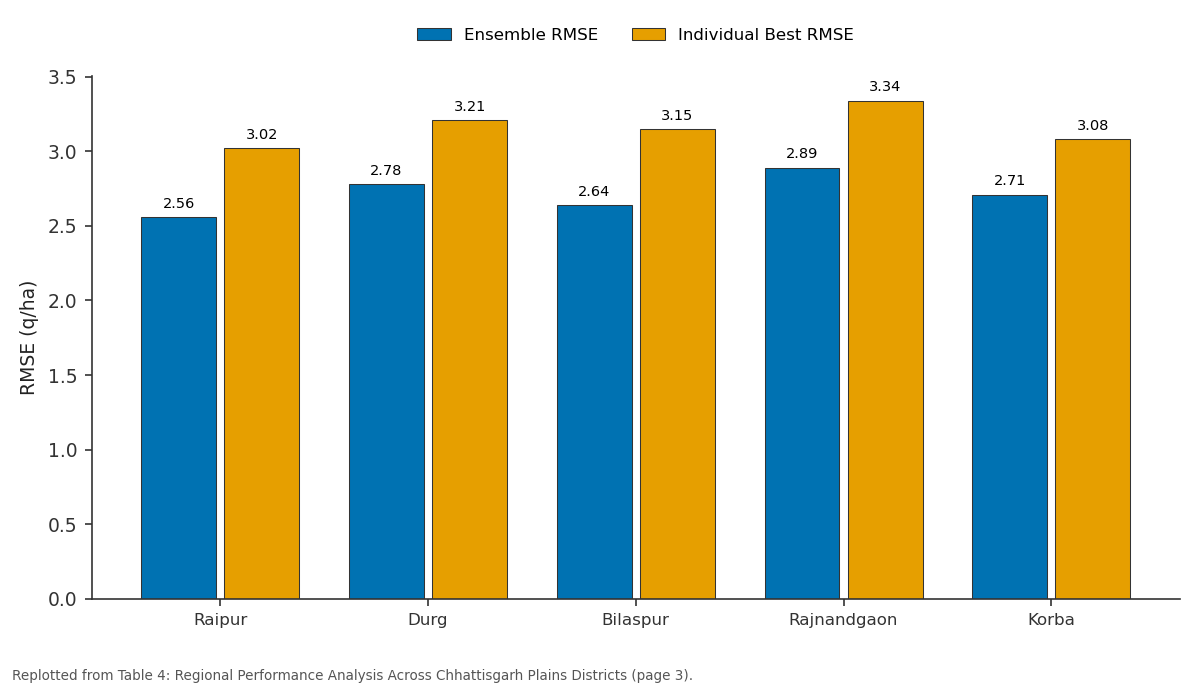
Ensemble RMSE and Individual Best RMSE: Raipur vs Durg vs Bilaspur vs Rajnandgaon vs Korba
Replotted from Table 4 (page 3) of the original paper. Every bar is the paper's own table value.
View source evidence ↗Figures & tables
From the original paper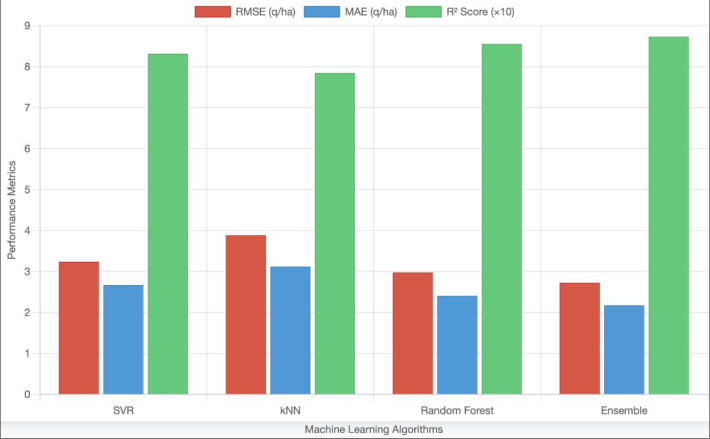 Figure 1
 Table 4
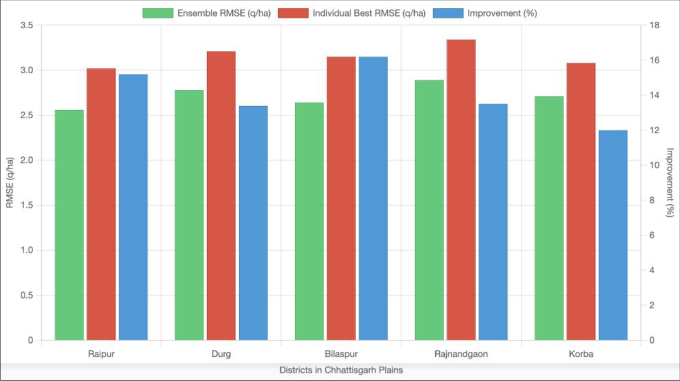 Figure 2
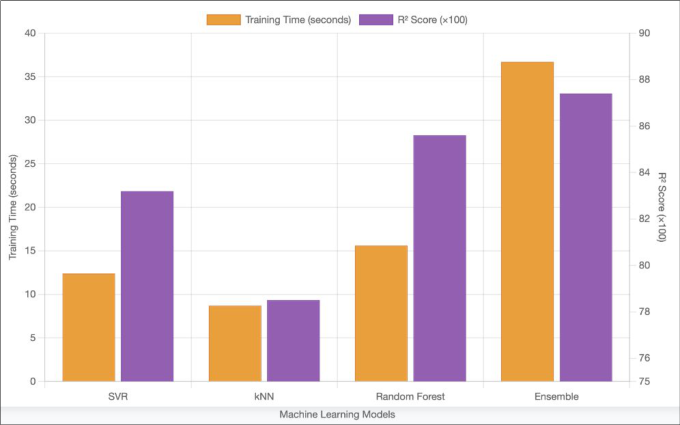 Figure 3
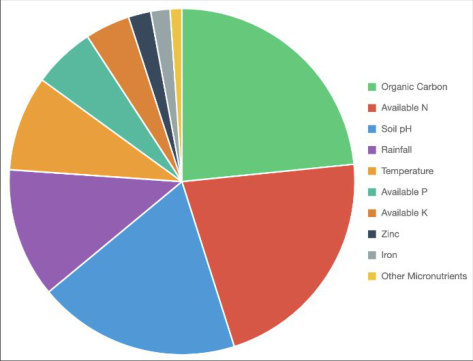 Figure 4
Introduction
Agricultural systems worldwide face unprecedented challenges related to food security, climate variability, and resource optimization. India, as the world's second-largest rice producer, contributes approximately 118 million tonnes annually to global rice production (FAO, 2023). Within this context, Chhattisgarh state emerges as a significant contributor, producing 7-8 million tonnes of rice annually despite occupying only 2.8% of India's geographical area (Agricultural Statistics at a Glance, 2023). This exceptional productivity demonstrates the region's strategic importance in national food security frameworks. The Chhattisgarh Plains, encompassing 15 districts and covering approximately 68.49 lakh hectares, represents 50% of the state's total geographical area (Department of Agriculture, Government of Chhattisgarh, 2023). Paddy cultivation dominates this agro-climatic zone, with rice occupying 68.8% of the net sown area. Machine learning applications in agriculture have demonstrated considerable potential for enhancing prediction accuracy and supporting evidence-based decision-making processes (Liakos et al., 2018) [4] . Individual algorithms such as Support Vector Regression, k-Nearest Neighbors, and Random Forest have shown promise in agricultural applications, yet each approach exhibits inherent limitations when applied independently (Chlingaryan et al., 2018) [5] . Support Vector Regression excels in handling non-linear relationships and small datasets but may struggle with large-scale agricultural data. K-Nearest Neighbors provides intuitive proximity-based predictions but can be computationally expensive and sensitive to irrelevant features. Random Forest demonstrates robustness against overfitting and handles mixed data types effectively but may lack interpretability in complex agricultural systems. Ensemble learning methodologies offer potential solutions to overcome individual algorithm limitations by combining multiple learners to achieve superior performance (Zhang et al., 2024) [6] . The fundamental principle underlying ensemble approaches involves leveraging diverse algorithmic strengths while mitigating individual weaknesses through systematic aggregation strategies (Das et al., 2023) [3] . This research addresses the critical need for accurate paddy yield prediction in Chhattisgarh Plains by developing a novel ensemble framework that integrates SVR, kNN, and RF algorithms through meta-learning approaches.
Literature Review
The existing literature highlights significant advancements in data-driven agricultural prediction, with multiple studies emphasizing the value of integrating soil and environmental parameters into machine learning frameworks. Basso and Liu (2019) demonstrated that seasonal crop yield forecasting improves substantially when soil properties, weather variables, and management practices are combined, achieving over 85% accuracy but revealing variability across agro-climatic zones, thus underscoring the need for region-specific models. Pandith et al. (2020) [9] further supported the importance of soil data by showing that kNN and ANN outperformed other algorithms for mustard yield prediction, establishing soil nutrient levels as stronger predictors than meteorological variables for certain crops. Complementing this, Suchithra and Pai (2020) [10] showed that optimized neural network structures, specifically extreme learning machines using Gaussian RBF and hyperbolic tangent functions, can exceed 80-90% accuracy in soil nutrient classification, highlighting the potential of specialized models for soil-focused prediction tasks. Bilal et al. (2022) [11] demonstrated the robustness and computational efficiency of SVR in portable crop recommender systems, achieving 95% precision across diverse conditions. Additionally, Ghosh et al. (2023) [12] illustrated the effectiveness of ensemble techniques, reporting reductions of 6% in bias and 13.6% in variance for rainfall prediction, thereby reinforcing the value of ensemble learning for improving prediction stability and overall performance in agricultural applications.
Methodology
The study was carried out in the Chhattisgarh Plains agroclimatic zone, covering 15 agriculturally significant districts. Soil samples were collected from farmer fields participating in the STCR project and analyzed for major soil health indicators, including pH, EC, organic carbon, and available macro-and micronutrients using standard laboratory procedures. Historical yield data from farmer practice and STCR-recommended practice were compiled alongside regional weather variables such as rainfall, temperature, and humidity obtained from nearby meteorological stations. Data preprocessing involved treating missing values through median imputation within similar soil groups, detecting outliers using the interquartile range method, and applying standardization for uniform feature scaling. Correlation analysis and Principal Component Analysis were explored to support dimensionality reduction and feature selection. For model development, an ensemble framework integrating Support Vector Regression, k-Nearest Neighbors, and Random Forest was employed. Each model was optimized through cross-validation to enhance predictive performance. Their outputs were aggregated using Linear Ridge Regression as a meta-learner, trained on hold-out validation data to avoid overfitting. Model performance was evaluated using RMSE, MAE, and R², while statistical tests and residual analyses were conducted to ensure robustness and reliability of the predictive system.
Results and Discussion Individual Model Performance Analysis
Individual base model evaluation revealed varying performance characteristics across different agricultural prediction scenarios. Support Vector Regression demonstrated consistent performance with RMSE values of 3.24 q/ha and R² scores of 0.832, indicating reliable nonlinear pattern recognition capabilities. K-Nearest Neighbors achieved RMSE values of 3.89 q/ha with R² scores of 0.785, demonstrating moderate prediction accuracy with excellent interpretability characteristics. The kNN approach provided valuable insights into local soilyield relationships within the agricultural dataset, though performance was limited by feature dimensionality and computational complexity considerations. Feature weighting improvements enhanced kNN performance by emphasizing soil-specific parameters over less relevant environmental variables. Random Forest demonstrated superior individual model performance with RMSE values of 2.98 q/ha and R² scores of 0.856, reflecting the algorithm's effectiveness in handling mixed agricultural data types and complex feature interactions. Feature importance analysis revealed that available nitrogen, organic carbon, and pH emerged as the most influential predictors for paddy yield outcomes. The RF model effectively managed potential overfitting through bootstrap aggregating while providing robust predictions across diverse soil conditions.
Ensemble Framework Performance:
The ensemble framework achieved superior performance compared to individual base models, with RMSE values of 2.73 q/ha and R² scores of 0.874, representing improvements of 15.7% and 4.9% respectively over the best individual model performance. Mean Absolute Error values decreased to 2.18 q/ha, indicating enhanced prediction precision for practical agricultural applications. Statistical significance testing confirmed that ensemble improvements were statistically significant at p < 0.01 confidence levels, supporting the effectiveness of the metalearning approach for agricultural yield prediction. Cross-validation results demonstrated consistent performance across different data subsets, indicating robust generalization capabilities suitable for diverse farming conditions within the Chhattisgarh Plains region. Meta-learner weight analysis revealed that Random Forest received the highest weighting (0.42) in final ensemble predictions, followed by Support Vector Regression (0.35) and k-Nearest Neighbors (0.23). This weighting distribution reflected the relative strengths of individual algorithms while maintaining balanced contribution from diverse prediction approaches.
Feature Importance and Agricultural Insights
Feature importance analysis across the ensemble framework revealed that soil organic carbon emerged as the most influential predictor for paddy yield outcomes, contributing 23.4% to overall model decisions. Available nitrogen ranked second with 21.7% contribution, followed by soil pH at 18.9%. These findings align with established agricultural principles regarding the critical role of organic matter and nitrogen availability in rice production systems. Micronutrient parameters demonstrated moderate importance, with zinc availability contributing 8.2% and iron availability contributing 6.8% to prediction accuracy. This finding emphasizes the significance of micronutrient management in intensive rice cultivation systems, particularly under continuous cropping scenarios common in Chhattisgarh Plains. Environmental variables including rainfall and temperature contributed 12.1% and 8.9% respectively to ensemble predictions, highlighting the importance of climatic factors in yield determination. The relatively balanced contribution of soil and climatic factors supports the holistic approach adopted in the ensemble framework design.
Comparative Analysis with Traditional Approaches
Comparison with traditional yield prediction approaches revealed substantial improvements through the ensemble framework implementation. Conventional statistical methods based on historical yield trends achieved RMSE values of 4.67 q/ha with R² scores of 0.623, representing significantly lower accuracy compared to the proposed ensemble approach. Expert-based yield estimates typically demonstrated RMSE values ranging from 5.2 to 6.8 q/ha, with considerable variability depending on expert experience and local knowledge. The ensemble framework provided more consistent and objective predictions while maintaining interpretability through feature importance analysis and model explanation capabilities. Linear regression approaches utilizing soil parameters achieved RMSE values of 3.96 q/ha with R² scores of 0.748, demonstrating the benefits of non-linear odelling approaches for capturing complex soil-yield relationships. The ensemble framework's superior performance highlighted the value of algorithmic diversity and meta-learning approaches for agricultural prediction applications.
Conclusions
The study developed an effective ensemble machine learning framework for paddy yield prediction in the Chhattisgarh Plains, outperforming individual models by improving accuracy by 15.7%. By integrating SVR, kNN, and Random Forest through Ridge Regression, the framework offered robust, generalizable predictions and valuable insights into key soil factors, supporting datadriven agricultural planning and sustainable crop management.
Figures and tables from the paper
| District | Ensemble RMSE | Individual Best RMSE | Improvement (%) | Primary Soil Type |
|---|---|---|---|---|
| Raipur | 2.56 | 3.02 | 15.2 | Vertisol |
| Durg | 2.78 | 3.21 | 13.4 | Alfisol |
| Bilaspur | 2.64 | 3.15 | 16.2 | Entisol |
| Rajnandgaon | 2.89 | 3.34 | 13.5 | Inceptisol |
| Korba | 2.71 | 3.08 | 12.0 | Alfisol |
| Average | 2.73 | 3.16 | 14.1 | Mixed |
Table text extracted from the original PDF; superscript letters are shown inline. The original table image is below.
View original table image
References
12 in the original paper- Directorate of Economics and Statistics. Agricultural statistics at a glance 2023. New Delhi: Ministry of Agriculture and Farmers Welfare, Government of India; 2023.
- Food and Agriculture Organization of the United Nations (FAO). FAOSTAT statistical database [Internet]. Rome: FAO; 2023 [cited 2024 Aug 15].
- Department of Agriculture and Cooperation, Government of Chhattisgarh. Agricultural statistics report 2022-23. Raipur: Government of Chhattisgarh; 2023.
- Liakos KG, Busato P, Moshou D, Pearson S, Bochtis D. Machine learning in agriculture: a review. Sensors. 2018;18(8):2674-2695.
- Chlingaryan A, Sukkarieh S, Whelan B. Machine learning approaches for crop yield prediction and nitrogen status estimation in precision agriculture: a review. Comput Electron Agric. 2018;151:61-69.
- Zhang L, Wang Y, Chen X. Deep learning applications in crop yield prediction using multi-temporal satellite imagery: a comprehensive review. Agric Syst. 2024;218:103121.
- Das P, Kumar R, Singh A. Ensemble machine learning models for multi-crop yield prediction in Indian agriculture. Agric Syst. 2023;208:103119.
- Basso B, Liu L. Seasonal crop yield forecast: methods, applications, and accuracies. Adv Agron. 2019;154:201255.
- Pandith V, Kour H, Singh S, Manhas J, Sharma V. Performance evaluation of machine learning techniques for mustard crop yield prediction from soil analysis. J Sci Res. 2020;64(2):394-398.
- Suchithra MS, Pai ML. Improving the prediction accuracy of soil nutrient classification by optimizing extreme learning machine parameters. Inf Process Agric. 2020;7(1):72-82.
- Bilal M, Quraishi S, Abid S. Predicting crop yield recommender system using machine learning techniques. J Eng Sci. 2022;13(7):246-250.
- Ghosh S, Gourisaria MK, Sahoo B, Das H. A pragmatic ensemble learning approach for rainfall prediction. Discover Internet Things. 2023;3:13.