
Research article · 2025 · Full text
International Journal of Agriculture and Food ScienceArtificial intelligence for enhancing soil organic matter, nutrient cycling and water productivity: A comprehensive review of soil-health-led intensification approaches
Volume 7(12) · Pages 114–128 · DOI: 10.33545/2664844x.2025.v7.i12b.1032 ↗
Research areasSoil Geostatistics and MappingSoil Carbon and Nitrogen DynamicsSmart Agriculture and AI
Abstract
Author-writtenArtificial Intelligence (AI) has emerged as a transformative force in modern agriculture, offering unprecedented opportunities to enhance soil organic matter (SOM) dynamics, nutrient cycling efficiency, and water productivity. Soil health-led intensification the strategy of boosting agricultural productivity while restoring and sustaining ecological functions requires timely, precise, and spatially explicit information on soil processes. Traditional soil monitoring methods are often labor-intensive, infrequent, and unable to capture the complexity of interactions among soil organic matter, nutrients, microbes, and water. This comprehensive review synthesizes advancements in AI-driven approaches that support the assessment, prediction, and management of SOM decomposition, nutrient mineralization-immobilization patterns, and soil-water interactions. Machine learning (ML) and deep learning (DL) enable continuous interpretation of multisource datasets, including remote sensing imagery, proximal soil sensors, and Internet-of-Things (IoT) networks. These models offer enhanced accuracy in predicting soil carbon turnover, nitrogen and phosphorus cycling, and greenhouse gas fluxes under diverse management scenarios. AI-enabled digital soil mapping has significantly improved the spatial resolution of soil organic carbon (SOC) inventories, facilitating the identification of carbon-depleted zones and guiding site-specific soil restoration strategies. Moreover, AI-based decision-support systems integrate crop growth models with SOM and moisture dynamics to optimize residue management, cover cropping, and organic amendments for improving nutrient use efficiency and soil biological activity. Water productivity, AI techniques such as convolutional neural networks (CNNs), random forests, and recurrent neural networks (RNNs) have enhanced real-time soil moisture estimation, evapotranspiration forecasting, and irrigation scheduling. By linking AI-processed hydrological data with SOM-mediated water retention properties, farmers can adopt precision irrigation practices that reduce water losses while maintaining crop yields. The integration of AI with conservation agriculture, precision fertilization, and climate-smart management further supports the synergistic improvement of SOM stabilization and water-use efficiency. AI-driven soil health innovations represent a pivotal pathway toward sustainable intensification. By enabling precise management of SOM, nutrient cycling, and water resources, AI offers the potential to enhance productivity, resilience, and environmental sustainability across diverse agro-ecosystems.
Summary
Source-checkedPlain-language reading of the full paper, prepared with AI and checked against the text. Each point links to the authors' own words.
Why it matters
- Soil health is essential for sustainable agricultural intensification because it integrates the physical, chemical, and biological capacities needed to maintain productivity and regulate nutrient and water cycles. View evidence ↗
- Conventional soil monitoring is limited by being labor-intensive and infrequent, which prevents it from capturing complex interactions between soil organic matter, water, nutrients, and microbes. View evidence ↗
- The steady decline of soil organic matter (SOM) in global croplands has led to a loss of soil structure and water-holding capacity, reducing yield stability and resilience to climate extremes. View evidence ↗
The question
- The review aims to synthesize how artificial intelligence (AI) can be used to assess, predict, and manage soil organic matter decomposition, nutrient cycling, and soil-water interactions. View evidence ↗
What they did
- The reviewed AI approaches utilize machine learning and deep learning to interpret data from remote sensing, proximal sensors, and IoT networks. View evidence ↗
- Specific AI architectures, including convolutional neural networks (CNNs), random forests, and recurrent neural networks (RNNs), are used for real-time moisture estimation and irrigation scheduling. View evidence ↗
What they found
- A global meta-analysis found that including cover crops in rotations led to a mean soil organic carbon (SOC) increase of 15.5% and a sequestration rate of approximately 0.56 Mg C ha⁻¹ yr⁻¹. View evidence ↗
- Cover crops increased overall SOC by ~12%, with the strongest response seen in microbial biomass carbon (+33%) and the weakest in mineral-associated organic carbon (+7%). View evidence ↗
- In conservation agriculture, the combination of manure and mineral nitrogen produced the highest SOC gains, reaching approximately 41.7%. View evidence ↗
- In tropical and subtropical regions, biochar application resulted in the largest SOC stock increase (~25.38%), outperforming conservation tillage and cover cropping. View evidence ↗
- An AI-based precision fertilization system achieved fertilizer savings of 18-27% and increased yields by 4-11% across various agro-ecological zones. View evidence ↗
- AI-driven irrigation scheduling integrated with sensors can reduce agricultural water use by 20-50% without compromising crop yields. View evidence ↗
- Significant gains in stable soil organic carbon pools typically require long-term adoption of management practices, often taking 5 years or more to emerge. View evidence ↗
What it means
- The authors conclude that AI has transformative potential to improve soil organic matter, nutrient cycling, and water productivity within soil-health-led intensification frameworks. View evidence ↗
- The reliability of AI predictions is currently constrained by gaps in ground-truth data, sensor inaccuracies, non-representative training sets, and difficulties in transferring models across different agroecological zones. View evidence ↗
Visual summary
3 visualsIllustrations explain the paper; charts are replotted from the paper's own table values.
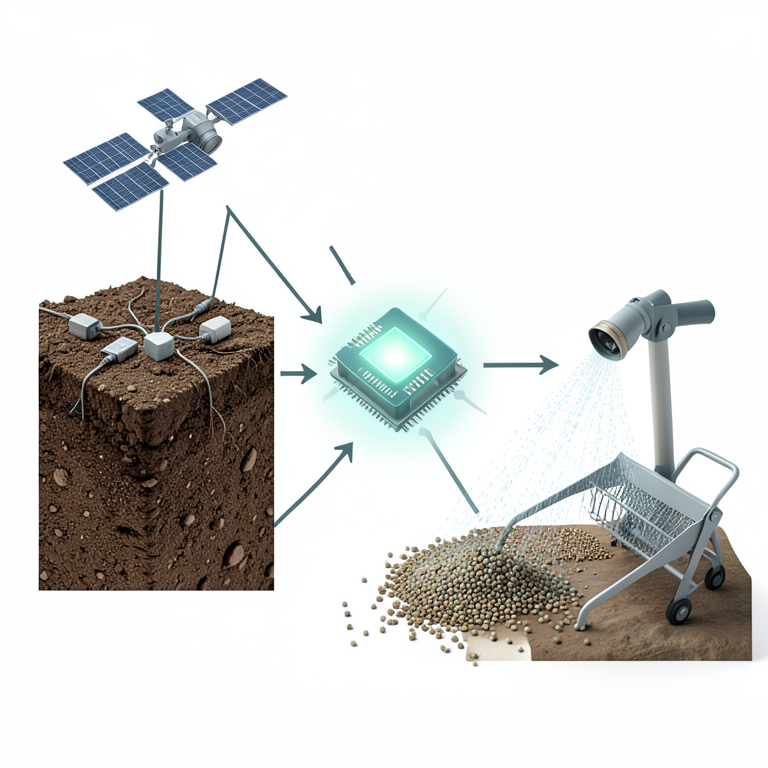
AI Data Integration Flow
AI-generated conceptual illustration (Agricultural soil with integrated IoT sensors and satellite monitoring). It explains the idea and does not show study data.
View source evidence ↗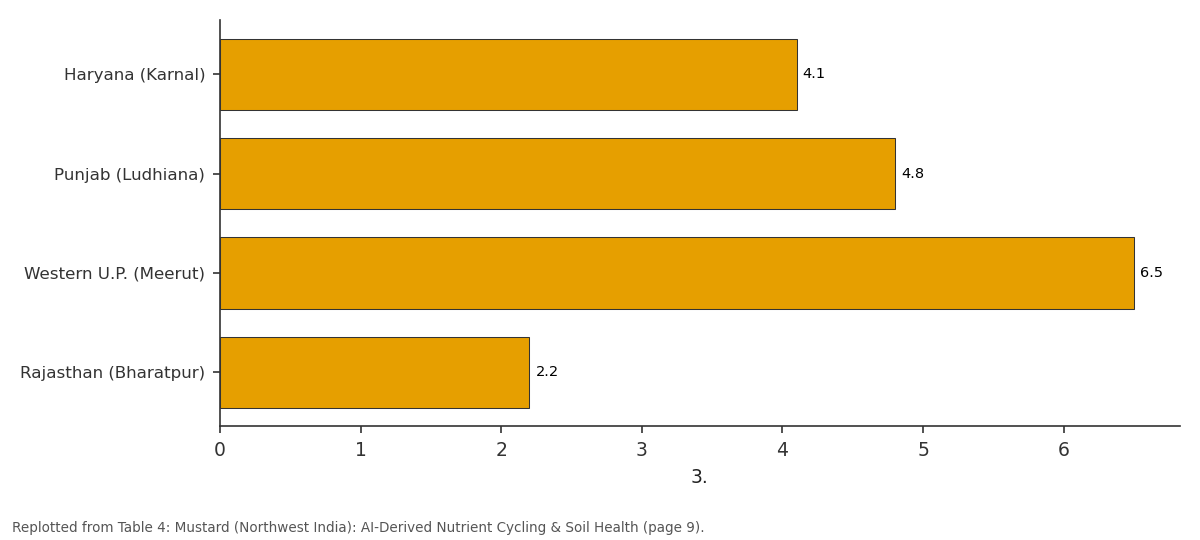
3.: Haryana (Karnal) vs Punjab (Ludhiana) vs Western U.P. (Meerut) vs Rajasthan (Bharatpur)
Replotted from Table 4 (page 9) of the original paper. Every bar is the paper's own table value.
View source evidence ↗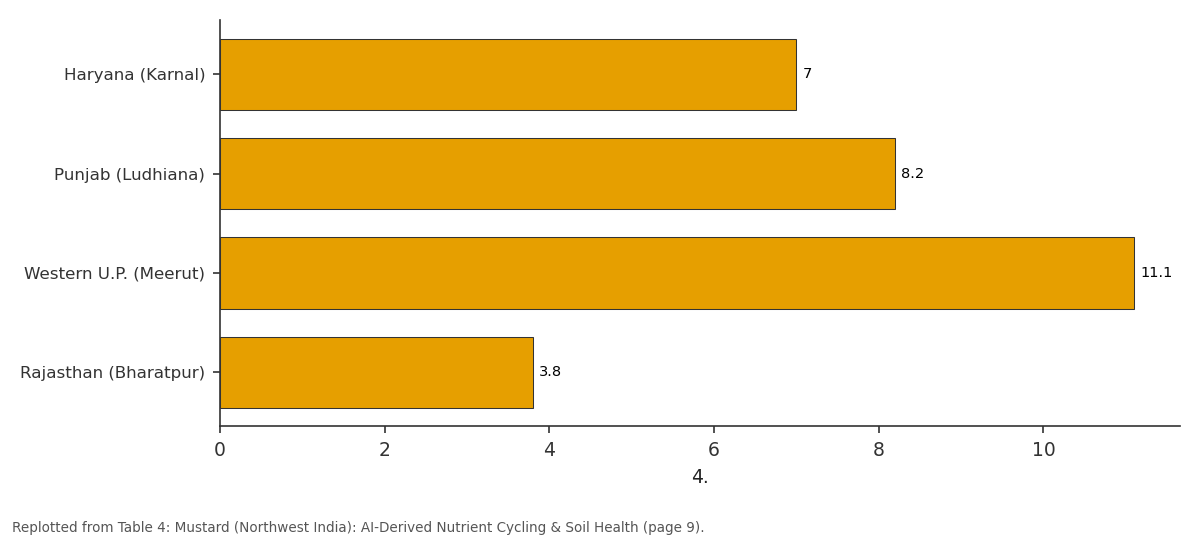
4.: Haryana (Karnal) vs Punjab (Ludhiana) vs Western U.P. (Meerut) vs Rajasthan (Bharatpur)
Replotted from Table 4 (page 9) of the original paper. Every bar is the paper's own table value.
View source evidence ↗Figures & tables
From the original paper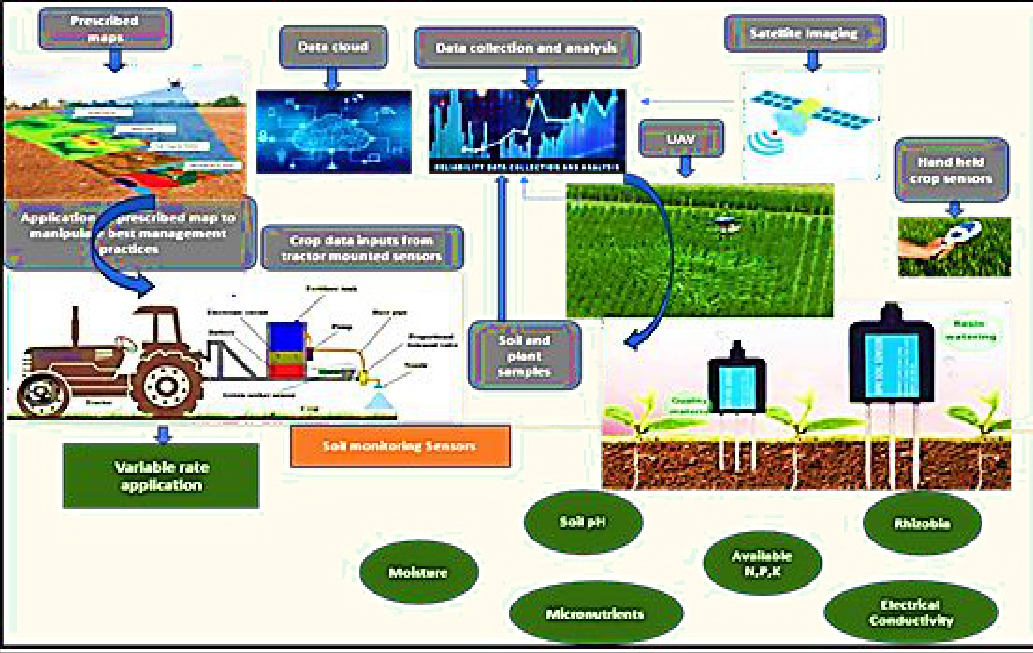 Figure 1
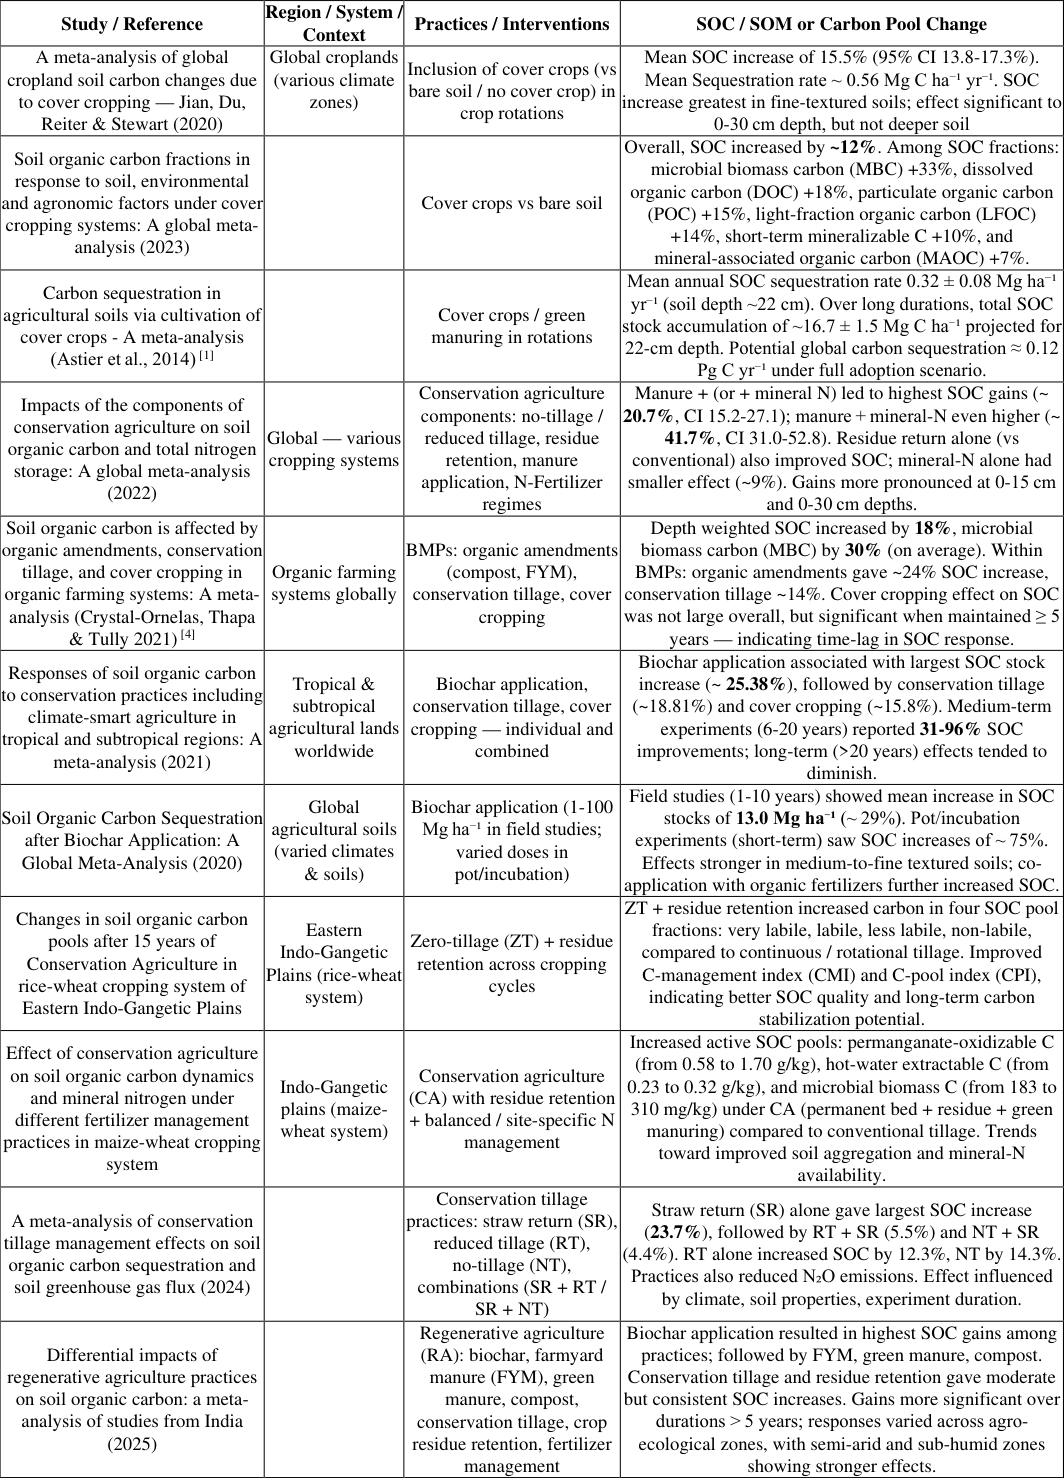 Table 1
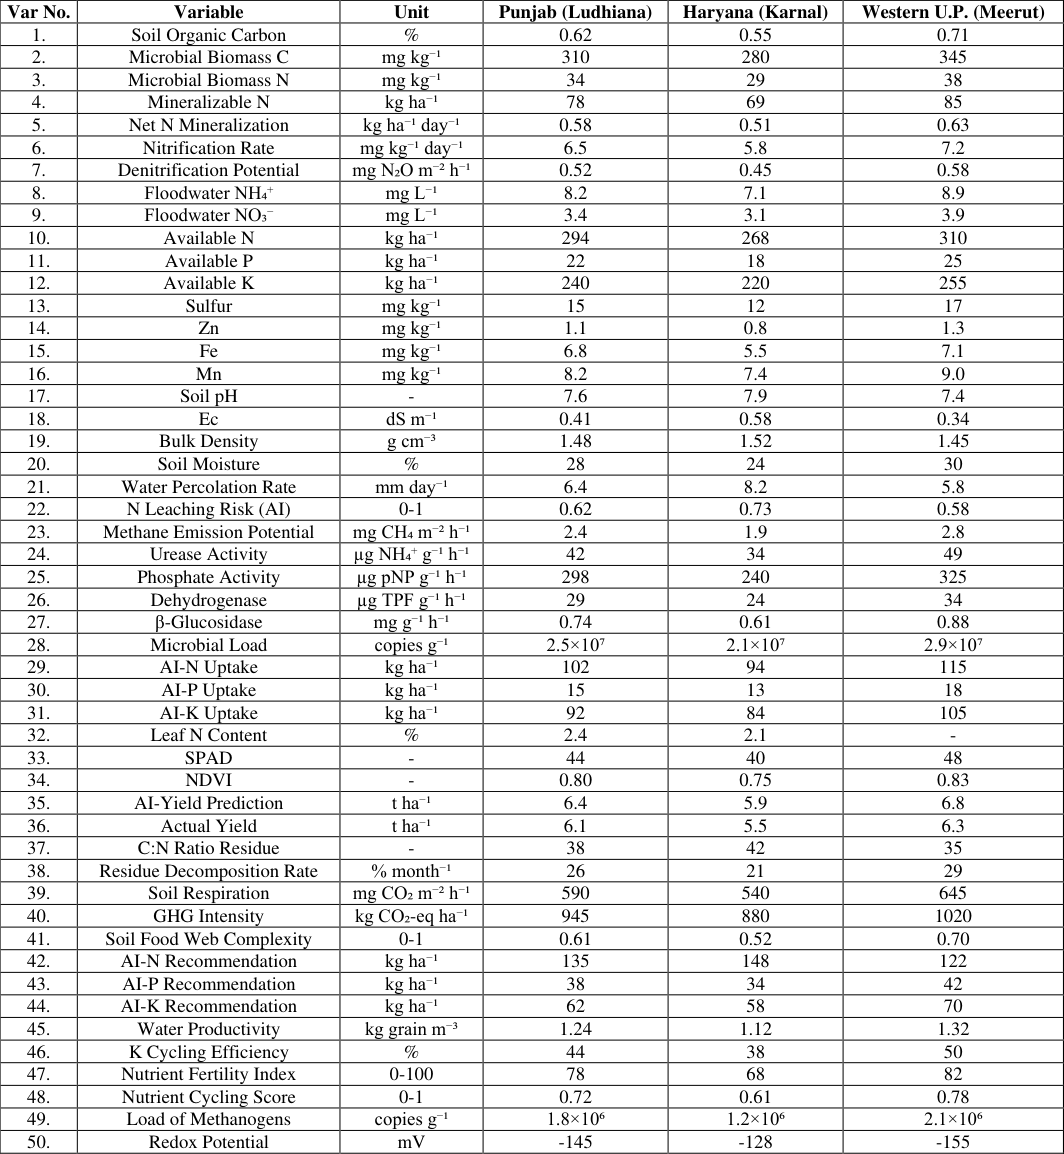 Table 1
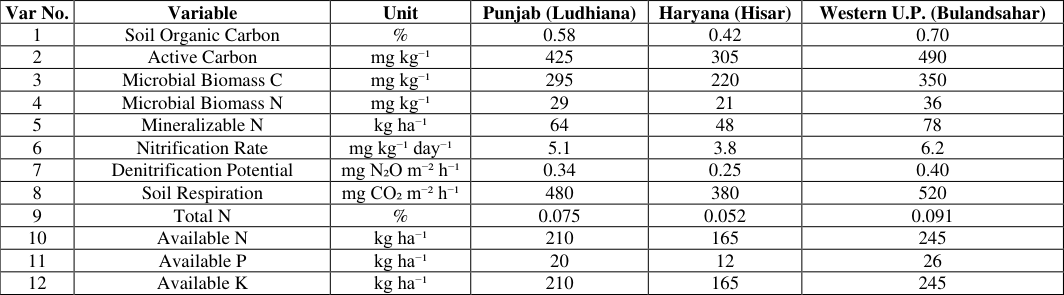 Table 2
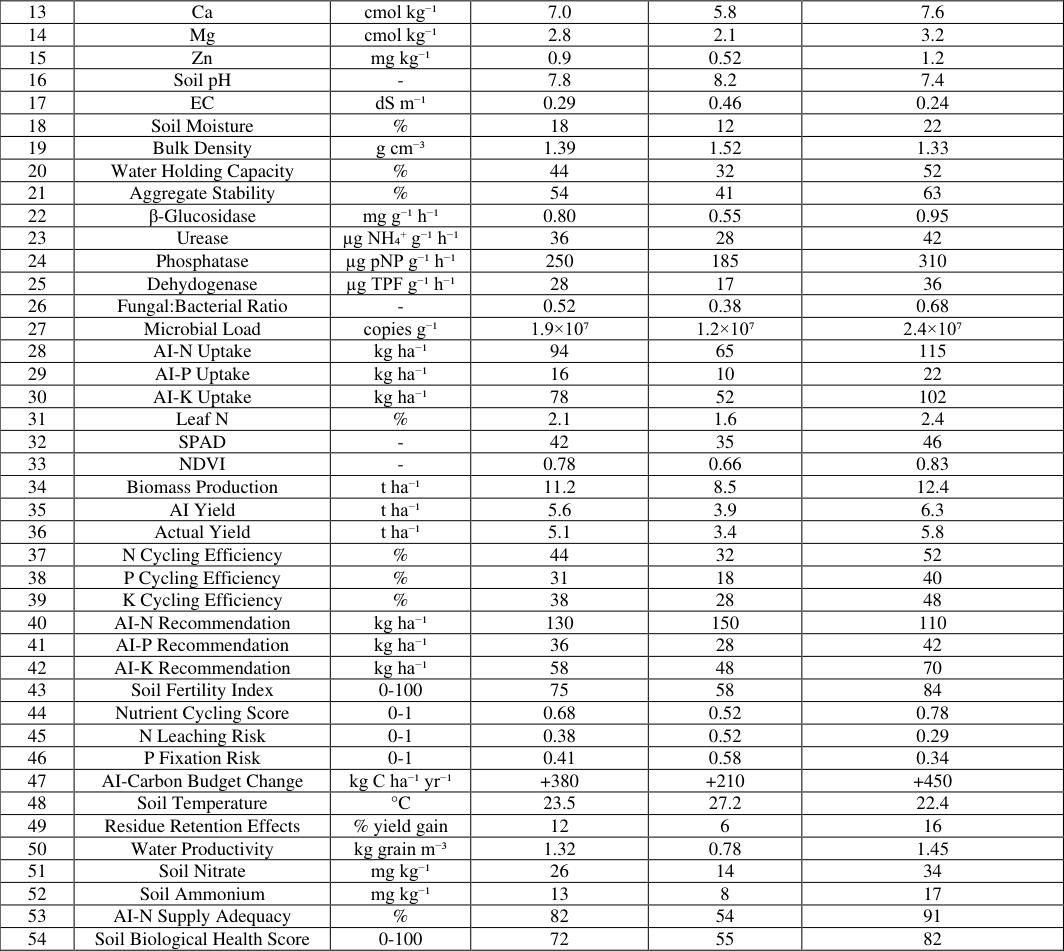 Table 3
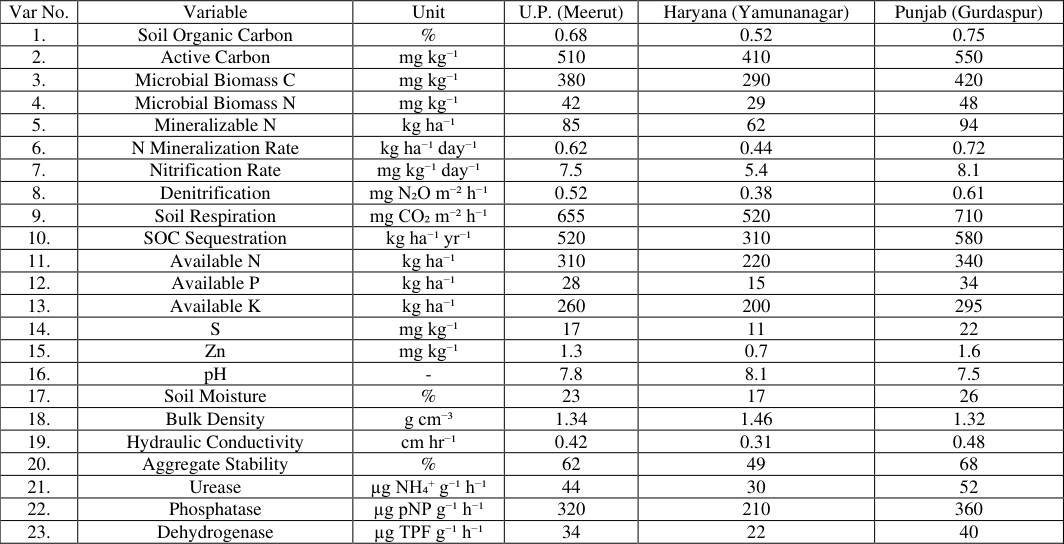 Table 3
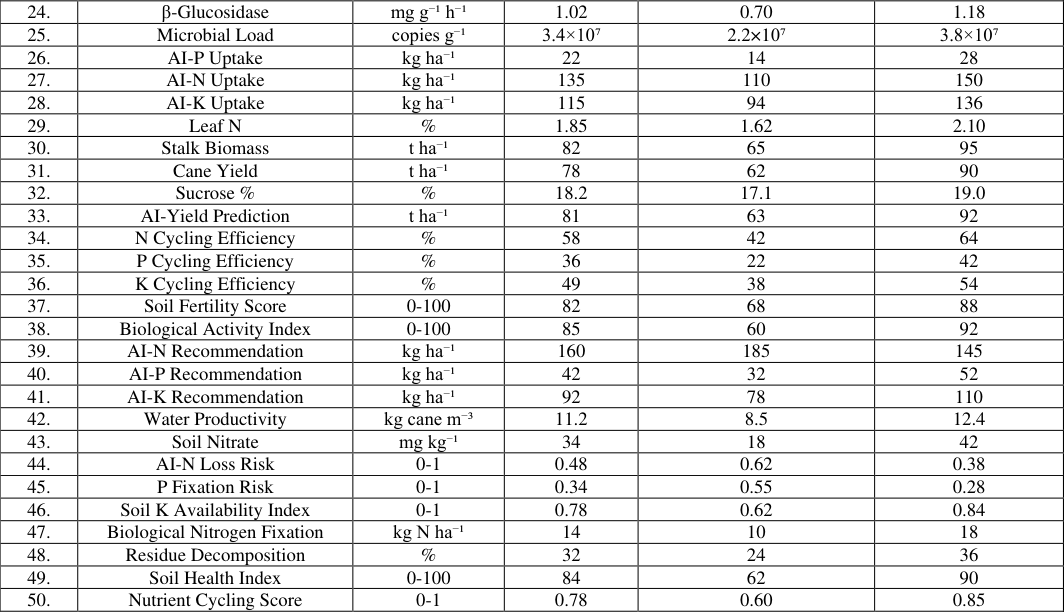 Table 4
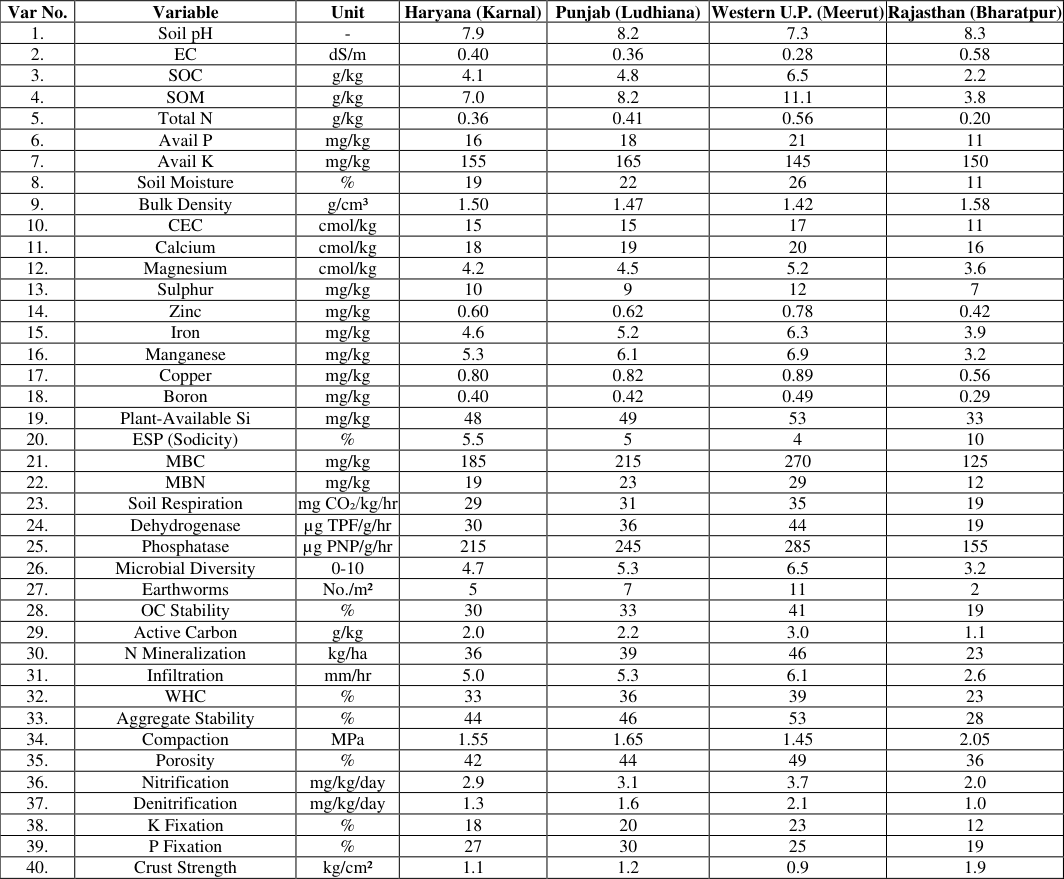 Table 4
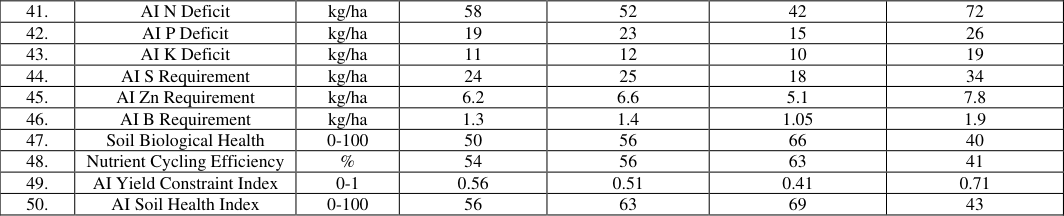 Table 5
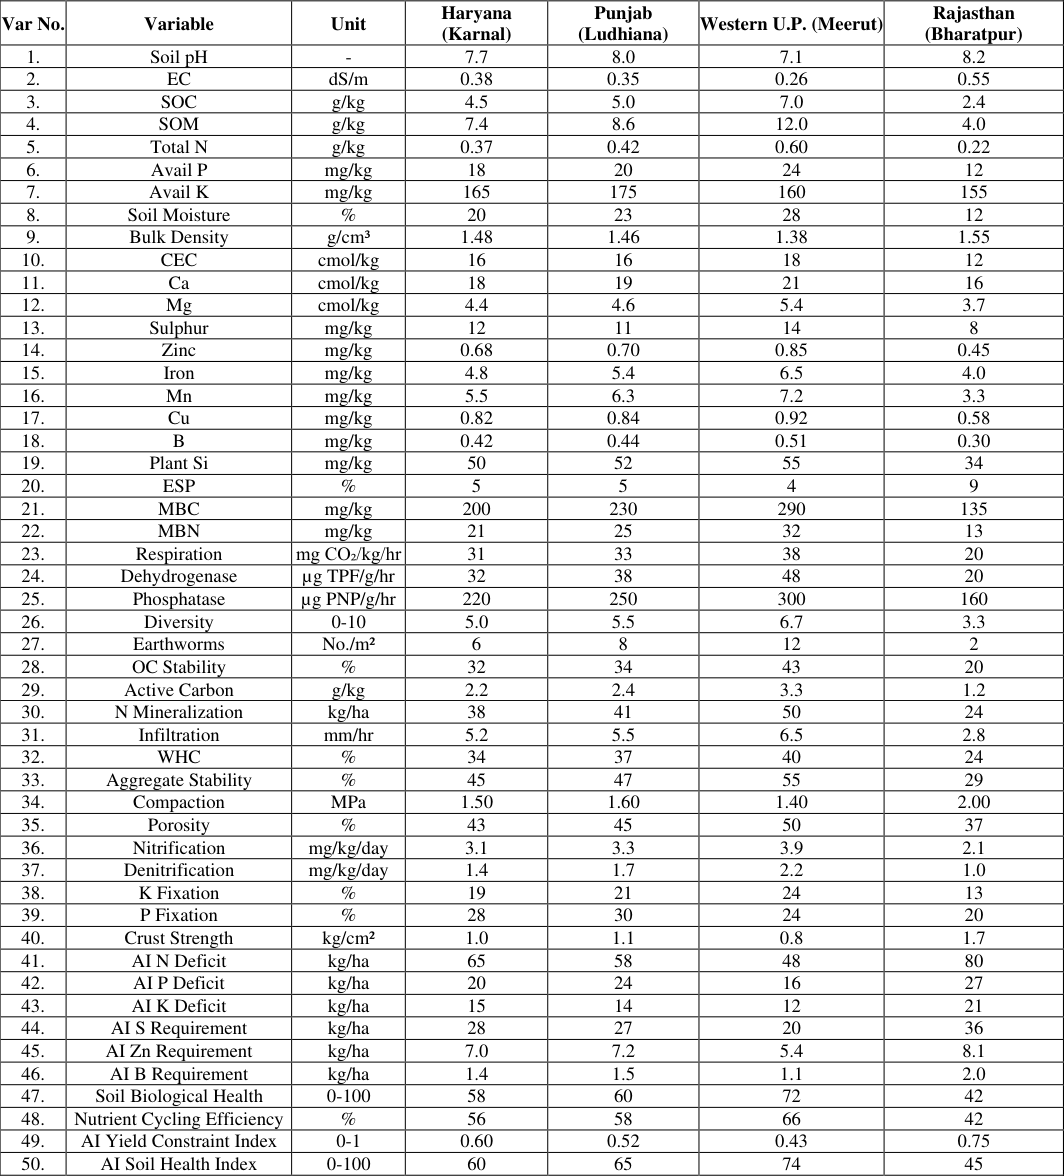 Table 5
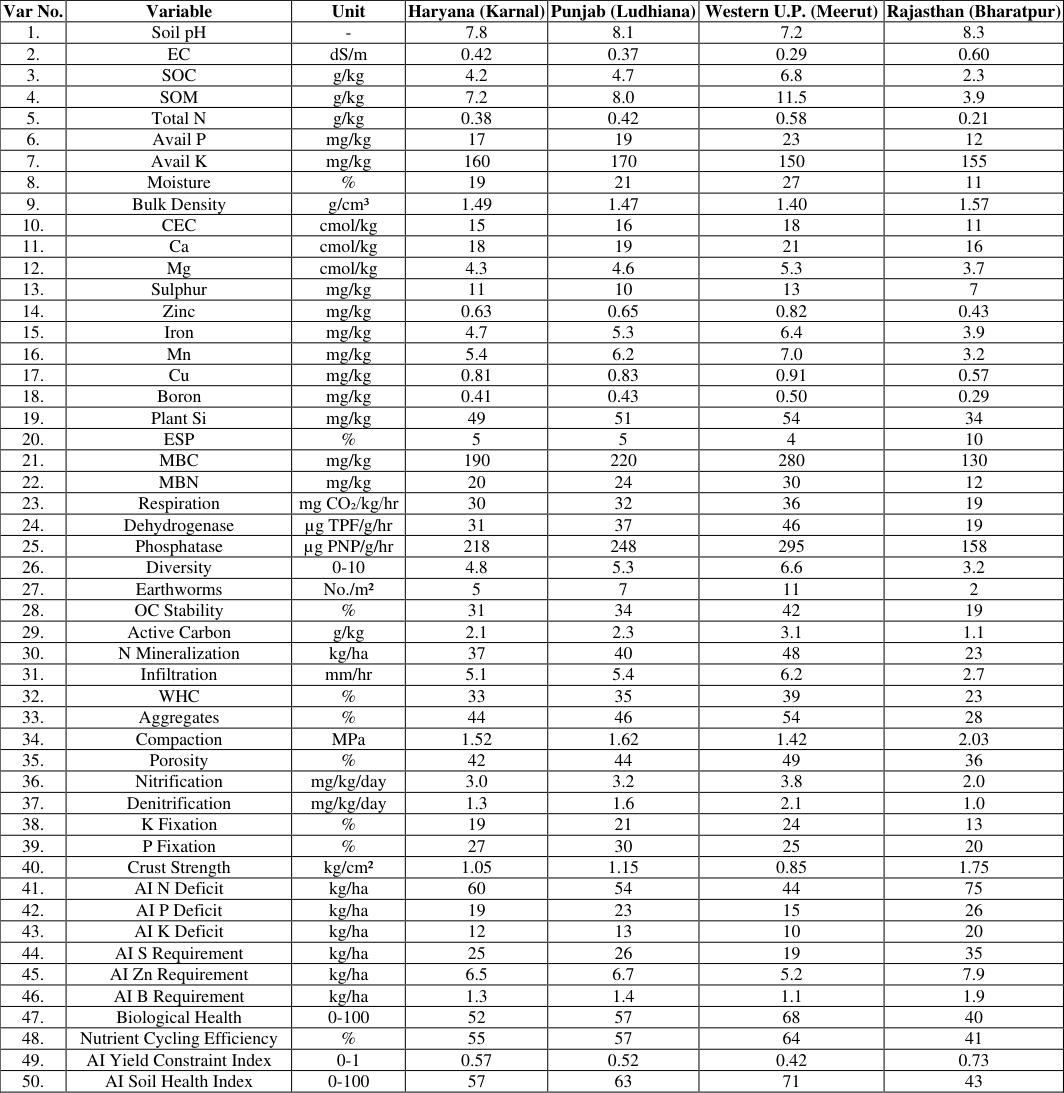 Table 6
Introduction
Soil health the integrated physical, chemical and biological capacity of soil to sustain productivity, regulate water and nutrient cycles, and provide ecosystem services is central to sustainable intensification of agriculture. Yet global croplands have experienced steady declines in soil organic matter (SOM) and associated loss of structure, nutrient buffering and water-holding capacity, which undermines yield stability and resilience to climate extremes. Framing intensification around restoring soil health therefore reframes productivity goals: not simply "more output per hectare" but "more output from healthier soil" through practices that rebuild SOM and the soil biota that drive nutrient cycling and water productivity (Fausak et al.). The rapid advancements in Articial Intelligence (AI) and the Internet of Things (IoT) have signicantly transformed soil health monitoring and restoration practices. These technologies have facilitated real-time, continuous monitoring of soil conditions, enabling farmers and researchers to gain critical insights into soil parameters such as moisture levels, pH balance, nutrient content, and temperature. This integration has led to data-driven decision-making, optimizing agricultural practices and enhancing crop yields. Traditional soil health assessment methods have often been labour-intensive, time-consuming, and reliant on periodic soil sampling and laboratory analysis. These approaches, though effective, fail to provide real-time data crucial for proactive agricultural management. The emergence of IoT-enabled sensors and AI-driven predictive analytics has revolutionized the field by offering instantaneous feedback and actionable insights. Artificial intelligence (AI) and allied data-science tools (machine learning, deep learning, and sensor fusion) are transforming how soil scientists measure, monitor and manage SOM, nutrient dynamics and soil water. Recent reviews demonstrate that AI methods can integrate heterogeneous inputs proximal and satellite remote sensing, hyperspectral and vis-NIR spectra, in-situ IoT sensors, terrain and climatic covariates, and laboratory assays to map soil organic carbon (SOC) and moisture at high spatial resolution, predict mineralization and nutrient availability, and drive decision support for precision fertilization and irrigation scheduling (Awais et al., 2023; Zayani et al., 2023) [2,13] . These tools substantially reduce the time and cost of soil characterization and permit near-real-time, spatially explicit management recommendations that align inputs with crop demand. Soil organic matter and SOC mapping, machine learning models (random forests, gradient boosting, deep neural networks) trained on combined laboratory spectra and multitemporal Sentinel imagery have produced robust SOC predictions across contrasting soils and management systems (Zayani et al., 2023) [13] . Importantly, these hybrid approaches improve predictive skill by fusing spectral information with non-spectral covariates (topography, landuse, climate), enabling scalable monitoring of SOM trends that are essential for evaluating soil-health-led intensification interventions such as cover cropping, reduced tillage and organic amendments. Where traditional soil surveys are sparse or infrequent, AI-driven mapping supports targeted sampling and verification, making carbon and nutrient monitoring operational at landscape scales. Beyond mapping, AI is increasingly applied to model the processes that link SOM to nutrient cycling and water productivity. Predictive models can learn empirical relationships between SOM pools, microbial indicators, moisture regimes and mineralization rates to forecast inorganic nutrient availability and greenhouse-gas tradeoffs under varying management. Coupled sensor networks and AI analytics also enable closed-loop irrigation systems that maintain optimal soil moisture for microbial activity and nutrient uptake while minimizing deep percolation losses thereby improving water productivity (crop per unit water) and synchronizing nutrient supply with crop demand. These applied advances are well summarized in recent reviews that assess AI and machine-learning benefits for soil analysis, sensor fusion, and smart irrigation decision systems (Awais et al., 2023) [2] . Soil-health-led intensification seeks to raise yields while rebuilding SOM and improving ecosystem services. Studies synthesizing the mechanisms by which SOM improves structure, water retention and nutrient buffering demonstrate that practices increasing organic inputs rotating with cover crops, integrating manures/composts and lowering tillage intensity strengthen soil structure and sequester carbon, but their outcomes vary by soil type and context (Hatano, 2024; Krupek et al., 2022) [8,10] . AI tools can accelerate the tailoring of these practices to local conditions by predicting where particular interventions will most effectively increase SOM, reduce nutrient loss and boost water productivity enabling precision intensification that is both productive and restorative.
Fundamentals: SOM, nutrient cycling, and water productivity SOM and soil function
Soil organic matter (SOM) is one of the most vital constituents of the soil, forming the backbone of soil health and fertility SOM is a complex mixture of plant and animal materials in varying stages of decomposition, microbes, and the substances they synthesize in the soil (Lehmann and Kleber, 2020) [9] . It plays a key role in numerous soil functions, contributing to soil structure, nutrient cycling, and water retention, among other things (Janzen). The importance of SOM in agriculture cannot be overemphasized. In addition to improving soil structure and enhancing nutrient and water retention, SOM plays a crucial role in supporting a rich and diverse soil biota (Postma-Blaauw et al.,). SOM (or soil organic carbon, SOC, as a common measurable proxy) controls cation exchange capacity, aggregate stability, microbial habitats, and water-holding capacity. Changes in SOM reflect management and influence nutrient mineralization rates and water availability to crops key levers in soil-health led intensification. ). Residue return alone (vs conventional) also improved SOC; mineral-N alone had smaller effect (~9%). Gains more pronounced at 0-15 cm and 0-30 cm depths. Soil organic carbon is affected by organic amendments, conservation tillage, and cover cropping in organic farming systems: A metaanalysis (Crystal-Ornelas, Thapa & Tully 2021) [4] Organic farming systems globally BMPs: organic amendments (compost, FYM), conservation tillage, cover cropping Depth weighted SOC increased by 18%, microbial biomass carbon (MBC) by 30% (on average). Within BMPs: organic amendments gave ~24% SOC increase, conservation tillage ~14%. Cover cropping effect on SOC was not large overall, but significant when maintained ≥ 5 years -indicating time-lag in SOC response. • Type of practice influences magnitude and stability of SOC gains: Among interventions: biochar application often yields high gains (notably in tropic/subtropic meta-analysis and Indian RA meta-analysis). Organic amendments (manure, compost), residue retention, and conservation tillage also contribute meaningfully, but their effect size varies with depth, soil type, climate, and combination with other practices. E.g., manure + mineral N in conservation agriculture gave higher SOC gains than residue retention alone.
• SOC fractions respond differently: Labile and microbial carbon fractions (MBC, DOC, and POC) tend to respond faster and more strongly than more stable pools like mineral-associated organic carbon (MAOC). This suggests that early indicators of soil health improvement may come from changes in these fractions rather than bulk SOC. • Soil type, texture, climate, and initial conditions modulate response: Fine-textured soils, medium to fine grain soils, soils in certain climatic zones, and soils with low initial SOC tend to show greater relative gains. Meta-analyses often highlight significant variation across soil orders, climates, and agro-ecological contexts.
• Combined practices often outperform single interventions:
Combining biochar + residue retention + conservation tillage, or layering organic amendments with CA, tends to produce better SOC gains than any single practice alone. This aligns with the philosophy of integrative soil health-led intensification. • Regional evidence (e.g. from India) supports RA/CA relevance in diverse agro-climatic zones: The 2025 meta-analysis across India's agro-ecologies shows that RA practices particularly biochar, FYM, green manure have robust SOC gains over time, making them relevant for tropic / subtropic smallholder farming systems.
Soil organic matter is the cornerstone of soil health and the central target for soil health-led intensification. Enhancing SOM through integrated management including residues, cover crops, organic amendments, conservation tillage, and crop diversification improves soil structure, nutrient cycling, water retention, and microbial activity. AI tools, remote sensing, and precision agriculture can optimize SOM enhancement, enabling data-driven, site-specific, and sustainable intensification strategies. The process of carbon storage is facilitated by soil organic carbon (SOC), a key indicator of soil health. High SOC levels are associated with improved soil fertility, structure, and moisture retention, all of which support robust plant growth (Lehmann, et al., 2020) [9] . Practices such as no-till farming, cover cropping, and the incorporation of organic matter into the soil can enhance SOC levels, contributing to both increased agricultural productivity and reduced greenhouse gas emissions. However, when soil is degraded or eroded, stored carbon is released back into the atmosphere, contributing to global warming.
Nutrient cycling: Soil status evaluation is very important for estimating production systems' sustainability and yield capacity. Soil quality can be assessed using both qualitative and quantitative methods, considering physical, chemical and biological properties. Physical soil properties such as soil texture, structure, moisture content, porosity and bulk density are key indicators of soil health. These indicators influence water retention, root penetration and nutrient availability (Terence et al., 2020) [12] . Key chemical indicators of soil fertility include total carbon and nitrogen content, mineral nutrients, organic matter and cation exchange capacity. However, these indicators generally take more time than biological indicators such as soil health based on the presence, abundance and activity of living organisms within the soil. Unlike chemical indicators, which measure nutrient levels and pH, biological indicators reflect the biological functioning and fertility of the soil ecosystem. These include microbial biomass, soil respiration rates, enzyme activities and the diversity of soil fauna such as earthworms and nematodes. Because they respond sensitively to environmental changes, biological indicators provide valuable insights into the long-term sustainability of soil management practices. Both sets of indicators give important information on the intensity of microbial turnover and the nutrient cycling, which are critical for sustaining the health of soils. Artificial intelligence (AI) has emerged as a powerful catalyst for improving nutrient cycling within soilhealth-led agricultural intensification. Sun et al. (2024) [11] , article 157) revealed that CBiResNet-BiLSTM deeplearning architecture to invert hyperspectral signatures for total nitrogen (TN) estimation in black soils. Their model produced high precision (R² = 0.937; RMSE ≈ 48.7 mg•kg⁻¹) and outperformed conventional methods such as PLSR and RF. Importantly, the architecture generalized well to the LUCAS soil reference database, indicating that AIdriven spectral fusion can overcome spatial heterogeneity barriers a key challenge limiting nutrient-cycling assessments in diverse agro-ecosystems. Gupta et al. (2024) [7] integrated a calibrated DSSAT crop model with a long short-term memory (LSTM) network to estimate daily soil mineral nitrogen (SMN) under field conditions using sparse monitoring data. Their hybrid approach reduced nRMSE by 18-30% relative to DSSAT alone. This improvement is critical for nutrient cycling, as day-to-day shifts in mineral N availability govern synchrony between crop N uptake and soil N transformations (mineralization, immobilization, and nitrification). Highfrequency SMN prediction allows precise alignment of fertilizer applications with biological N demand, minimizing losses through leaching and volatilization. Zhou et al. (2020) [14] used machine-learning algorithms with Sentinel-1/2 imagery and DEM derivatives to generate high-resolution spatial maps of soil organic carbon (SOC) and soil total nitrogen (STN). Their approach revealed finescale nutrient gradients that traditional sampling fails to capture. Such AI-derived maps support variable-rate fertilization, targeted residue management, and identification of nutrient-depleted microsites thereby strengthening nutrient cycling and improving soil organic matter buildup. Folorunso et al. (2023) [6] reported that ensemble tree models, especially Random Forest, consistently yield superior prediction accuracy for soil nitrogen, phosphorus and potassium. They emphasized that AI performance is strongly dependent on spectral preprocessing, soil-depth consistency, and integration of ancillary variables. These improvements directly enhance nutrient-cycle modeling by enabling more precise estimation of mineralizable N, labile carbon pools, and nutrient stoichiometry. Awais et al. (2023) [2] highlighted that end-to-end AI workflows spectroscopy, ML inversion, digital soil mapping, fertilization decision engines-dramatically shorten the time from soil sampling to nutrient recommendations. They reported that AI systems improve diagnosis of nutrient deficiencies, optimize fertilizer timing, and reduce the reliance on laboratory analyses. However, they also noted the importance of model interpretability and bias detection to avoid misapplication of nutrient prescriptions. Chen et al. (2025) [3] developed a dynamic AIbased precision fertilization decision system that used continuous monitoring, crop-growth indicators and nutrientstatus predictions to adjust fertilizer dose and timing. Across multiple agro-ecological zones, their system achieved fertilizer savings of 18-27% and yield increases of 4-11%. These results show that AI can directly enhance nutrient-use efficiency (NUE), reduce nutrient losses, and promote soilhealth-led intensification by improving synchrony between soil nutrient supply and crop demand. [17] demonstrated that soil-moisture estimation using IoT sensors combined with polynomial regression reached R² ≈ 0.79, while soil-type classification reached 97.38% accuracy, providing actionable zonal irrigation recommendations within heterogeneous soils. These improved soil-water datasets are directly linked to AIaugmented irrigation scheduling and variable-rate irrigation (VRI). Machine-learning models process real-time moisture data, crop growth stages and weather forecasts to recommend optimal irrigation timing and volumes. Krishnan et al., (2022) [15] show that sensor-integrated AI scheduling can reduce water use by 20-50% while sustaining yields. Such precision is vital in soil-health-led intensification, where enhanced soil organic carbon, aggregation and microbial activity increase the soil's waterholding capacity and buffer capacity. AI allows irrigation to be synchronised with this improved soil hydraulics, enabling plants to extract water more efficiently while avoiding moisture stress or excessive percolation losses. AI also accelerates soil health assessment, which underpins long-term water productivity. Soils rich in organic matter and stable aggregates absorb rainfall better, reduce runoff, and enhance root-zone moisture retention. Awais et al. (2023) [2] showed that ML models (random forest, SVM, neural networks) accurately predict soil properties such as texture, organic carbon, and cation exchange capacity using only multispectral reflectance data and minimal ground sampling. This enables large-area soil monitoring and targeted placement of conservation practices (cover cropping, reduced tillage, and residue retention) that strengthen the soil-water-plant continuum. More advanced implementations use reinforcement learning (RL) and decision-support systems that integrate seasonal soil health with immediate irrigation needs. These systems evaluate multi-season strategies, recommending combinations of irrigation, mulching, residue retention and nutrient management that maximize cumulative water productivity rather than single-season water-use efficiency. Getahun et al., (2024) [16] show that RL-based irrigation and cropping strategies outperform rulebased systems, especially in variable rainfall regimes.
Internet of things
The Internet of Things (IoT) is emerging as the ideal solution for implementing smart water management applications and precision agriculture to avoid under-and over-irrigation. However, the seamless integration of the different technologies required for its practical use is still a work in progress (Jagtap et al.,). The rise of the IoT is attributed to several converging factors, including affordable devices, low-power wireless technologies, the presence of cloud data centres for storage and processing, management frameworks for handling un structured data from social networks, high-performance computing resources on standard platforms, and computational intelligence algorithms tailored to process vast amounts of data (Ahmed et al., 2025) [17] . In recent years, the application of IoT technologies has emerged as a transformative force in agriculture, providing innovative solutions to improve efficiency, sustainability and productivity in various aspects of agriculture, with a focus on irrigation, water reuse, water pollution monitoring and livestock management. One of the key challenges in agriculture is efficient water management and water quality monitoring. IoT technologies have revolutionized this aspect by enabling real-time monitoring and decision making (Jagtap et al. By auto mating irrigation processes and integrating actuators controlled by microcontrollers, farmers can achieve significant water savings while maximizing crop yields. The development of mobile applications for remote monitoring and control further enhances the accessibility usability of these systems. Robots can be used in agriculture to save a lot of human labour by performing repetitive physical tasks. Although people have traditionally used agricultural machinery to work faster and with less physical effort (for example, tractors, harvesters, planters and sprayers), these machines have relied on human manoeuvring. The main advantage of using robots on farms is that they can monitor and decide what tasks need to be carried out and then carry them out. I n particular, the main applications of robotics for water management in agriculture are in the areas of crop and soil monitoring, and watering/irrigation. An example of these two applications is the work of Wu et al.), who developed a robot that can monitor soil temperature and humidity and automatically water crops when needed. Their system also used weather forecasts through Long Short-Term Memory, a type of artificial neural network architecture, to make more accurate irrigation decisions. Other parameters are also useful in deciding when to water crops and can be incorporated into robotic irrigation systems, such as stem water potential (Dechemi et al.) and leaf density (Baltazar et al.
There are a number of other robotic systems that support water use and management in agriculture. For example, developed a robotic irrigation system consisting of a moving bridge manipulator and a sensor-based platform to monitor soil water content. Fern´ andez-Novales et al. used a ground robot equipped with thermal infrared radiometry to assess water status in vineyards. Robots can also be used to monitor water quality parameters such as pH, turbidity and temperature, and to determine whether a water source should be used for a particular soil (Gupta et al., 2024) [7] . A particularly interesting application of robots in agricultural water management is the detection of water leaks. Türkler et al. integrated visible light and thermal camera sensors into a robot, enabling the system to detect water leaks in drip irrigation systems.
Smart Sensors
In agricultural water management, Smart Sensors (SSs) promote water use efficiency and enable precision irrigation. These advanced sensors provide up-to-date information on key environmental parameters such as soil moisture, temperature, humidity and rainfall. They provide real-time data for informed irrigation scheduling and water application decisions. While IoT typically encompasses large networks of sensors and actuators, we explicitly highlight SSs as a separate technology in this review to emphasize that they can function as standalone solutions with embedded processing capabilities. However, these smart sensors are often integrated into broader IoT architectures to enable data sharing and remote control. Over the years, many researchers have focused on the application of SSs for agricultural water management (Kumar Kasera et al.). Khoa et al. used IoT multisensors for water management. The system design includes three main components: sensors for data collection, a Long Range Radio Third-generation Technology transmission module for IoT connectivity over large areas, and a single-chip microprocessor for data processing. The system uses realtime data from sensors installed in farm tunnels and other locations to predict watering needs and recommend watering schedules. However, it relies on specific applications, such as Blynk, and has challenges with reliability and internet connectivity. To address this, an alternative solution is to develop a SS combined with other advanced open source technologies such as cloud computing, machine learning and data analytics tools. In this context, Tzerakis et al. developed an open source IoT platform for water management in agriculture, focusing mainly on optimal irrigation and pest control in olive orchards. The experiment involved the integration of soil and atmospheric monitoring SSs with microcontrollers. These sensors transmit data to a cloudbased IoT platform using the Message Queuing Telemetry Transport protocol. The system immediately alerts farmers when soil moisture falls below critical thresholds or pest risks increase. The platform also calculates the amount of water required for irrigation based on crop needs, helping farmers use water efficiently.
Conclusions
Artificial intelligence (AI) is reshaping modern soil management by enabling continuous, high-resolution assessment of soil organic matter (SOM), nutrient cycling efficiency, and water productivity three core pillars of soilhealth-led agricultural intensification. Through machine learning, remote sensing, IoT soil sensors, automated soil testing, and predictive modelling, AI provides the analytical power needed to move from uniform, reactive nutrient and water management to highly adaptive, site-specific, and forward-looking decision frameworks. AI-enhanced SOM monitoring uses spectral sensing, digital soil mapping, and deep-learning algorithms to quantify organic carbon patterns and track changes across seasons and management scenarios. These capabilities support targeted interventions such as precision residue retention, organic amendment placement, cover-crop optimization, and conservation tillage zoning. By linking SOM dynamics with yield and climatic variability, AI models help design strategies that maximize carbon inputs while minimizing losses through erosion and microbial decomposition. In nutrient cycling, AI-driven nutrient decision support systems integrate soil data, crop models, and weather forecasts to deliver variable-rate fertilizer recommendations that align nutrient release with crop demand. This reduces nitrogen and phosphorus losses, enhances soil biological activity, and strengthens nutrient-use efficiency-key objectives of regenerative intensification pathways. Similarly, AI-powered irrigation tools use real-time soil moisture, evapotranspiration forecasting, and crop water modelling to tailor irrigation schedules that improve wateruse efficiency and reduce energy and water waste. Despite these advances, challenges persist. Gaps in groundtruth soil data, inconsistencies in sensor accuracy, limited representativeness of training datasets, and model transferability issues across agroecological zones constrain the reliability of AI predictions. Integrating mechanistic soil process models with data-driven approaches remains essential for credible and scalable solutions. Moreover, inclusive co-design with farmers, transparent model outputs, and capacity building for extension systems are crucial for field-level adoption. AI holds transformative potential for enhancing SOM, nutrient cycling, and water productivity under soil-health-led intensification frameworks. When supported by robust data ecosystems, hybrid modelling approaches, and farmer-centric implementation, AI can enable productivity gains while restoring ecological functions supporting resilient, climate-smart, and sustainable agricultural systems.
Figures and tables from the paper
| Var No. | Variable | Unit | Punjab (Ludhiana) | Haryana (Karnal) | Western U.P. (Meerut) |
|---|---|---|---|---|---|
| 1. | Soil Organic Carbon | % | 0.62 | 0.55 | 0.71 |
| 2. | Microbial Biomass C | mg kg⁻¹ | 310 | 280 | 345 |
| 3. | Microbial Biomass N | mg kg⁻¹ | 34 | 29 | 38 |
| 4. | Mineralizable N | kg ha⁻¹ | 78 | 69 | 85 |
| 5. | Net N Mineralization | kg ha⁻¹ day⁻¹ | 0.58 | 0.51 | 0.63 |
| 6. | Nitrification Rate | mg kg⁻¹ day⁻¹ | 6.5 | 5.8 | 7.2 |
| 7. | Denitrification Potential | mg N₂O m⁻² h⁻¹ | 0.52 | 0.45 | 0.58 |
| 8. | Floodwater NH₄⁺ | mg L⁻¹ | 8.2 | 7.1 | 8.9 |
| 9. | Floodwater NO₃⁻ | mg L⁻¹ | 3.4 | 3.1 | 3.9 |
| 10. | Available N | kg ha⁻¹ | 294 | 268 | 310 |
| 11. | Available P | kg ha⁻¹ | 22 | 18 | 25 |
| 12. | Available K | kg ha⁻¹ | 240 | 220 | 255 |
| 13. | Sulfur | mg kg⁻¹ | 15 | 12 | 17 |
| 14. | Zn | mg kg⁻¹ | 1.1 | 0.8 | 1.3 |
| 15. | Fe | mg kg⁻¹ | 6.8 | 5.5 | 7.1 |
| 16. | Mn | mg kg⁻¹ | 8.2 | 7.4 | 9.0 |
| 17. | Soil pH | - | 7.6 | 7.9 | 7.4 |
| 18. | Ec | dS m⁻¹ | 0.41 | 0.58 | 0.34 |
| 19. | Bulk Density | g cm⁻³ | 1.48 | 1.52 | 1.45 |
| 20. | Soil Moisture | % | 28 | 24 | 30 |
| 21. | Water Percolation Rate | mm day⁻¹ | 6.4 | 8.2 | 5.8 |
| 22. | N Leaching Risk (AI) | 0-1 | 0.62 | 0.73 | 0.58 |
| 23. | Methane Emission Potential | mg CH₄ m⁻² h⁻¹ | 2.4 | 1.9 | 2.8 |
| 24. | Urease Activity | µg NH₄⁺ g⁻¹ h⁻¹ | 42 | 34 | 49 |
| 25. | Phosphate Activity | µg pNP g⁻¹ h⁻¹ | 298 | 240 | 325 |
| 26. | Dehydrogenase | µg TPF g⁻¹ h⁻¹ | 29 | 24 | 34 |
| 27. | β-Glucosidase | mg g⁻¹ h⁻¹ | 0.74 | 0.61 | 0.88 |
| 28. | Microbial Load | copies g⁻¹ | 2.5×10⁷ | 2.1×10⁷ | 2.9×10⁷ |
| 29. | AI-N Uptake | kg ha⁻¹ | 102 | 94 | 115 |
| 30. | AI-P Uptake | kg ha⁻¹ | 15 | 13 | 18 |
| 31. | AI-K Uptake | kg ha⁻¹ | 92 | 84 | 105 |
| 32. | Leaf N Content | % | 2.4 | 2.1 | - |
| 33. | SPAD | - | 44 | 40 | 48 |
| 34. | NDVI | - | 0.80 | 0.75 | 0.83 |
| 35. | AI-Yield Prediction | t ha⁻¹ | 6.4 | 5.9 | 6.8 |
| 36. | Actual Yield | t ha⁻¹ | 6.1 | 5.5 | 6.3 |
| 37. | C:N Ratio Residue | - | 38 | 42 | 35 |
| 38. | Residue Decomposition Rate | % month⁻¹ | 26 | 21 | 29 |
| 39. | Soil Respiration | mg CO₂ m⁻² h⁻¹ | 590 | 540 | 645 |
| 40. | GHG Intensity | kg CO₂-eq ha⁻¹ | 945 | 880 | 1020 |
| 41. | Soil Food Web Complexity | 0-1 | 0.61 | 0.52 | 0.70 |
| 42. | AI-N Recommendation | kg ha⁻¹ | 135 | 148 | 122 |
| 43. | AI-P Recommendation | kg ha⁻¹ | 38 | 34 | 42 |
| 44. | AI-K Recommendation | kg ha⁻¹ | 62 | 58 | 70 |
| 45. | Water Productivity | kg grain m⁻³ | 1.24 | 1.12 | 1.32 |
| 46. | K Cycling Efficiency | % | 44 | 38 | 50 |
| 47. | Nutrient Fertility Index | 0-100 | 78 | 68 | 82 |
| 48. | Nutrient Cycling Score | 0-1 | 0.72 | 0.61 | 0.78 |
| 49. | Load of Methanogens | copies g⁻¹ | 1.8×10⁶ | 1.2×10⁶ | 2.1×10⁶ |
| 50. | Redox Potential | mV | -145 | -128 | -155 |
Table text extracted from the original PDF; superscript letters are shown inline. The original table image is below.
View original table image
| Var No. | Variable | Unit | Punjab (Ludhiana) | Haryana (Hisar) | Western U.P. (Bulandsahar) |
|---|---|---|---|---|---|
| 1 | Soil Organic Carbon | % | 0.58 | 0.42 | 0.70 |
| 2 | Active Carbon | mg kg⁻¹ | 425 | 305 | 490 |
| 3 | Microbial Biomass C | mg kg⁻¹ | 295 | 220 | 350 |
| 4 | Microbial Biomass N | mg kg⁻¹ | 29 | 21 | 36 |
| 5 | Mineralizable N | kg ha⁻¹ | 64 | 48 | 78 |
| 6 | Nitrification Rate | mg kg⁻¹ day⁻¹ | 5.1 | 3.8 | 6.2 |
| 7 | Denitrification Potential | mg N₂O m⁻² h⁻¹ | 0.34 | 0.25 | 0.40 |
| 8 | Soil Respiration | mg CO₂ m⁻² h⁻¹ | 480 | 380 | 520 |
| 9 | Total N | % | 0.075 | 0.052 | 0.091 |
| 10 | Available N | kg ha⁻¹ | 210 | 165 | 245 |
| 11 | Available P | kg ha⁻¹ | 20 | 12 | 26 |
| 12 | Available K | kg ha⁻¹ | 210 | 165 | 245 |
Table text extracted from the original PDF; superscript letters are shown inline. The original table image is below.
View original table image
| 13 | Ca | cmol kg⁻¹ | 7.0 | 5.8 | 7.6 |
|---|---|---|---|---|---|
| 14 | Mg | cmol kg⁻¹ | 2.8 | 2.1 | 3.2 |
| 15 | Zn | mg kg⁻¹ | 0.9 | 0.52 | 1.2 |
| 16 | Soil pH | - | 7.8 | 8.2 | 7.4 |
| 17 | EC | dS m⁻¹ | 0.29 | 0.46 | 0.24 |
| 18 | Soil Moisture | % | 18 | 12 | 22 |
| 19 | Bulk Density | g cm⁻³ | 1.39 | 1.52 | 1.33 |
| 20 | Water Holding Capacity | % | 44 | 32 | 52 |
| 21 | Aggregate Stability | % | 54 | 41 | 63 |
| 22 | β-Glucosidase | mg g⁻¹ h⁻¹ | 0.80 | 0.55 | 0.95 |
| 23 | Urease | µg NH₄⁺ g⁻¹ h⁻¹ | 36 | 28 | 42 |
| 24 | Phosphatase | µg pNP g⁻¹ h⁻¹ | 250 | 185 | 310 |
| 25 | Dehydogenase | µg TPF g⁻¹ h⁻¹ | 28 | 17 | 36 |
| 26 | Fungal:Bacterial Ratio | - | 0.52 | 0.38 | 0.68 |
| 27 | Microbial Load | copies g⁻¹ | 1.9×10⁷ | 1.2×10⁷ | 2.4×10⁷ |
| 28 | AI-N Uptake | kg ha⁻¹ | 94 | 65 | 115 |
| 29 | AI-P Uptake | kg ha⁻¹ | 16 | 10 | 22 |
| 30 | AI-K Uptake | kg ha⁻¹ | 78 | 52 | 102 |
| 31 | Leaf N | % | 2.1 | 1.6 | 2.4 |
| 32 | SPAD | - | 42 | 35 | 46 |
| 33 | NDVI | - | 0.78 | 0.66 | 0.83 |
| 34 | Biomass Production | t ha⁻¹ | 11.2 | 8.5 | 12.4 |
| 35 | AI Yield | t ha⁻¹ | 5.6 | 3.9 | 6.3 |
| 36 | Actual Yield | t ha⁻¹ | 5.1 | 3.4 | 5.8 |
| 37 | N Cycling Efficiency | % | 44 | 32 | 52 |
| 38 | P Cycling Efficiency | % | 31 | 18 | 40 |
| 39 | K Cycling Efficiency | % | 38 | 28 | 48 |
| 40 | AI-N Recommendation | kg ha⁻¹ | 130 | 150 | 110 |
| 41 | AI-P Recommendation | kg ha⁻¹ | 36 | 28 | 42 |
| 42 | AI-K Recommendation | kg ha⁻¹ | 58 | 48 | 70 |
| 43 | Soil Fertility Index | 0-100 | 75 | 58 | 84 |
| 44 | Nutrient Cycling Score | 0-1 | 0.68 | 0.52 | 0.78 |
| 45 | N Leaching Risk | 0-1 | 0.38 | 0.52 | 0.29 |
| 46 | P Fixation Risk | 0-1 | 0.41 | 0.58 | 0.34 |
| 47 | AI-Carbon Budget Change | kg C ha⁻¹ yr⁻¹ | +380 | +210 | +450 |
| 48 | Soil Temperature | °C | 23.5 | 27.2 | 22.4 |
| 49 | Residue Retention Effects | % yield gain | 12 | 6 | 16 |
| 50 | Water Productivity | kg grain m⁻³ | 1.32 | 0.78 | 1.45 |
| 51 | Soil Nitrate | mg kg⁻¹ | 26 | 14 | 34 |
| 52 | Soil Ammonium | mg kg⁻¹ | 13 | 8 | 17 |
| 53 | AI-N Supply Adequacy | % | 82 | 54 | 91 |
| 54 | Soil Biological Health Score | 0-100 | 72 | 55 | 82 |
Table text extracted from the original PDF; superscript letters are shown inline. The original table image is below.
View original table image
| Var No. | Variable | Unit | U.P. (Meerut) | Haryana (Yamunanagar) | Punjab (Gurdaspur) |
|---|---|---|---|---|---|
| 1. | Soil Organic Carbon | % | 0.68 | 0.52 | 0.75 |
| 2. | Active Carbon | mg kg⁻¹ | 510 | 410 | 550 |
| 3. | Microbial Biomass C | mg kg⁻¹ | 380 | 290 | 420 |
| 4. | Microbial Biomass N | mg kg⁻¹ | 42 | 29 | 48 |
| 5. | Mineralizable N | kg ha⁻¹ | 85 | 62 | 94 |
| 6. | N Mineralization Rate | kg ha⁻¹ day⁻¹ | 0.62 | 0.44 | 0.72 |
| 7. | Nitrification Rate | mg kg⁻¹ day⁻¹ | 7.5 | 5.4 | 8.1 |
| 8. | Denitrification | mg N₂O m⁻² h⁻¹ | 0.52 | 0.38 | 0.61 |
| 9. | Soil Respiration | mg CO₂ m⁻² h⁻¹ | 655 | 520 | 710 |
| 10. | SOC Sequestration | kg ha⁻¹ yr⁻¹ | 520 | 310 | 580 |
| 11. | Available N | kg ha⁻¹ | 310 | 220 | 340 |
| 12. | Available P | kg ha⁻¹ | 28 | 15 | 34 |
| 13. | Available K | kg ha⁻¹ | 260 | 200 | 295 |
| 14. | S | mg kg⁻¹ | 17 | 11 | 22 |
| 15. | Zn | mg kg⁻¹ | 1.3 | 0.7 | 1.6 |
| 16. | pH | - | 7.8 | 8.1 | 7.5 |
| 17. | Soil Moisture | % | 23 | 17 | 26 |
| 18. | Bulk Density | g cm⁻³ | 1.34 | 1.46 | 1.32 |
| 19. | Hydraulic Conductivity | cm hr⁻¹ | 0.42 | 0.31 | 0.48 |
| 20. | Aggregate Stability | % | 62 | 49 | 68 |
| 21. | Urease | µg NH₄⁺ g⁻¹ h⁻¹ | 44 | 30 | 52 |
| 22. | Phosphatase | µg pNP g⁻¹ h⁻¹ | 320 | 210 | 360 |
| 23. | Dehydrogenase | µg TPF g⁻¹ h⁻¹ | 34 | 22 | 40 |
Table text extracted from the original PDF; superscript letters are shown inline. The original table image is below.
View original table image
| 24. | β-Glucosidase | mg g⁻¹ h⁻¹ | 1.02 | 0.70 | 1.18 |
|---|---|---|---|---|---|
| 25. | Microbial Load | copies g⁻¹ | 3.4×10⁷ | 2.2×10⁷ | 3.8×10⁷ |
| 26. | AI-P Uptake | kg ha⁻¹ | 22 | 14 | 28 |
| 27. | AI-N Uptake | kg ha⁻¹ | 135 | 110 | 150 |
| 28. | AI-K Uptake | kg ha⁻¹ | 115 | 94 | 136 |
| 29. | Leaf N | % | 1.85 | 1.62 | 2.10 |
| 30. | Stalk Biomass | t ha⁻¹ | 82 | 65 | 95 |
| 31. | Cane Yield | t ha⁻¹ | 78 | 62 | 90 |
| 32. | Sucrose % | % | 18.2 | 17.1 | 19.0 |
| 33. | AI-Yield Prediction | t ha⁻¹ | 81 | 63 | 92 |
| 34. | N Cycling Efficiency | % | 58 | 42 | 64 |
| 35. | P Cycling Efficiency | % | 36 | 22 | 42 |
| 36. | K Cycling Efficiency | % | 49 | 38 | 54 |
| 37. | Soil Fertility Score | 0-100 | 82 | 68 | 88 |
| 38. | Biological Activity Index | 0-100 | 85 | 60 | 92 |
| 39. | AI-N Recommendation | kg ha⁻¹ | 160 | 185 | 145 |
| 40. | AI-P Recommendation | kg ha⁻¹ | 42 | 32 | 52 |
| 41. | AI-K Recommendation | kg ha⁻¹ | 92 | 78 | 110 |
| 42. | Water Productivity | kg cane m⁻³ | 11.2 | 8.5 | 12.4 |
| 43. | Soil Nitrate | mg kg⁻¹ | 34 | 18 | 42 |
| 44. | AI-N Loss Risk | 0-1 | 0.48 | 0.62 | 0.38 |
| 45. | P Fixation Risk | 0-1 | 0.34 | 0.55 | 0.28 |
| 46. | Soil K Availability Index | 0-1 | 0.78 | 0.62 | 0.84 |
| 47. | Biological Nitrogen Fixation | kg N ha⁻¹ | 14 | 10 | 18 |
| 48. | Residue Decomposition | % | 32 | 24 | 36 |
| 49. | Soil Health Index | 0-100 | 84 | 62 | 90 |
| 50. | Nutrient Cycling Score | 0-1 | 0.78 | 0.60 | 0.85 |
Table text extracted from the original PDF; superscript letters are shown inline. The original table image is below.
View original table image
| Var No. | Variable | Unit | Haryana (Karnal) | Punjab (Ludhiana) | Western U.P. (Meerut) | Rajasthan (Bharatpur) |
|---|---|---|---|---|---|---|
| 1. | Soil pH | - | 7.9 | 8.2 | 7.3 | 8.3 |
| 2. | EC | dS/m | 0.40 | 0.36 | 0.28 | 0.58 |
| 3. | SOC | g/kg | 4.1 | 4.8 | 6.5 | 2.2 |
| 4. | SOM | g/kg | 7.0 | 8.2 | 11.1 | 3.8 |
| 5. | Total N | g/kg | 0.36 | 0.41 | 0.56 | 0.20 |
| 6. | Avail P | mg/kg | 16 | 18 | 21 | 11 |
| 7. | Avail K | mg/kg | 155 | 165 | 145 | 150 |
| 8. | Soil Moisture | % | 19 | 22 | 26 | 11 |
| 9. | Bulk Density | g/cm³ | 1.50 | 1.47 | 1.42 | 1.58 |
| 10. | CEC | cmol/kg | 15 | 15 | 17 | 11 |
| 11. | Calcium | cmol/kg | 18 | 19 | 20 | 16 |
| 12. | Magnesium | cmol/kg | 4.2 | 4.5 | 5.2 | 3.6 |
| 13. | Sulphur | mg/kg | 10 | 9 | 12 | 7 |
| 14. | Zinc | mg/kg | 0.60 | 0.62 | 0.78 | 0.42 |
| 15. | Iron | mg/kg | 4.6 | 5.2 | 6.3 | 3.9 |
| 16. | Manganese | mg/kg | 5.3 | 6.1 | 6.9 | 3.2 |
| 17. | Copper | mg/kg | 0.80 | 0.82 | 0.89 | 0.56 |
| 18. | Boron | mg/kg | 0.40 | 0.42 | 0.49 | 0.29 |
| 19. | Plant-Available Si | mg/kg | 48 | 49 | 53 | 33 |
| 20. | ESP (Sodicity) | % | 5.5 | 5 | 4 | 10 |
| 21. | MBC | mg/kg | 185 | 215 | 270 | 125 |
| 22. | MBN | mg/kg | 19 | 23 | 29 | 12 |
| 23. | Soil Respiration | mg CO₂/kg/hr | 29 | 31 | 35 | 19 |
| 24. | Dehydrogenase | µg TPF/g/hr | 30 | 36 | 44 | 19 |
| 25. | Phosphatase | µg PNP/g/hr | 215 | 245 | 285 | 155 |
| 26. | Microbial Diversity | 0-10 | 4.7 | 5.3 | 6.5 | 3.2 |
| 27. | Earthworms | No./m² | 5 | 7 | 11 | 2 |
| 28. | OC Stability | % | 30 | 33 | 41 | 19 |
| 29. | Active Carbon | g/kg | 2.0 | 2.2 | 3.0 | 1.1 |
| 30. | N Mineralization | kg/ha | 36 | 39 | 46 | 23 |
| 31. | Infiltration | mm/hr | 5.0 | 5.3 | 6.1 | 2.6 |
| 32. | WHC | % | 33 | 36 | 39 | 23 |
| 33. | Aggregate Stability | % | 44 | 46 | 53 | 28 |
| 34. | Compaction | MPa | 1.55 | 1.65 | 1.45 | 2.05 |
| 35. | Porosity | % | 42 | 44 | 49 | 36 |
| 36. | Nitrification | mg/kg/day | 2.9 | 3.1 | 3.7 | 2.0 |
| 37. | Denitrification | mg/kg/day | 1.3 | 1.6 | 2.1 | 1.0 |
| 38. | K Fixation | % | 18 | 20 | 23 | 12 |
| 39. | P Fixation | % | 27 | 30 | 25 | 19 |
| 40. | Crust Strength | kg/cm² | 1.1 | 1.2 | 0.9 | 1.9 |
Table text extracted from the original PDF; superscript letters are shown inline. The original table image is below.
View original table image
| 41. | AI N Deficit | kg/ha | 58 | 52 | 42 | 72 |
|---|---|---|---|---|---|---|
| 42. | AI P Deficit | kg/ha | 19 | 23 | 15 | 26 |
| 43. | AI K Deficit | kg/ha | 11 | 12 | 10 | 19 |
| 44. | AI S Requirement | kg/ha | 24 | 25 | 18 | 34 |
| 45. | AI Zn Requirement | kg/ha | 6.2 | 6.6 | 5.1 | 7.8 |
| 46. | AI B Requirement | kg/ha | 1.3 | 1.4 | 1.05 | 1.9 |
| 47. | Soil Biological Health | 0-100 | 50 | 56 | 66 | 40 |
| 48. | Nutrient Cycling Efficiency | % | 54 | 56 | 63 | 41 |
| 49. | AI Yield Constraint Index | 0-1 | 0.56 | 0.51 | 0.41 | 0.71 |
| 50. | AI Soil Health Index | 0-100 | 56 | 63 | 69 | 43 |
Table text extracted from the original PDF; superscript letters are shown inline. The original table image is below.
View original table image
| Var No. | Variable | Unit | Haryana (Karnal) | Punjab (Ludhiana) | Western U.P. (Meerut) | Rajasthan (Bharatpur) |
|---|---|---|---|---|---|---|
| 1. | Soil pH | - | 7.7 | 8.0 | 7.1 | 8.2 |
| 2. | EC | dS/m | 0.38 | 0.35 | 0.26 | 0.55 |
| 3. | SOC | g/kg | 4.5 | 5.0 | 7.0 | 2.4 |
| 4. | SOM | g/kg | 7.4 | 8.6 | 12.0 | 4.0 |
| 5. | Total N | g/kg | 0.37 | 0.42 | 0.60 | 0.22 |
| 6. | Avail P | mg/kg | 18 | 20 | 24 | 12 |
| 7. | Avail K | mg/kg | 165 | 175 | 160 | 155 |
| 8. | Soil Moisture | % | 20 | 23 | 28 | 12 |
| 9. | Bulk Density | g/cm³ | 1.48 | 1.46 | 1.38 | 1.55 |
| 10. | CEC | cmol/kg | 16 | 16 | 18 | 12 |
| 11. | Ca | cmol/kg | 18 | 19 | 21 | 16 |
| 12. | Mg | cmol/kg | 4.4 | 4.6 | 5.4 | 3.7 |
| 13. | Sulphur | mg/kg | 12 | 11 | 14 | 8 |
| 14. | Zinc | mg/kg | 0.68 | 0.70 | 0.85 | 0.45 |
| 15. | Iron | mg/kg | 4.8 | 5.4 | 6.5 | 4.0 |
| 16. | Mn | mg/kg | 5.5 | 6.3 | 7.2 | 3.3 |
| 17. | Cu | mg/kg | 0.82 | 0.84 | 0.92 | 0.58 |
| 18. | B | mg/kg | 0.42 | 0.44 | 0.51 | 0.30 |
| 19. | Plant Si | mg/kg | 50 | 52 | 55 | 34 |
| 20. | ESP | % | 5 | 5 | 4 | 9 |
| 21. | MBC | mg/kg | 200 | 230 | 290 | 135 |
| 22. | MBN | mg/kg | 21 | 25 | 32 | 13 |
| 23. | Respiration | mg CO₂/kg/hr | 31 | 33 | 38 | 20 |
| 24. | Dehydrogenase | µg TPF/g/hr | 32 | 38 | 48 | 20 |
| 25. | Phosphatase | µg PNP/g/hr | 220 | 250 | 300 | 160 |
| 26. | Diversity | 0-10 | 5.0 | 5.5 | 6.7 | 3.3 |
| 27. | Earthworms | No./m² | 6 | 8 | 12 | 2 |
| 28. | OC Stability | % | 32 | 34 | 43 | 20 |
| 29. | Active Carbon | g/kg | 2.2 | 2.4 | 3.3 | 1.2 |
| 30. | N Mineralization | kg/ha | 38 | 41 | 50 | 24 |
| 31. | Infiltration | mm/hr | 5.2 | 5.5 | 6.5 | 2.8 |
| 32. | WHC | % | 34 | 37 | 40 | 24 |
| 33. | Aggregate Stability | % | 45 | 47 | 55 | 29 |
| 34. | Compaction | MPa | 1.50 | 1.60 | 1.40 | 2.00 |
| 35. | Porosity | % | 43 | 45 | 50 | 37 |
| 36. | Nitrification | mg/kg/day | 3.1 | 3.3 | 3.9 | 2.1 |
| 37. | Denitrification | mg/kg/day | 1.4 | 1.7 | 2.2 | 1.0 |
| 38. | K Fixation | % | 19 | 21 | 24 | 13 |
| 39. | P Fixation | % | 28 | 30 | 24 | 20 |
| 40. | Crust Strength | kg/cm² | 1.0 | 1.1 | 0.8 | 1.7 |
| 41. | AI N Deficit | kg/ha | 65 | 58 | 48 | 80 |
| 42. | AI P Deficit | kg/ha | 20 | 24 | 16 | 27 |
| 43. | AI K Deficit | kg/ha | 15 | 14 | 12 | 21 |
| 44. | AI S Requirement | kg/ha | 28 | 27 | 20 | 36 |
| 45. | AI Zn Requirement | kg/ha | 7.0 | 7.2 | 5.4 | 8.1 |
| 46. | AI B Requirement | kg/ha | 1.4 | 1.5 | 1.1 | 2.0 |
| 47. | Soil Biological Health | 0-100 | 58 | 60 | 72 | 42 |
| 48. | Nutrient Cycling Efficiency | % | 56 | 58 | 66 | 42 |
| 49. | AI Yield Constraint Index | 0-1 | 0.60 | 0.52 | 0.43 | 0.75 |
| 50. | AI Soil Health Index | 0-100 | 60 | 65 | 74 | 45 |
Table text extracted from the original PDF; superscript letters are shown inline. The original table image is below.
View original table image
| Var No. | Variable | Unit | Haryana (Karnal) | Punjab (Ludhiana) | Western U.P. (Meerut) | Rajasthan (Bharatpur) |
|---|---|---|---|---|---|---|
| 1. | Soil pH | - | 7.8 | 8.1 | 7.2 | 8.3 |
| 2. | EC | dS/m | 0.42 | 0.37 | 0.29 | 0.60 |
| 3. | SOC | g/kg | 4.2 | 4.7 | 6.8 | 2.3 |
| 4. | SOM | g/kg | 7.2 | 8.0 | 11.5 | 3.9 |
| 5. | Total N | g/kg | 0.38 | 0.42 | 0.58 | 0.21 |
| 6. | Avail P | mg/kg | 17 | 19 | 23 | 12 |
| 7. | Avail K | mg/kg | 160 | 170 | 150 | 155 |
| 8. | Moisture | % | 19 | 21 | 27 | 11 |
| 9. | Bulk Density | g/cm³ | 1.49 | 1.47 | 1.40 | 1.57 |
| 10. | CEC | cmol/kg | 15 | 16 | 18 | 11 |
| 11. | Ca | cmol/kg | 18 | 19 | 21 | 16 |
| 12. | Mg | cmol/kg | 4.3 | 4.6 | 5.3 | 3.7 |
| 13. | Sulphur | mg/kg | 11 | 10 | 13 | 7 |
| 14. | Zinc | mg/kg | 0.63 | 0.65 | 0.82 | 0.43 |
| 15. | Iron | mg/kg | 4.7 | 5.3 | 6.4 | 3.9 |
| 16. | Mn | mg/kg | 5.4 | 6.2 | 7.0 | 3.2 |
| 17. | Cu | mg/kg | 0.81 | 0.83 | 0.91 | 0.57 |
| 18. | Boron | mg/kg | 0.41 | 0.43 | 0.50 | 0.29 |
| 19. | Plant Si | mg/kg | 49 | 51 | 54 | 34 |
| 20. | ESP | % | 5 | 5 | 4 | 10 |
| 21. | MBC | mg/kg | 190 | 220 | 280 | 130 |
| 22. | MBN | mg/kg | 20 | 24 | 30 | 12 |
| 23. | Respiration | mg CO₂/kg/hr | 30 | 32 | 36 | 19 |
| 24. | Dehydrogenase | µg TPF/g/hr | 31 | 37 | 46 | 19 |
| 25. | Phosphatase | µg PNP/g/hr | 218 | 248 | 295 | 158 |
| 26. | Diversity | 0-10 | 4.8 | 5.3 | 6.6 | 3.2 |
| 27. | Earthworms | No./m² | 5 | 7 | 11 | 2 |
| 28. | OC Stability | % | 31 | 34 | 42 | 19 |
| 29. | Active Carbon | g/kg | 2.1 | 2.3 | 3.1 | 1.1 |
| 30. | N Mineralization | kg/ha | 37 | 40 | 48 | 23 |
| 31. | Infiltration | mm/hr | 5.1 | 5.4 | 6.2 | 2.7 |
| 32. | WHC | % | 33 | 35 | 39 | 23 |
| 33. | Aggregates | % | 44 | 46 | 54 | 28 |
| 34. | Compaction | MPa | 1.52 | 1.62 | 1.42 | 2.03 |
| 35. | Porosity | % | 42 | 44 | 49 | 36 |
| 36. | Nitrification | mg/kg/day | 3.0 | 3.2 | 3.8 | 2.0 |
| 37. | Denitrification | mg/kg/day | 1.3 | 1.6 | 2.1 | 1.0 |
| 38. | K Fixation | % | 19 | 21 | 24 | 13 |
| 39. | P Fixation | % | 27 | 30 | 25 | 20 |
| 40. | Crust Strength | kg/cm² | 1.05 | 1.15 | 0.85 | 1.75 |
| 41. | AI N Deficit | kg/ha | 60 | 54 | 44 | 75 |
| 42. | AI P Deficit | kg/ha | 19 | 23 | 15 | 26 |
| 43. | AI K Deficit | kg/ha | 12 | 13 | 10 | 20 |
| 44. | AI S Requirement | kg/ha | 25 | 26 | 19 | 35 |
| 45. | AI Zn Requirement | kg/ha | 6.5 | 6.7 | 5.2 | 7.9 |
| 46. | AI B Requirement | kg/ha | 1.3 | 1.4 | 1.1 | 1.9 |
| 47. | Biological Health | 0-100 | 52 | 57 | 68 | 40 |
| 48. | Nutrient Cycling Efficiency | % | 55 | 57 | 64 | 41 |
| 49. | AI Yield Constraint Index | 0-1 | 0.57 | 0.52 | 0.42 | 0.73 |
| 50. | AI Soil Health Index | 0-100 | 57 | 63 | 71 | 43 |
Table text extracted from the original PDF; superscript letters are shown inline. The original table image is below.
View original table image
References
17 in the original paper- Astier M, Debaeke P, Thivolle-Cazat A. Carbon sequestration in agricultural soils via cultivation of cover crops: A meta-analysis. Agriculture, Ecosystems & Environment. 2014;188:91-100.
- Awais M, Ahmed S, Rafique M, Ali S, Khan A. AI and machine-learning for soil analysis: An assessment of sustainable agricultural practices. Bioresources and Bioprocessing. 2023;10:90.
- Chen X, Li F, Zhao Y, Sun L, Qiao J. Dynamic monitoring and precision fertilization decision system for reducing nutrient losses and improving NUE. Agriculture. 2025;15:248.
- Crystal-Ornelas R, Thapa R, Tully KL. Soil organic carbon is affected by organic amendments, conservation tillage, and cover cropping in organic farming systems: International Journal of Agriculture and Food Science https://www.agriculturaljournals.com A meta-analysis. Agriculture, Ecosystems & Environment. 2021;312:107335.
- Doyeni MO, Kadziene G, Pranaitiene S, Slepetiene A, Skersiene A, Shamshitov A, et al. A Comparative Study of Agroecological Intensification across Diverse European Agricultural Systems to Assess Soil Structure and Carbon Dynamics. Agronomy. 2024;14(12):3024.
- Folorunso O, Ajao L, Oyetola S. Exploring machine learning models for soil nutrient properties prediction: A systematic review. Data. 2023;8(5):113.
- Gupta R, Pothapragada SK, Xu W, Rowland D, Zotarelli L, Vashisth G. Estimating soil mineral nitrogen from data-sparse field experiments using a crop model-guided deep learning approach. Computers and Electronics in Agriculture. 2024;225:109355.
- Hatano R, Mukumbuta I, Shimizu M. Soil Health Intensification through Strengthening Soil Structure Improves Soil Carbon Sequestration. Agriculture. 2024;14(8):1290.
- Lehmann J, Bossio DA, Kögel-Knabner I, Rillig MC. The concept and future prospects of soil health. Nature Reviews Earth & Environment. 2020;1(10):544-553.
- Souza Krupek FS, Redfearn D, Eskridge KM, Basche A, Thompson L, others. Ecological intensification with soil health practices demonstrates positive impacts on multiple soil properties: A large-scale farmer-led experiment. Geoderma. 2022;115594.
- Sun M, Yang Y, Li S, Zhang Z, Wang J. A study on hyperspectral soil total nitrogen inversion using a hybrid deep learning model (CBiResNet-BiLSTM). Chemical and Biological Technologies in Agriculture. 2024;11:157.
- Terence JS, Purushothaman G. Low-cost real-time implementation of malicious packet dropping detection in agricultural IoT platform. In: Tripathy AK, Sarkar M, Sahoo JP, Li KC, Chinara S, editors. Advances in Distributed Computing and Machine Learning. Lecture Notes in Networks and Systems. Vol. 127. Singapore: Springer; 2020. p. 87-97.
- Zayani H, Fouad Y, Michot D, Kassouk Z, Baghdadi N, Vaudour E, et al. Using Machine-Learning Algorithms to Predict Soil Organic Carbon Content from Combined Remote Sensing Imagery and Laboratory Vis-NIR Spectral Datasets. Remote Sensing. 2023;15(17):4264.
- Zhou T, Geng Y, Chen J, Pan J, Haase D, Lausch A. High-resolution digital mapping of soil organic carbon and soil total nitrogen in agricultural areas using machine-learning and remote-sensing data. Science of the Total Environment. 2020;729:138244.
- Krishnan SR, Nallakaruppan MK, Chengoden R, et al. Smart Water Resource Management Using Artificial Intelligence: A Review. Sustainability. 2022;14(20):13384.
- Getahun S, Kefale H, Gelaye Y. Application of Precision Agriculture Technologies for Sustainable Crop Production and Environmental Sustainability: A Systematic Review. The Scientific World Journal. 2024; Article ID: (no page numbers provided).
- Sazzad MM, Ahmed T, Kibria G, et al. IoT based soil moisture measurement and type prediction using advanced regression and machine learning models. Scientific Reports. 2025;15:35730.
Cited by 1
From OpenAlex, OpenCitations and reference lists read by Scinovex
- Enhancing Soil Organic Matter Estimation Using Advanced Machine Learning Algorithms: A Comparative Study of PolSAR and IoT Sensor Data ↗
Maziar Ravan Bakhsh, Zümrüt Ecevit Satı · Acta Infologica · 2026
Monitoring soil organic matter (SOM) is a cornerstone of sustainable agriculture and food authenticity verification, yet traditional laboratory-based assessments are too resource-intensive for regional-scale deployment. This study presents a rigorous comparative evaluation of two sensing modalities: a terrestrial IoT sensor network and polarimetric synthetic aperture radar (PolSAR). To address the lack of laboratory-certified labels, we engineered the Soil Fertility Index…
❝ 0PDF