
Research article · 2025 · Full text
International Journal of Agriculture and Food ScienceCan the synergy between supplementary irrigation and fertilizer improve chili pepper productivity in semi-arid climates? Lessons from the WACWISA experimental site in Ghana
Volume 7(11) · Pages 640–647 · DOI: 10.33545/2664844x.2025.v7.i11i.1016 ↗
Research areasIrrigation Practices and Water ManagementClimate change impacts on agricultureGreenhouse Technology and Climate Control
Abstract
Author-writtenChili pepper production in the Guinea Savannah agro-ecological zone of Ghana is predominantly rainfed, making it highly susceptible to irregular rainfall patterns and low soil fertility. To mitigate these challenges and enhance productivity, the use of supplementary irrigation (SI) and recommended fertilizer application has been well-known as a potential strategy. This study aimed to evaluate the growth and yield performance of chili pepper under SI compared to rainfed conditions cultivated under different fertilizer rates. A 4 × 2 factorial experiment was conducted at the WACWISA experimental site located within the University for Development Studies, Nyankpala Campus, set up in a Randomized Complete Block Design (RCBD) with 3 replications. Treatments included four fertilizer levels (0, 100, 150, and 200 kg/ha) and two water regimes: rainfed and supplementary irrigation. Growth and yield parameters were collected and analyzed using ANOVA. Results revealed that supplementary irrigation combined with the highest fertilizer rate (200 kg/ha) produced the tallest plants at all observed intervals (2, 4, 6, and 8 weeks after transplanting), while rainfed plots without fertilizer recorded the lowest growth. SI also promoted a higher number of leaves, with 29.8 at 2 weeks after transplanting (WAT) and 48.3 at 4 WAT, compared to rainfed plots which recorded the lowest. Similarly, applying 200 kg/ha NPK resulted in the highest leaf number (47.5) at 4 WAT compared to 26 in control plots. The highest leaf area index (LAI) and chlorophyll content (69.50 SPAD) were also observed under SI. The interaction of SI and 200 kg/ha NPK produced the greatest biomass and highest yield (3.51 tons/ha), while rainfed conditions without fertilizer had the least (1.50 tons/ha). These findings demonstrate that supplementary irrigation, when combined with 200 kg/ha NPK fertilizer, significantly improves the performance of chili pepper in Northern Ghana.
Summary
Source-checkedPlain-language reading of the full paper, prepared with AI and checked against the text. Each point links to the authors' own words.
Why it matters
- In Ghana's Guinea Savannah zone, chili pepper production relies mostly on rain, which leaves crops vulnerable to poor soil fertility and unpredictable rainfall. View evidence ↗
- The global demand for chili peppers is rising due to their increasing use as fresh dishes, condiments, and additives in the pharmaceutical and food industries. View evidence ↗
- There is a significant yield gap in chili pepper production, with farmers achieving only about 50% of the potential yields. View evidence ↗
The question
- The study aimed to compare the growth and yield of chili peppers under supplementary irrigation (SI) versus rainfed conditions across various fertilizer application rates. View evidence ↗
What they did
- The researchers used a 4 × 2 factorial experiment in a Randomized Complete Block Design with three replications at the WACWISA site in Ghana. View evidence ↗
- The experimental treatments consisted of two water regimes (rainfed and supplementary irrigation) and four NPK fertilizer levels: 0, 100, 150, and 200 kg/ha. View evidence ↗
- Data were collected from five tagged plants per experimental unit and analyzed using ANOVA. View evidence ↗
What they found
- The tallest plants across all observation intervals (2, 4, 6, and 8 weeks after transplanting) were found in plots receiving both supplementary irrigation and the maximum fertilizer rate of 200 kg/ha. View evidence ↗
- Supplementary irrigation led to a higher leaf count, reaching 29.8 leaves at 2 weeks after transplanting (WAT) and 48.3 leaves at 4 WAT, outperforming rainfed plots. View evidence ↗
- At 4 WAT, the application of 200 kg/ha NPK resulted in the highest leaf count of 47.5, compared to 26 leaves in the control plots. View evidence ↗
- The combination of supplementary irrigation and 200 kg/ha NPK produced the highest above-ground biomass (55.56 g), whereas rainfed plots without fertilizer produced the lowest (2.29 g). View evidence ↗
- Supplementary irrigation achieved the highest total yield of 3.51 tons/ha (67.7% of total yield), while rainfed plots had the lowest yield of 1.50 tons/ha (32.3% of total yield). View evidence ↗
What it means
- The authors recommend using a spray tube supplementary irrigation system combined with 200 kg/ha of fertilizer to maximize chili pepper production. View evidence ↗
Visual summary
3 visualsIllustrations explain the paper; charts are replotted from the paper's own table values.
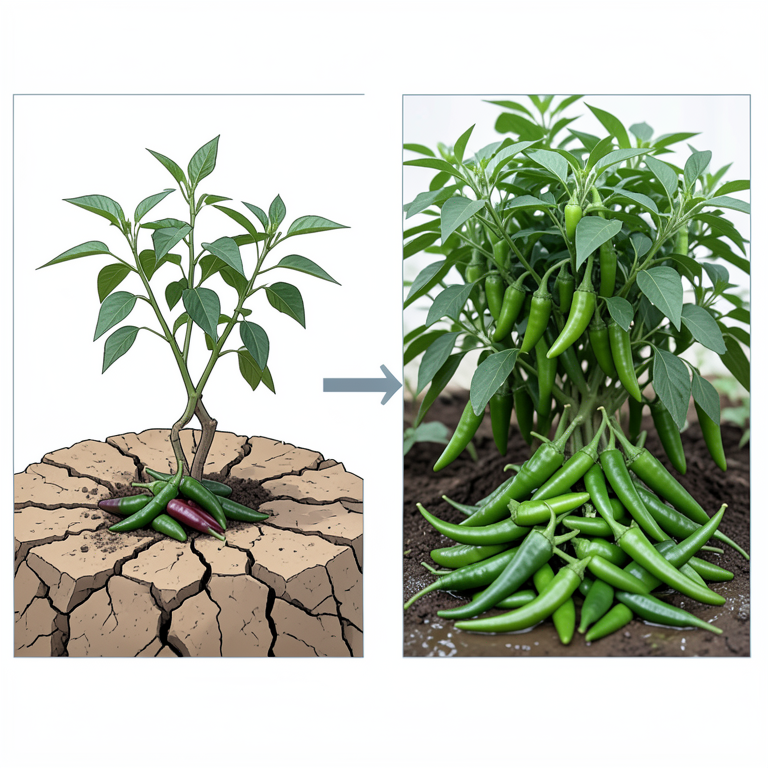
Yield Comparison
AI-generated conceptual illustration (chili pepper plants in a semi-arid field). It explains the idea and does not show study data.
View source evidence ↗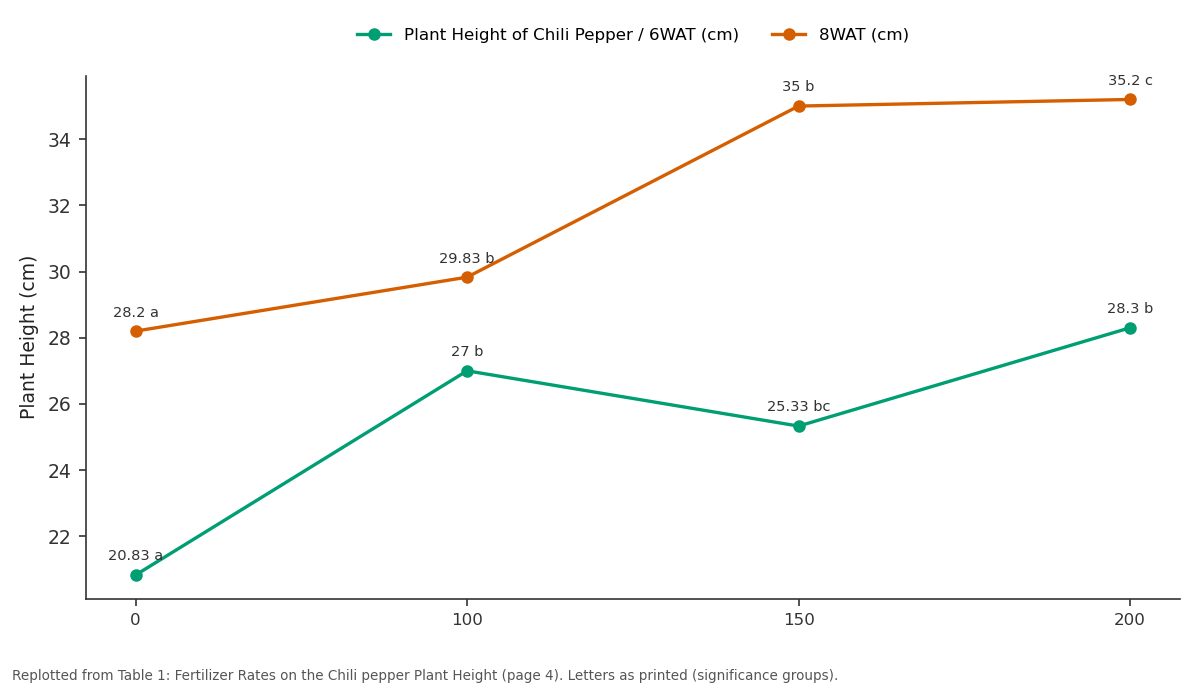
Plant Height of Chili Pepper / 6WAT (cm) and 8WAT (cm): 0 vs 100 vs 150 vs 200
Replotted from Table 1 (page 4) of the original paper. Every bar is the paper's own table value.
View source evidence ↗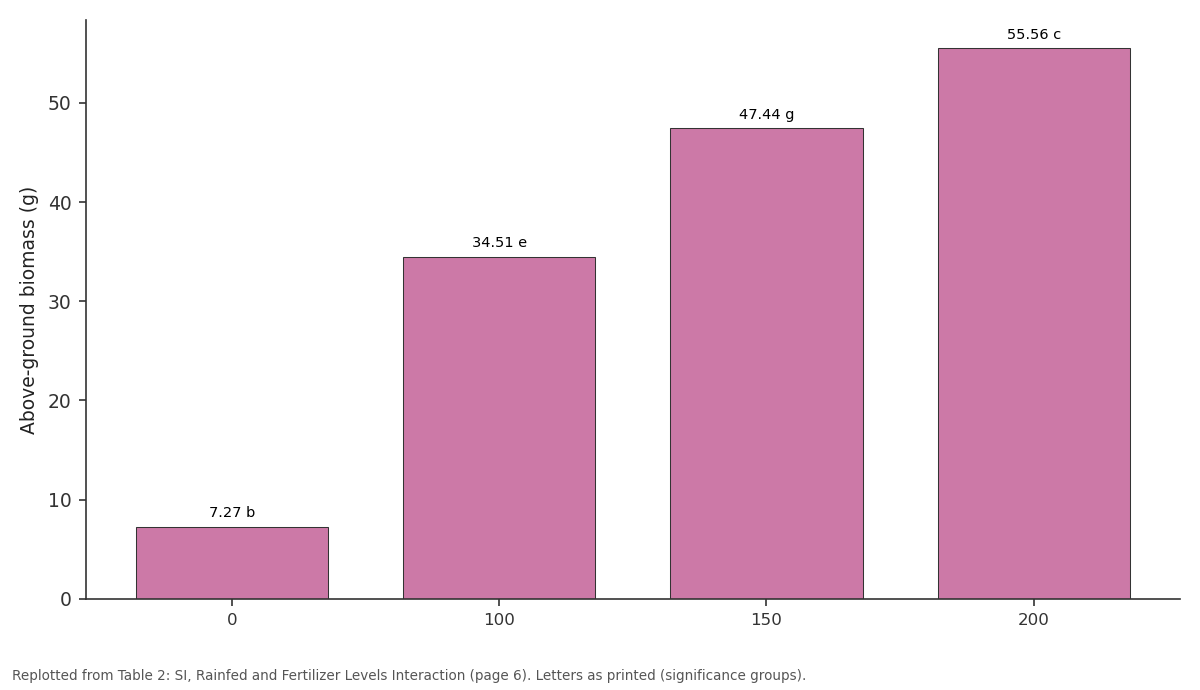
6WAT (g) SI RF: 0 vs 100 vs 150 vs 200
Replotted from Table 2 (page 6) of the original paper. Every bar is the paper's own table value.
View source evidence ↗Figures & tables
From the original paper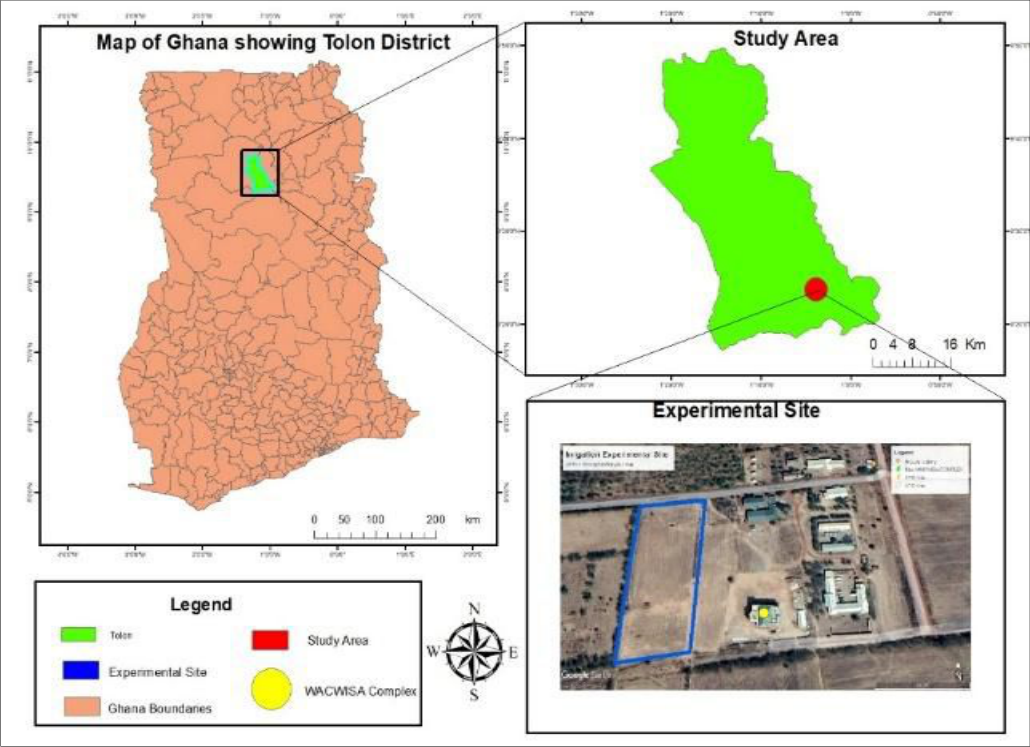 Figure 1
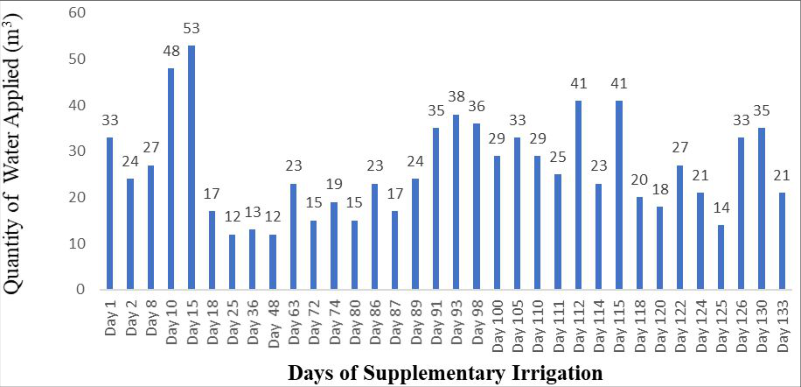 Figure 2
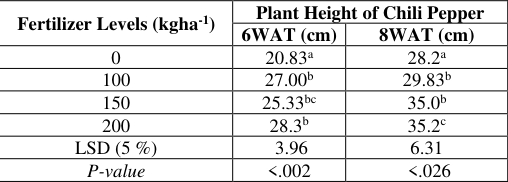 Table 1
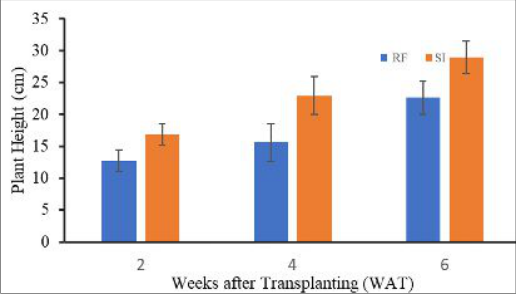 Figure 3
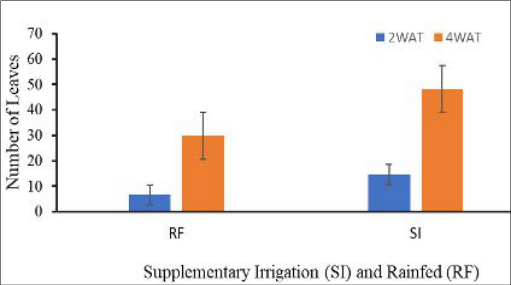 Figure 4
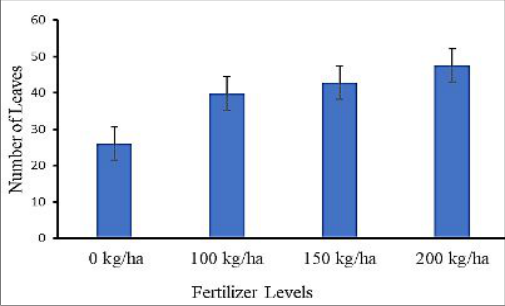 Figure 5
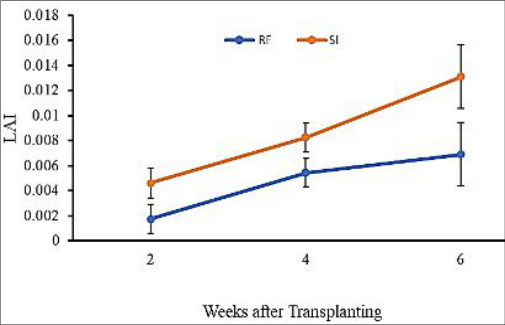 Figure 6
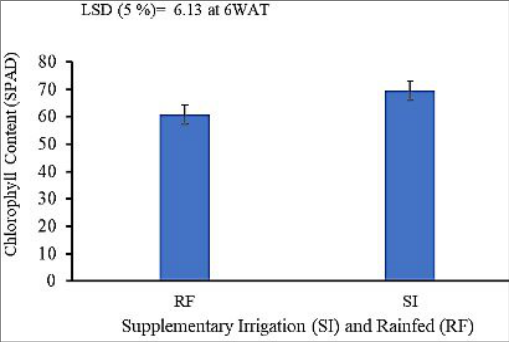 Figure 7
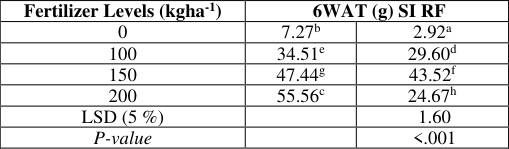 Table 2
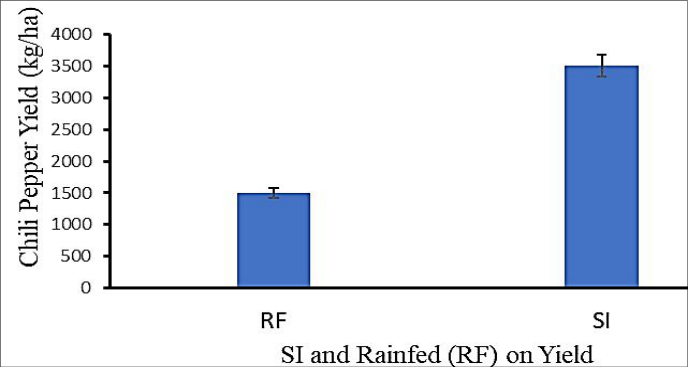 Figure 8
Introduction 1.1 Background
Chili peppers (Capsicum spp.) are among the top 50 food items and one of the world's most important horticultural commodities in terms of exports, according to the Food and Agriculture Organization of the United Nations (FAO). Globally, the use of chili fruits as a condiment or as a fresh dish has been increasing (Saleh et al., 2018) [25] . Its use as an additive in the food and pharmaceutical industries is another factor contributing to this surge (Reddy, 2024) [22] . It is a significant source of bioactive substances like flavonoids, phenolic compounds, vitamins A, E, and C, and capsaicinoids (Villa-Rivera & Ochoa-Alejo, 2020) [32] . These compounds, which are secondary metabolites, are produced in reaction to various stressors (Vargas-Hernandez et al., 2017) [31] . Environmental factors contribute to the loss of water in the soil, which leads to drought stress. Plants experience insufficient water to increase their physiological activity during a drought, which results in senescence and reduced growth (Fahad et al., 2017) [12] . The physiological, morphological, ecological, biochemical, and molecular characteristics of plants are typically altered by drought stress, which is a multifaceted stress (Macias-Bobadilla, 2020) [31] . Due prolonged droughts and irregular, low rainfall patterns have been driven on by global warming which has resulted in minimizing the productivity of crops. Many tropical areas, such as Ghana's Guinea Savannah agro-ecological zone, which has unpredictable unimodal rainfall patterns, are prime examples of these developments. Smallholder farmers in this zone have over time adapted a variety of traditional agricultural systems that are best suited to their environment, which are primarily defined by the scarcity of water resources, owing to indigenous knowledge and adaptations (Adekaldu et al., 2021) [2] . Despite the economic benefits, growing chili peppers is plagued with difficulties that negatively affect output. A study by Adekaldu et al. (2021) [2] revealed that, farmers are only able to achieve 50% of the potential yields, indicating a significant output yield gap. Rain-fed cultivation accounts for around 70% of chili pepper production, and in areas with 600-1250 mm of annual rainfall, yields are typically very high Drought-related crop failure is a typical occurrence in Ghana's Guinea Savannah agro-ecological zone due to the country's changing climate, protracted dry spells, and erratic rainfall patterns. According to Akangaamkum (2023) [3] , supplementary irrigation is an alternative strategy that will lessen water stress conditions and guarantee continuous availability of water (moisture) throughout the growing season. Based on previous research, it is also necessary to find drought mitigation methods to reduce the impact of the drought occurrences on crop production. If applied during the crucial phases of crop growth, supplementary irrigation with a small amount of water will significantly increase productivity and water use efficiency (WUE). SI is known to be an effective strategy for minimizing the negative impact of soil moisture stress on rainfed crop production during dry spells. This paper focuses on assessing how different NPK levels influence chili pepper yield under SI and rainfed systems.
Materials and Methods
Materials and Methods
Study Area
The experiment was done at the West African Center for Water Irrigation and Sustainable Agriculture (WACWISA) Research Field is situated at the University for Development Studies within the Guinea Savannah Agro-Ecological Zone (Figure 1). The study is situated 16 kilometers (10 miles) from Tamale and 167 m above sea level. The area is located between latitudes 9 o 24' N and longitudes 0 o 59' W. Temperatures normally range from 15 oC (lowest) to 42 o C (highest), with an average yearly temperature of 28.5 o C.
Preparation of the Experimental Area
The SI and rainfed fields were set up separately to prevent any interruption between the two treatments. A field size of 10.8 m x 8.3 m was used and demarcated into twelve (12) beds each for SI and rainfed. Each plot measured 5 m x 2.2 m with a 1 m alley between beds and 40 cm between blocks.
A local variety of chili pepper (Shamsi 1) was employed in the experiment. This variety was chosen because it is readily available and can adapt to the local climate. The seeds were nursed for a period of 4 weeks. In order to shield seedlings from direct sunlight and lessen the negative effects of water droplets during watering or rainfall, the nursery bed was covered with thatch mulch. Each bed in the experimental plots contained forty-four (44) healthy and viable seedlings that were transplanted at a rate of one seedling per stand.
Study Design and Treatments
Randomized Complete Block Design (RCBD) was used to set up the 4 x 2 factorial experiment with 3 replications. The treatments were rainfed, supplemental irrigation, and four (4) levels of NPK 15-15-15. A spray tube irrigation system was used for the supplementary irrigation. The application rates of the fertilizer (NPK 15-15-15) were 0 kgha -1 , 100 kgha -1 , 150 kgha -1 , and 200 kgha -1 .
Determination of Soil Physicochemical Properties
Before transplanting, zigzag-shaped soil samples were collected for baseline physicochemical properties determination. The depths in which soil was sampled were; 0-20 cm and 20-40 cm and samples were determined at the laboratory.
Irrigation Scheduling and Water Use
Field capacity (FC) and Permanent wilting point (PWP) were determined prior to the transplanting of the chili pepper seedlings. In order to know when to irrigate and quantity of water to apply, a soil water deficit (D) was computed by determining the soil moisture content after the crop had been given time to use up a portion (p) of the total amount of water available (TAW). Whenever the D was higher than the quantity of water that was readily available, irrigation was apply for the supplementary irrigated plots.
Total Available Water (TAW) in the Soil
This was estimated using equation 1;
TA W = (θFC -θWP)Zr … … … Equation 1TAW -Total available water, Zr -Root zone depth, 𝛳FC-field capacity (%), and 𝛳WP -Permanent wilting point (%).
Readily Available Water (RAW) Estimation
It was estimated using equation 2: 2Where: RAW -Readily available soil water, P -TAW fraction depleted by crop at the root zone and TAW -Total available water.
Irrigation Deficit Estimation
This is the exactly quantity of water required to restore the soil's existing moisture content to field capacity and replenish the crop's root zone. It was calculated as using equation 3. 3Where: D -Soil water deficit, FC -Field capacity, and SWC -Soil water content By comparing the quantity of soil water depleted by the crop (D) to the quantity of soil moisture that is readily available water (RAW), the amount of water required to irrigate the soil back to field capacity was calculated. When the amount of depleted soil water exceeded the readily available soil water, the soil was irrigated back to field capacity.
Data Parameters and Analysis
Agronomic data was collected. 5 plants in each experimental units were properly tagged for data collection. Each experimental unit's five plants were properly identified for data collection, and ANOVA was used to analyze the results. The least significant difference (LSD) at 5% was used to compare means.
Results and Discussion
Results and Discussion
Quantity of Supplementary Irrigation Water Applied during the Cropping Season
According to the study, the least quantity of water was discharged on the day 48 after transplanting (12 m 3 ), while the day 15 recorded the highest of quantity of water applied in the form of supplementary irrigation (53 m 3 ). The amount of water needed for supplemental irrigation can vary greatly based on a number of factors, such as the type of crop, the time of year, the crop's growth stage, the local climate, the type of soil, the amount of accessible moisture, and the irrigation technique.
Physical Properties of Soil
The study's findings reveal that the particle size distribution was 7%, 55%, and 38% for clay, sand, and silt at a depth of 0-20 cm, and 10%, 53%, and 37% for clay, sand, and silt at a depth of 20-40 cm. The results corroborated those of Tetteh et al. (2016), who found that the majority of Northern Ghana's soils had a sandy loam texture and are suitable for cultivating vegetables. At depths of 20-40 cm and 0-20 cm, respectively, the dry bulk density was 1.37-1.68 g/cm3. This is within the 1.55-1.75 g/cm3 range that Yu et al. (2014) [33] reported for sandy loam. While the soil moisture content at the permanent wilting point ranged from 6.4 to 9% at depths of 0 to 20 cm and 20 to 40 cm, respectively, the soil moisture content at field capacity ranged from 19.6 to 24.26% at depths of 0 to 20 cm and 20 to 40 cm, respectively. These results corroborated those of Enoviti (2012) [11] , who reported that soils classified as sandy loam have field capacity and a permanent wilting point within these ranges.
Chemical Properties of Soil
The soil is slightly acidic, with a mean pH of 5.7. According to Tsujimoto et al. (2013) [30] , soils with a pH of 5.7 are classified as slightly acidic. The majority of soil nutrients are made available to crops at a pH range of 5.5 to 6.5, according to earlier research by Motsara (2015) [18] . The EC ranged from 0.84 to 0.89 μS/cm, indicating a non-saline soil.
These results corroborated those of Rhoades et al. (1999), who stated that non-saline soils have EC values between 0 and 2 dS/m. It was found that the potassium (K) was between 39 and 61 mg/kg. This was insufficient for optimum crop development and output, and more fertilizer was needed to increase the K content. This result was consistent with the findings of Akbas et al. (2017), who indicated that soils with K levels between 51 and 140 mg/kg are low and those with K levels below 50 mg/kg are extremely low. Additionally, it was discovered that the phosphorus (P) ranged between 3.32 to 4.71 mg/kg. The recommended range of P needed for crop production was 3.40 to 4.08 mg/kg, according to Ma et al. (2015). The values of total nitrogen (TN) ranged from 0.005 to 0.064. According to Tadese(1991) findings, soil total nitrogen availability of less than 0.05% is considered very low, 0.05-0.12% is considered low, 0.12-0.25% is considered moderate, and more than 0.25% is considered high total nitrogen. The low total organic carbon (TOC) ranged between 0.467 and 0.741 percent. According to Tadese (1991), soils with TOC between 0.5 and 1.5% are regarded as low. For TOC restoration, fertilizer must be applied continuously. The amount of organic matter (OM) was 0.81-1.28%, which is equally extremely low. This finding is consistent with Biernbaum's (2012) confirmation that the OM in mineral soils (sand, loam, and clay) is low, ranging from 0% to 2%.
Plant Height
The main effects of rainfed and SI at 2WAT considerably improved the height of the chili pepper plants (p<0.005). The rainfed system recorded the lowest plant height (12.71 cm), while SI recorded the maximum plant height (16.84 cm). At 4 and 6 WAT, a comparable pattern was noted (Figure 3).
The constant soil moisture availability during the crops' vegetative stage due to SI may be the cause of this plant variance. This result corroborated that of Origa (2011), who noted a similar pattern in onions and stated that SI plots had greater access to soil moisture, which promotes vegetable vegetative growth. The findings are consistent with those of Álvarez et al. (2009), who found that tomato plant height and leaf area development were decreased when water stress occurred during the vegetative phases.
Fertilizer Levels on Plant Height
Fertilizer rates at 6WAT (p<0.002) and 8WAT (p<0.026) of chili pepper showed a significant difference. At 6WAT, the maximum mean plant height (29.83 cm) was recorded at the fertilizer level of 200 kgha -1 , the second greatest plant height (27.0 cm) was obtained at 100 kgha -1 , and the lowest plant height (20.8 cm) was reported at 0 kgha -1 . Plant height at 8WAT was highest at 200 kgha -1 (35.2 cm), second at 150 kgha -1 (35.0 cm), and lowest at 0 kgha -1 (28.2 cm) (Table 1). In comparison to crops that received less or no fertilizer, the fertilizer effect on chili peppers may be explained by increased availability and NPK uptake, which gradually raised plant height. These results were consistent with those of Fawole et al. (2022) [13] , who found that higher amounts of NPK affect higher plant height in sweet pepper because of the higher quantities of essential nutrients (potassium, phosphorus, and nitrogen). This was consistent with the results of Kanneh et al. (2017) [16] , who found that sweet peppers treated with NPK 15-15-15 at a greater rate produced taller plants, whereas those treated with less NPK had the lowest plant height.
| Fertilizer Levels (kgha-1) | Plant Height of Chili Pepper | — |
|---|---|---|
| 6WAT (cm) | 8WAT (cm) | |
| 0 | 20.83a | 28.2a |
| 100 | 27.00b | 29.83b |
| 150 | 25.33bc | 35.0b |
| 200 | 28.3b | 35.2c |
| LSD (5 %) | 3.96 | 6.31 |
| P-value | <.002 | <.026 |
Table text extracted from the original PDF; superscript letters are shown inline. The original table image is below.
View original table image
Number of Leaves
The use of SI and the rainfed system at 2WAT had a substantial impact on the quantity of chili pepper leaves (p<0.001). SI found that the rainfed zone had the lowest mean (6.67 cm) and the highest (14.58 cm). A similar pattern was seen at 4WAT (P<0.002) (Figure 4). The observed fluctuation in chili pepper may be explained by the fact that rainfed crops encountered water stress during times of low or no rainfall, while supplementary irrigated crops received supplementary irrigation to support crop growth and development. These findings support the claim made by Pérez-Pérez et al. (2009) [21] that plants naturally shrink and/or shed leaves during periods of water stress, resulting in a low leaf count. As a result, the rainfed treatment had less leaves than the SI treatment. According to Origa (2011), the variation could be caused by SI's stimulatory effects on branching in comparison to the control, which resulted in the development of more leaves.
Fertilizer Levels on Number of Leaves
Fertilizer levels had a significant impact on the number of chili pepper leaves at 4WAT (p<0.035), according to the results of the effect of fertilizer levels on leaf count. This result showed the least number of leaves at 0 kgha -1 (26.0) (Figure 5). This fluctuation happened because there was more nitrogen available in 200 kgha -1 than in 0 kgha -1 , which is what causes crops to grow vegetatively. Hewitt and Smith (1974), who carried out a similar experiment, concluded that the increase in vegetative development is due to the availability of higher N because an increased N supply results in more cells and more carbohydrates, which are utilized to generate protoplasm. Compared to plants that received more N, Ndeficient plants have fewer leaves due to decreased cell division and growth.
Leaf Area Index (LAI)
Rainfed and SI resulted in a significant increase in LAI at 2WAT (p<0.001), 4WAT (p<0.001) and 6WAT (p<0.031) of chili pepper. In all the weeks, the plots treated with SI showed the highest means and those under rainfed gave the lowest means (Figure 6). According to Romaisa et al. (2015), the variation in LAI may be explained by the crop retaining more moisture in the soil as it receives water, which may have an impact on plant metabolism and lead to increased plant growth, leaf area, LAI characteristics, and dry matter production. In rainfed crops, water stress can lower leaf area and leaf area index. Inadequate water availability during plant growth significantly decreases crop growth rate and reduces leaf area and LAI. This is consistent with the findings of Cicchino et al. (2010) [1] , who found that drought stress in plants reduced pollen viability and pollination duration, delayed blooming, decreased plant height, decreased LAI and leaf area, and decreased seed and biological yields.
Chlorophyll Content
Both SI and rainfed had a substantial (p < 0.009) impact on the chlorophyll content at 6WAT. The SI treatment had the highest chlorophyll content (SPAD) (69.50 Spad), whereas the rainfed plots had the lowest SPAD (60.9 Spad) (Figure 7). The rainfed treatment's low chlorophyll content and SI's higher chlorophyll content are consistent with the findings of Amin et al. (2009) [7] , who found that okro and watermelon leaf chlorophyll content decreased during drought conditions while supplemental irrigated plots had higher chlorophyll content. The results support the claim made by Al-Juthery et al. (2022) [5] that a higher nitrogen concentration causes the SPAD meter value of chlorophyll to increase from low to high.
Treatments Interaction Effects on Above Ground Biomass
The combination of rainfed, spray tube SI, and fertilizer at a rate of 6WAT considerably (P < 0.001) boosted the interaction impact in aboveground biomass of chili peppers. The highest above-ground biomass (55.56 g) was induced by SI with NPK at a rate of 200 kgha -1 , while rainfed + control (RF + 0 kgha -1 ) produced the lowest above-ground biomass (2.29 g) (Table 2). In lentil BM, Kahraman et al. (2016) [15] found that supplemental irrigated plots produced higher BM than those that relied solely on rainfed. According to Silim and Saxena (1993), the improvement in plant water potential at the crucial period was the reason for the rise in BM output using SI. The presence of greater NPK, which encourages the vegetative growth of chili peppers, may also be responsible for the higher BM. This supports the findings of Okonwu and Mensah (2012) [19] , who found that applying NPK at greater doses consistently increased the pumpkin's fresh and dry weight as well as stem diameter.
| Fertilizer Levels (kgha-1) | 6WAT (g) SI RF | — |
|---|---|---|
| 0 | 7.27b | 2.92a |
| 100 | 34.51e | 29.60d |
| 150 | 47.44g | 43.52f |
| 200 | 55.56c | 24.67h |
| LSD (5 %) | 1.60 | |
| P-value | <.001 |
Table text extracted from the original PDF; superscript letters are shown inline. The original table image is below.
View original table image
Chili Pepper Yield
The production of chili peppers was significantly influenced (p<0.006) by SI and rainfed. Plots treated with rainfed had the lowest overall yield of 1.50 tons/ha (32.3% of the whole yield), whereas plots under the SI had the highest total yield of 3.51 tons/ha representing 67.7% of the total yield (Figure 9). Comparatively, the addition of SI has resulted in an additional yield increase of 2.01 tons/ha. This shows that, an additional yield of 2.01 ton/ha will be achieved when rainfed chili pepper are been supplemented with irrigation (Figure 8). According to the International Center for Agricultural Research in the Dry Areas (ICARDA) and farmer harvest who produced chili peppers under SI and rainfed, SI outperformed rainfed in terms of yield, which is consistent with the application of SI resulting in notable increases in rainfed chili pepper yields.This conclusion also supports the findings of Adary et al. (2002) [1] , who noted that employing SI when combined with appropriate production inputs and system management can significantly boost yield and water productivity. The lack of moisture in the soil during the crucial stage of the crop is the catalyst for the reduced yield in the rainfed treatment. According to Techawongstien et al. (1992) [21] , chili pepper plants under water stress had fewer fruits per plant, as well as less weight fruits than plants with optimal water levels.
Conclusion and Recommendations 4.1 Conclusion and Recommendations
The combination of SI and rainfed chili peppers had a substantial impact on the assessed growth parameters and production. SI outperformed the rainfed plots in all growth parameters and yield. Fertilizer levels had a substantial impact on plant height, number of leaves, chlorophyll content, and above-ground biomass in chili peppers, but had no effect on yield. In chili peppers, the rainfed plots produced 1,502.20 kg/ha (1.50 t/ha), while the SI treatment produced a maximum yield of 3,506.70 kg/ha (3.51 t/ha). The higher production cost had been compensated by the yield on SI. For maximum chili pepper, a SI spray tube irrigation system and 200 kg/ha of fertilizer application are recommended. In terms of yield and growth characteristics, SI has done the best. Since the current rainfed production system would almost surely cause farmers to suffer financial losses, it would be preferable to encourage farmers to invest in additional irrigation as a strategy to hedge against losses.
Initiatives must be implemented to make farmers more inclined to take steps in their own best interests to promote adoption.
Acknowledgement
AcknowledgementsThe authors thank the West African Center for Water, Irrigation and Sustainable Agriculture (WACWISA) under International Journal of Agriculture and Food Science https://www.agriculturaljournals.com the School of Engineering, University for Development Studies for the support.
Figures and tables from the paper
References
33 in the original paper- Adary A, Hachum A, Oweis T, Pala M. Wheat productivity under supplemental irrigation in Northern Iraq. On-Farm Water Husbandry Research Report Series No. 2. Aleppo (Syria): ICARDA; 2002.
- Adekaldu E, Amponsah W, Tuffour HO, Adu MO, Agyare WA. Response of chilli pepper to different irrigation schedules and mulching technologies in semiarid environments. J Agric Food Res. 2021;6:100222.
- Akangaamkum AT. Effect of supplementary irrigation and fertilizer levels on growth and yield of chili pepper (Capsicum annuum L.) and okro (Abelmoschus esculentus L.) in Northern Region of Ghana [doctoral dissertation]. 2023.
- Akbas F, Gunal H, Acir N. Spatial variability of soil potassium and its relationship to land use and parent material. 2017.
- Al-Juthery HWA, Yousif SA-A, Lahmod NR, Alhasan AS, Tiamooz SH, Musa RF. Response of wheat to spray of some synthetic nano fertilizers. IOP Conf Ser Earth Environ Sci. 2022;1060(1):012030.
- Álvarez S, Navarro A, Bañón S, Sánchez-Blanco MJ. Regulated deficit irrigation in potted Dianthus plants: effects of severe and moderate water stress on growth and physiological responses. Sci Hortic. 2009;122(4):579-585.
- Amin B, Mahleghah G, Mahmood HMR, Hossein M. Evaluation of drought stress interaction with ascorbate and salicylic acid on physiological and biochemical parameters in okra (Hibiscus esculentus L.). Res J Biol Sci. 2009;4(4):380-387.
- Armah M. Investment opportunity in Ghana: chili pepper. Accra (Ghana): Millennium Development Authority; 2010.
- Biernbaum J. Organic matters: feeding the soil and building soil quality. Michigan: Dept. Horticulture, Michigan State University; 2012.
- Cicchino M, Edreira JIR, Uribelarrea M, Otegui ME. Heat stress in field-grown maize: response of physiological determinants of grain yield. Crop Sci. 2010;50(4):1438-1448.
- Enoviti. Soil texture and water holding capacity-Part 1. 2012.
- Fahad S, Bajwa AA, Nazir U, Anjum SA, Farooq A, Zohaib A, et al. Crop production under drought and heat stress: plant responses and management options. Front Plant Sci. 2017;8:1147.
- Fawole TO, Popoola OJ, Oladapo OS, Oyaniyi TO, Omilabu SK, Godspower OO, Awodutire OO. Growth and yield response of sweet pepper (Capsicum annuum L.) to Moringa oleifera leaf extract and NPK 15-15-15 fertilizer. Renewable. 2022;2(1):45-50.
- Hewitt EJ, Smith TA. Plant mineral nutrition. London: English Universities Press; 1974.
- Kahraman A, Khan MK, Pandey A, Dogan E. Effect of supplemental irrigation on lentil yield and growth in semi-arid environment. Not Bot Horti Agrobo. 2016;44(1):237-244.
- Kanneh SM, Musa PD, Osei MK, Quee DD, Akromah R, Lahai M. Response of different NPK fertilizer rates on growth and yield of two local varieties of pepper (Capsicum annuum L.) in Sierra Leone. ARPN J Agric Biol Sci. 2017;12(4):123-127.
- Ma S, Yu Z, Shi Y, Gao Z, Luo L, Chu P, Guo Z. Soil water use, grain yield and water-use efficiency of winter wheat in long-term tillage and supplemental irrigation systems in North China Plain. Agric Water Manag. 2015;150:9-17.
- Motsara MR. Guide to laboratory establishment for plant nutrient analysis. Scientific Publishers; 2015.
- Okonwu K, Mensah SI. Effects of NPK (15-15-15) fertilizer on growth indices of pumpkin. Asian J Agric Res. 2012;6(3):137-143.
- Origa LO. Effect of supplemental irrigation on growth, yield and economic returns of onion (Allium cepa) and tomato (Solanum lycopersicum) in Eastern Kenya [master's thesis]. Nairobi: University of Nairobi; 2011.
- Pérez-Pérez JG, Robles JM, Tovar JC, Botía P. Response to drought and salt stress of lemon 'Fino 49' under field conditions: water relations, osmotic adjustment and gas exchange. Sci Hortic. 2009;122(1):83-90.
- Reddy DN, Mylabathula MM, Al-Rajab AJ. Industrial demand and applications of capsaicin. In: Capsaicinoids: From natural sources to biosynthesis and clinical applications. Singapore: Springer; 2024. p. 249291.
- Rhoades JD, Chanduvi F, Lesch SM. Soil salinity assessment: methods and interpretation of electrical conductivity measurements. Rome: FAO; 1999. (FAO Irrigation and Drainage Paper No. 57.)
- Romaisa A, Khalid H, Ujala M, Khalid N, Naima M, Siddiqi EH. Effect of drought levels on growth and pigments of lady finger (Abelmoschus esculentus). World J Agric Sci. 2015;11(4):198-201.
- Saleh BK, Omer A, Teweldemedhin BJM. Medicinal uses and health benefits of chili pepper (Capsicum spp.): a review. MOJ Food Process Technol. 2018;6(4):325-328.
- Silim SN, Saxena MC. Adaptation of spring-sown chickpea to the Mediterranean basin. II. Factors influencing yield under drought. Field Crops Res. 1993;34(2):137-146.
- Tadese T. Soil, plant, water, fertilizer, animal manure and compost analysis. Working Document No. 13. Addis Ababa: ILCA; 1991.
- Techawongstien S, Nawata E, Shigenaga S. Responses of chili pepper cultivars to transient water stress. J Jpn Soc Hortic Sci. 1992;61(1):85-92.
- Tetteh F, Larbi A, Nketia KA, Senayah JK, HoeschleZeledon I, Abdulrahman N. Suitability of soils for cereal cropping in Northern Ghana. 2016.
- Tsujimoto Y, Yamamoto Y, Hayashi K, Zakaria AI, Inusah Y, Hatta T, et al. Soil total carbon distribution and sulfur deficiency in floodplain rice fields of Northern Ghana. Field Crops Res. 2013;152:74-82.
- Vargas-Hernandez M, Macias-Bobadilla I, GuevaraGonzalez RG, Romero-Gomez SDJ, Rico-Garcia E, Ocampo-Velazquez RV, et al. Plant hormesis management with biostimulants of biotic origin in agriculture. Front Plant Sci. 2017;8:1762.
- Villa-Rivera MG, Ochoa-Alejo N. Chili pepper carotenoids: nutraceutical properties and mechanisms of action. Molecules. 2020;25(23):5573.
- Yu H, Yang P, Lin H, Ren S, He X. Sodic soil reclamation using flue gas desulphurization gypsum: effects on soil pore characteristics, bulk density, and hydraulic conductivity. Soil Sci Soc Am J. 2014;78(4):1201-1213.