
Research article · 2025 · Full text
International Journal of Agriculture and Food ScienceInfluence of Different Levels of NPK and Biochar on Soil Properties, Growth and Yield of Black Gram (Vigna mungo L.) var. Shekhar-2
Volume 7(11) · Pages 378–381 · DOI: 10.33545/2664844x.2025.v7.i11e.980 ↗
Research areasAgricultural Science and FertilizationPlant Growth Enhancement TechniquesClay minerals and soil interactions
Abstract
Author-writtenAn experiment entitled “Influence of Different Levels of NPK and Biochar on Soil Properties, Growth and Yield of Black Gram (Vigna mungo L.) var. Shekhar-2” was carried out during the Zaid season of 2023-2024 at the Research Farm, Department of Soil Science and Agricultural Chemistry, Naini Agricultural Institute, SHUATS, Prayagraj. The experiment was laid out in 3 × 3 randomized block design, consisting of three levels of NPK (0, 50 and 100% RDF) and three levels of biochar (0, 50 and 100%). Among all treatments, T₉ (100% NPK + 100% biochar) recorded the most favourable results. This treatment showed the highest improvements in bulk density, particle density, pore space, water-holding capacity, organic carbon and available nitrogen, phosphorus and potassium at both 0-15 cm and 15-30 cm soil depths. In terms of crop growth, T₉ produced the maximum plant height (41.05 cm, 49.13 cm and 60.05 cm at 30 DAS, 60 DAS and harvest, respectively), number of leaves plant-1 (18, 30 and 32 at 30 DAS, 60 DAS and harvest), number of pods plant-1 (38.72), number of seeds pod-1 (10.5), test weight (54.60 g per 1000 seeds) and grain yield (12.40 q ha⁻¹).Economic evaluation also indicated that T₉ was superior with a cultivation cost of ₹52,200 ha⁻¹, gross return of ₹1,20,280 ha⁻¹, net profit of ₹68,080 ha⁻¹ and a benefit: cost ratio of 1:2.30. It revealed that combined application of NPK and biochar significantly improved nutrient availability and soil quality.
Summary
Source-checkedPlain-language reading of the full paper, prepared with AI and checked against the text. Each point links to the authors' own words.
Why it matters
- Black gram is a nutritionally dense legume essential to South Asian diets, providing significant amounts of protein, carbohydrates, and minerals like phosphorus, calcium, and iron. View evidence ↗
- Biochar, a carbon-rich material created via pyrolysis, is used as a soil amendment to enhance crop productivity and overall soil quality. View evidence ↗
The question
- The study aimed to evaluate how the combined application of NPK fertilizers and biochar affects the physico-chemical properties of soil and the performance of black gram crops. View evidence ↗
What they did
- The research used a Randomized Block Design with 27 plots, testing nine combinations of three NPK levels (0, 50, and 100% RDF) and three biochar levels (0, 50, and 100%). View evidence ↗
- The study was conducted during the 2023-24 Zaid season in Prayagraj, Uttar Pradesh, using the Shekhar-2 variety of black gram sown at 30 × 10 cm spacing with a seed rate of 15 kg ha⁻¹. View evidence ↗
- Growth and yield were measured by tracking plant height (at 30, 60 days after sowing, and harvest), counting leaves and pods per plant, counting seeds per pod from ten random pods, and weighing 1,000 seeds for test weight. View evidence ↗
What they found
- The combination of 100% NPK and 100% biochar (T9) resulted in the highest improvements in soil physical and chemical properties, including bulk density, organic carbon, and available NPK, at both 0-15 cm and 15-30 cm depths. View evidence ↗
- T9 achieved the maximum number of leaves per plant (18 at 30 DAS, 30 at 60 DAS, and 32 at harvest), outperforming T8 and the control T1. View evidence ↗
- The highest number of pods per plant was found in T9 (38.72), compared to T8 (33.10) and the minimum in T1 (12.25). View evidence ↗
- T9 produced the most seeds per pod (10.50), followed by T8 (10.00), while T1 had the fewest (7.51). View evidence ↗
- The maximum seed yield was recorded for T9 at 12.4 q ha⁻¹, which was higher than T8 (11.6 q ha⁻¹) and the control T1 (7.90 q ha⁻¹). View evidence ↗
- T9 was the most economically viable treatment, yielding a net profit of ₹68,080 ha⁻¹ and a benefit-cost ratio of 1:2.30. View evidence ↗
What it means
- The authors conclude that applying 100% NPK and 100% biochar (T9) optimizes soil properties, yield, and profit, and recommend this practice to farmers for sustainable agriculture and higher income. View evidence ↗
Visual summary
2 visualsIllustrations explain the paper; charts are replotted from the paper's own table values.
Experimental Treatment Matrix
AI-generated conceptual illustration (black gram plants (Vigna mungo L.) in soil). It explains the idea and does not show study data.
View source evidence ↗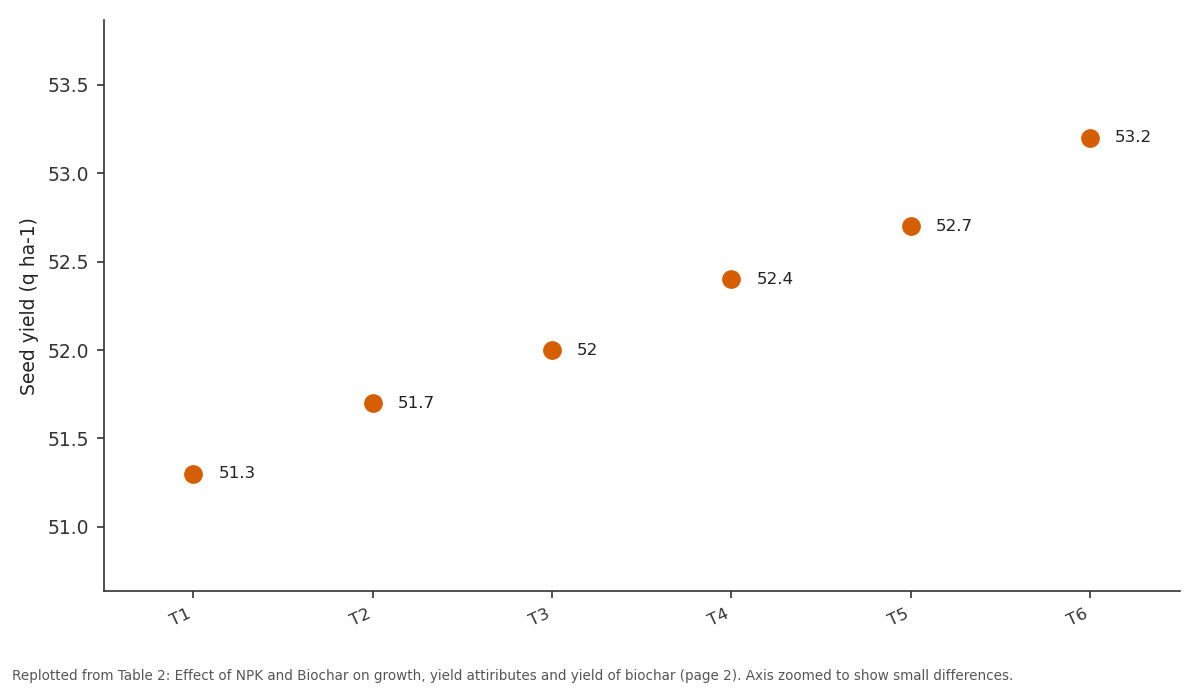
Test weight (g): T1 vs T2 vs T3 vs T4 vs T5
Replotted from Table 2 (page 2) of the original paper. Every bar is the paper's own table value.
View source evidence ↗Figures & tables
From the original paper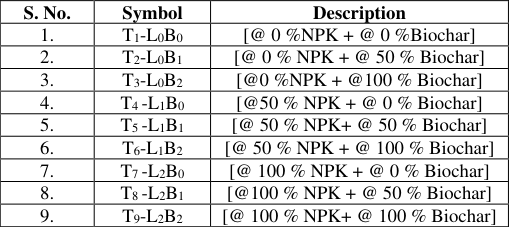 Table 1
 Table 2
Introduction
Black gram (Vigna mungo (L.) Hepper; 2n = 22) is a highly nutritious grain legume crop cultivated across South and Southeast Asia (Kaewwongwal et al., 2015) [13] . Black gram is commenly known as urad dal (Choudhary et al., 2017) [6] . Black gram plays a vital role in South Asian vegetarian diets due to its rich nutritional composition. Its mature dry seeds contain about 24-26% protein, 60% carbohydrates, 1.3% fat and are good sources of minerals such as phosphorus (345 mg/100 g), calcium (185 mg/100 g) and iron (8.7 mg/100 g), along with essential amino acids and vitamins including niacin, thiamine, riboflavin and vitamin A (Nair et al., 2024) [18] . It is commonly consumed as whole or split grains (dal) and in both fermented and unfermented flour forms (Khan et al., 2021) [14] . Beyond its nutritional importance, black gram contributes to sustainable agriculture due to its ability to fix atmospheric nitrogen, thereby improving soil fertility and reducing dependence on synthetic fertilizers (Bhadu et al., 2018) [3] . India is largest producer of black Gram in the world by contributing nearly 70% of the global production, followed by Myanmar and Pakistan. India produces about 2.7 million tonnes from an approximately 4.4 m ha area with an average yield of 598 kg ha -1 (Directorate of Economics and Statistics, 2021). However, the black gram productivity is considerably low and affected by several agronomic and environmental factors, among which soil fertility and nutrient management most critical. Biochar has gained considerable attention as a soil amendment due to its ability to improve soil quality and enhance crop productivity. It is a carbon rich material produced from the thermal decomposition of organic biomass through pyrolysis (a process carried out under limited or no oxygen). Its high porosity, large surface area and strong nutrient and waterretention capacity make it particularly valuable for nutrient-deficient soils (Adekiya et al., 2025) [1] . It also provides a favorable habitat for soil microorganisms. It contributes to longterm carbon sequestration and reduces greenhouse gas emissions. Biochar is applied to soil at specific rates depending on soil type and crop needs, especially in soils with low organic matter (Kumar et al., 2020) [20] . Nutrient balance is the key component to increase crop yields. Macronutrients, nitrogen (N), phosphorus (P) and potassium (K) are essential for the growth and development of all crops. Among them, nitrogen is often the most limiting nutrient for crop yield. In plants, most nitrogen is found in organic compounds such as nucleic acids, vitamins, hormones, membrane components, coenzymes and pigments. Phosphorus plays a critical role in energy transfer through ATP and other nucleoproteins and it is an integral part of genetic material and cell membranes. Potassium acts as an activator or cofactor for many enzymes, helps maintain osmotic balance and supports efficient water uptake (Meena et al., 2023) [17] . Excess and imbalanced use of nutrients has caused nutrient mining from the soil, deteriorated crop productivity and ultimately soil health.
The dose of fertilizer depends on the initial soil fertility status and moisture availability conditions. Keeping this in view an experiment was conducted during the Zaid season of 2023-2024 to evaluate the combined effects of NPK fertilization and biochar application on soil physicochemical properties and crop performance.
Materials and Methods
The Plant height was recorded at 30, 60 DAS and at harvest by selecting and tagging five plants plot -1 measuring from the ground level to the base of the last fully opened leaf on the main shoot. The number of branches plant -1 and pods plant⁻¹ was also recorded from the same tagged plants. Similarly, ten pods were randomly collected from the tagged plants to determine the number of seeds pod⁻¹ by counting and averaging the total seeds. Test weight was determined by weighing 1000 randomly selected healthy seeds from each plot. Seed yield was recorded from threshed produce obtained from each net plot and expressed in kg ha⁻¹. Yield data were converted using the formula: Seed yield (kg ha⁻¹) = [Yield from net plot (kg) / Area of net plot (m²)] × 10,000. T1-L0B0 [@ 0 %NPK + @ 0 %Biochar] 2.
T2-L0B1 [@ 0 % NPK + @ 50 % Biochar] 3.
T3-L0B2 [@0 %NPK + @100 % Biochar] 4.
T4 -L1B0 [@50 % NPK + @ 0 % Biochar] 5.
T5 -L1B1 [@ 50 % NPK+ @ 50 % Biochar] 6.
T6-L1B2 [@ 50 % NPK + @ 100 % Biochar] 7.
T7 -L2B0 [@ 100 % NPK + @ 0 % Biochar] 8.
T8 -L2B1 [@100 % NPK + @ 50 % Biochar] 9.
T9-L2B2 [@ 100 % NPK+ @ 100 % Biochar] Recommended dose of fertilizer@20:40:20 kg ha -1 and Biochar@10 ton ha -1
Results and Discussion
Results and Discussion
Effect of different levels of NPK and biochar on soil properties
The application of higher NPK and biochar levels improved the physical and chemical properties of the soil. Maximum bulk density, particle density, pore space, water-holding capacity, organic carbon and available nitrogen, phosphorus and potassium at both 0-15 cm and 15-30 cm soil depths were observed in T₉ (100% NPK + 100% biochar). Similar [11, 4, 7, 5, 9, 19] . This improvement occurs because biochar has porous structure and high surface area that enhance soil aggregation, porosity, moisture retention and provides surfaces for nutrient adsorption and slow release. In addition, a balanced supply of NPK fertilizers encourages microbial activity, root proliferation and organic matter accumulation that further enrich soil structure and nutrient availability. Combination of both contributes better aeration, increase cation exchange capacity and higher nutrient mobilization in soil profile.
Effect of different levels of NPK and biochar on growth and yield of black gram
A critical examination of the data (tables 2) revealed that the application of NPK and biochar significantly influenced the growth and yield performance of black gram. Plant height measured at 30 DAS, 60 DAS and at harvest showed a clear increasing trend with higher nutrient inputs. The maximum height (41.05 cm, 49.13 cm and 60.05 cm) was recorded under T₉ (100% NPK + 100% biochar), followed closely by T₈, while the minimum was obtained in the untreated control (T₁). The superior plant growth under T₉ may be attributed to an improved and balanced nutrient supply that supports vigorous vegetative growth through enhanced cell division, elongation and photosynthetic activity. Similar observations have been reported by Koushal and Singh (2011) and Jat et al. (2012) [15,10] . The number of leaves plant -1 also exhibited significant variation across the treatments at all growth stages. T₉ produced the highest number of leaves 18, 30 and 32 at 30 DAS, 60 DAS and harvest, respectively, followed by T₈ whereas the lowest leaf count was recorded in T₁. The increase in leaf number under higher nutrient levels may be due to improved nutrient uptake and chlorophyll formation, which enhance the interception of photosynthetically active radiation (PAR) and promote canopy development. These findings are similar with research of Koushal and Singh (2011) [15] . The number of pods plant -1 was significantly influenced highest value (38.72) recorded under T₉ followed by T₈ (33.10) while the minimum was observed in T₁ (12.25). This marked improvement in pod formation under higher nutrient regimes may be attributed to better flower initiation, reduced flower drop and enhanced nutrient translocation to reproductive organs. Similar results were documented by Sivakumar et al. (2013) and Deshmukh et al. (2014) [20,8] . The number of seeds pod -1 significantly highest under T 9 (10.50) followed by T₈ (10.00) while the lowest was noted in T₁ ( [22,12,21] . Although the test weight of 1000 seeds was statistically non-significant amog all treatment. Seed yield was significantly influenced by the application of NPK and biochar. The highest yield (12.4 q ha⁻¹) was obtained in T₉ followed by T₈ (11.6 q ha⁻¹) while the lowest yield was recorded in the control (7.90 q ha⁻¹). The substantial increase in yield under T₉ can be attributed to improved vegetative growth, increased pod formation, higher seed count pod -1 and better nutrient-use efficiency. The synergistic effect of biochar which enhances soil structure, moisture retention and nutrient-holding capacity along with balanced NPK nutrition, provided a favorable environment for the overall growth and productivity of black gram. These findings corroborate the results of Koushal and Singh (2011) and Sivakumar et al. (2013) [15,20] . The economic viability of various treatments reveals that treatment T₉ recorded the highest net profit and B: C ratio of 1:2.30. In contrast, the lowest net profit and B: C ratio was observed in the T₁ treatment. This result clearly shows that the integrated application of recommended NPK along with biochar significantly enhances economic returns.
Conclusion
The study concluded that the various level of NPK and Biochar used from different sources fertilizers i.e. Urea (46 % N), SSP (16 % P 2 O 5 ), MOP (60 % K 2 O) and Biochar in the experiment gave the best result in the treatment T 9 (NPK @ 100 % + Biochar @ 100 %) followed by T 8 treatment.
The soil properties, yield attributes and yield of black gram, highest net profit and cost benefit ratio is 1:2.30 were obtained under T 9 (NPK @ 100 % + Biochar @ 100 %). Therefore, it can be recommended for farmers to ensure higher farm income and sustainable agriculture.
Acknowledgement
AcknowledgementsThe authors express their sincere gratitude to Department of Soil Science and Agricultural Chemistry, Naini Agricultural Institute, SHUATS, Prayagraj, for providing the necessary facilities, continuous support and valuable encouragement throughout the course of this research work.
Figures and tables from the paper
| S. No. | Symbol | Description |
|---|---|---|
| 1. | T1-L0B0 | [@ 0 %NPK + @ 0 %Biochar] |
| 2. | T2-L0B1 | [@ 0 % NPK + @ 50 % Biochar] |
| 3. | T3-L0B2 | [@0 %NPK + @100 % Biochar] |
| 4. | T4 -L1B0 | [@50 % NPK + @ 0 % Biochar] |
| 5. | T5 -L1B1 | [@ 50 % NPK+ @ 50 % Biochar] |
| 6. | T6-L1B2 | [@ 50 % NPK + @ 100 % Biochar] |
| 7. | T7 -L2B0 | [@ 100 % NPK + @ 0 % Biochar] |
| 8. | T8 -L2B1 | [@100 % NPK + @ 50 % Biochar] |
| 9. | T9-L2B2 | [@ 100 % NPK+ @ 100 % Biochar] |
Table text extracted from the original PDF; superscript letters are shown inline. The original table image is below.
View original table image
| Treatment | Plant Height (cm) | — | — | Number of Leaves Plant-1 | — | — | Number of pods plant- 1 | Number of seeds pod-1 | Test weight (g) | Seed yield (q ha-1) | B: C ratio |
|---|---|---|---|---|---|---|---|---|---|---|---|
| 30 DAS | 60 DAS | At harvest | 30 DAS | 60 DAS | At harvest | ||||||
| T1 | 35.40 | 42.59 | 51.30 | 11 | 24 | 26 | 12.25 | 7.51 | 51.3 | 7.9 | 1: 1.81 |
| T2 | 35.55 | 43.05 | 53.06 | 12 | 25 | 27 | 13.05 | 7.75 | 51.7 | 9.1 | 1: 1.97 |
| T3 | 36.01 | 43.08 | 54.05 | 13 | 25 | 27 | 16.6 | 7.97 | 52.0 | 9.63 | 1: 1.97 |
| T4 | 36.12 | 44.35 | 56.05 | 13 | 25 | 28 | 19.1 | 8.4 | 52.4 | 9.78 | 1: 2.11 |
| T5 | 37.21 | 45.01 | 56.12 | 14 | 26 | 28 | 24 | 8.78 | 52.7 | 10.4 | 1: 2.13 |
| T6 | 37.55 | 45.59 | 57.31 | 14 | 26 | 29 | 24.8 | 9.1 | 53.2 | 10.9 | 1: 2.12 |
Table text extracted from the original PDF; superscript letters are shown inline. The original table image is below.
View original table image
References
22 in the original paper- Adekiya AO, Ogunbode TO, Esan VI, Adedokun O, Olatubi IV, Ayegboyin MH. Short-term effects of biochar on soil chemical properties, growth, yield, quality, and shelf life of tomato. Sci Rep. 2025;15(1):24965.
- Amruta N, Devaraju PJ, Mangalagowri K, Kiran SP, Ranjitha HP, Kalavati P. Effect of integrated nutrient management and spacing on seed quality parameters of black gram cv. LBG-625 (Rashmi). J Appl Nat Sci. 2017;8(1):340-5.
- Bhadu K, Agrawal KK, Choudhary R. Yield and economics of green gram and black gram as influenced by nutrient management under organic farming. Int J Chem Stud. 2018;6(3):391-5.
- Chandrakar K, Verma SK, Dubey S, Kesari R. Yield gap analysis of black gram through front line demonstration under rainfed condition. Int J Chem Stud. 2018;6(4):3173-6.
- Chintha P, Alka Y, Choudhary BL, Puniya MM. Response of integrated phosphorus management on nodulation and productivity of mungbean on Typic Ustipsamment. Green Farming. 2021;5:222-5.
- Choudhary GL, Sharma SK, Choudhary S, Singh KP, Kaushik MK, Bazaya BR. Effect of Panchagavya on quality, nutrient content and nutrient uptake of organic black gram. J Pharmacogn Phytochem. 2017;6(5):15725.
- Dangi A, Kumar S, Singh S, Omkar, Singh BP. Effect of phosphorus and sulphur fertilization on productivity and nutrient uptake of black gram. Ann Agric Res (New Ser). 2020;35(1):54-7.
- Deshmukh S, Deo C, Khandelwal RB. Effect of P and S nutrition on yield and quality of black gram. J Indian Soc Soil Sci. 2014;57:352-6.
- Hussain M, Tahir M, Majeed MA. Effect of zinc sulphate as soil application and seed treatment on black gram (Vigna mungo L.). Pak J Life Soc Sci. 2022;12(2):87-91.
- Jat SL, Prasad K, Parihar CM. Effect of organic manuring on productivity and economics of summer mungbean. Ann Agric Res (New Ser). 2012;33(1-2):1720.
- Javeed A, Gupta M, Gupta V. Effect of graded levels of NPK on growth, yield and quality of black gram under subtropical conditions. SSARC Int J Manag. 2017;3(1):1-8.
- Jha PD, Sharma SK, Amarawat T. Effect of organic and inorganic sources of nutrients on yield and economics of black gram grown during Zaid season. Agric Sci Dig. 2015;35(3):224-8.
- Kaewwongwal A, Kongjaimun A, Somta P, Chankaew S, Yimram T, Srinives P. Genetic diversity of the black gram [Vigna mungo (L.) Hepper] gene pool as revealed by SSR markers. Breed Sci. 2015;65:127-37.
- Khan F, Nayab M, Ansari AN, Zubair M. Medicinal properties of mash (Vigna mungo (Linn.) Hepper): A comprehensive review. J Drug Deliv Ther. 2021;11:121-4.
- Koushal P, Singh K. Effect of phosphorus and biofertilizers on yield, nutrient content and uptake of urdbean (Vigna mungo L.). Int J Curr Microbiol Appl Sci. 2011;6(5).
- Kumar R, Baba AY, Bhusan A, Singh K, Kumar M. Growth, yield and economics of black gram as influenced by organic and inorganic nutrient sources under sodic soil conditions. Plant Arch. 2020;20:79914.
- Meena PK, Bairwa RC, Yadav A, Kumawat S, Meena P, Choudhary S. Influence of weed control measures and nutrient management on nutrient content, uptake and use efficiency of fennel. Int J Plant Soil Sci. 2023;35(21):712-17.
- Nair RM, Chaudhari S, Devi N, Shivanna A, Gowda A, Boddepalli VN, et al. Genetics, genomics, and breeding of black gram [Vigna mungo (L.) Hepper]. Front Plant Sci. 2024;14:1273363.
- Pachar D, Bharose R, David A, Pothana D, Yadav RK. Effects of different levels of NPK and biochar on soil physico-chemical properties and yield of black gram (Vigna mungo L.). Int J Res Agron. 2025;8(6):555-60.
- Sivakumar R, Singh P, Singh V, Yadav RA. Effect of phosphorus and PSB on growth parameters, yield, quality and economics of summer black gram. Int J Chem Stud. 2013;6(4):2798-800.
- Todawat A, Sharma SR, Lakharan H, Hemraj M. Effect of vermicompost and zinc on growth, yield attributes and yield of black gram under semi-arid conditions of Rajasthan. Int J Curr Microbiol Appl Sci. 2017;6(9):175-80.
- Usman M, Tahir M, Majeed MA. Effect of zinc sulphate as soil application and seed treatment on black gram (Vigna mungo L.). Pak J Life Soc Sci. 2014;12(2):87-91.