
Research article · 2025 · Full text
International Journal of Agriculture and Food ScienceAssessment of land degradation using the soil quality guide in some arid and semi-arid areas
Volume 7(11) · Pages 166–181 · DOI: 10.33545/2664844x.2025.v7.i11c.955 ↗
Research areasSoil Geostatistics and MappingSoil and Land Suitability AnalysisGeochemistry and Geologic Mapping
Abstract
Author-writtenThis study was conducted to assess the state of soil degradation and desertification using the MEDALUS model and the Soil Quality Guide in the semi-arid region located between longitudes 43°54'25" E and 44°03'27" E east, and latitudes 34°05'58" N and 36°04'31" N north, which includes parts of the Kirkuk and Erbil plains within Kirkuk and Erbil governorates, covering a total area of approximately 460,000 hectares. Five pedons were excavated and morphologically described according to Schoeneberger et al. (2012), and samples were taken from representative horizons of each pedon. In addition, thirty-six surface soil samples were collected from areas surrounding each pedon, placed in nylon bags, labeled, and transported to the laboratory for physical and chemical analyses, resulting in a total of sixty samples. Satellite imagery from the American Landsat 7 and Landsat 8 satellites at multiple dates (11/6/2000 and 18/6/2020) was used, and spatial distribution maps were prepared using ArcGIS 10.4.1. The study revealed the following: A- Assessment of Desertification Using the MEDALUS Model: Soil Quality Index (SQI): 1- The soil texture index ranged from Class 1 (Good), occurring in some parts of the Daqouq area and small parts of Al-Tun Kubri and Qushtapa, to Class 2 (Moderate), found in major parts of Daqouq, Shuwan, Al-Tun Kubri, Shirawa, and Qushtapa, and Class 3 (Poor), occurring in small parts of Daqouq, Al-Tun Kubri, Qushtapa, and Shirawa. These classes covered areas of 731.54, 455,868.21, and 3,400.25 hectares, representing 0.2%, 99.1%, and 0.7% of the total area, respectively. As for the indices of parent material, rock fragments, slope, soil depth, and soil drainage, they were classified as Class 2 (Moderate), Class 3 (Bare to Slightly Rocky), Class 1 (Very Level), Class 1 (Deep), and Class 1 (Good), respectively. The organic matter content index fell within Class 2 (Good) in the Shuwan area and parts of Al-Tun Kubri, and Class 3 (Moderate) in Daqouq, Shirawa, and Qushtapa. The area of Class 2 (Good) was 172,897.40 hectares, representing 37.59%, while Class 3 (Moderate) covered 287,102.6 hectares, or 62.41% of the study area. The calcium carbonate content index was classified as Class 3 (Poor). The pH index of the study area soils fell within Class 3 (Moderate) in Daqouq and Class 4 (High) in Qushtapa, Shirawa, Al-Tun Kubri, Shuwan, and parts of Daqouq, covering areas of 121,782.76 and 338,217.24 hectares, representing 26.47% and 73.53%, respectively. Meanwhile, the electrical conductivity (EC) index for the soils of the study area was classified as Class 1 (Low). 2- The Soil Quality Index (SQI) for the study area fell within Class 2 (Moderate Quality). B- Assessment of Desertification and Degradation Using Remote Sensing Techniques: 1- The imagery resulting from the supervised classification for the period between 2000 and 2020 indicated a change in land cover features, with a clear transformation of large areas of agricultural or arable lands into urban or non-agricultural lands.
Summary
Source-checkedPlain-language reading of the full paper, prepared with AI and checked against the text. Each point links to the authors' own words.
Why it matters
- Desertification is a global issue affecting arid and semi-arid environments, which make up over 40% of the Earth's land surface, by reducing the land's physical, chemical, and biological potential. View evidence ↗
- Of the estimated 5.2 billion hectares of global drylands, more than 3.6 billion hectares are affected by desertification to some degree. View evidence ↗
- Iraq contains vast drylands showing evident degradation, primarily due to desertification, which necessitates assessment using specialized models. View evidence ↗
What they did
- The study utilized Landsat 7 and 8 satellite imagery from 2000 and 2020 to create spatial distribution maps via ArcGIS 10.4.1. View evidence ↗
- The total study area covered approximately 460,000 hectares. View evidence ↗
What they found
- The soil texture index was predominantly Class 2 (Moderate), covering 99.1% (455,868.21 hectares) of the area, while Class 1 (Good) and Class 3 (Poor) covered only 0.2% and 0.7% respectively. View evidence ↗
- Organic matter content was mostly Class 3 (Moderate), covering 62.41% (287,102.6 hectares) of the area, with Class 2 (Good) covering 37.59% (172,897.40 hectares). View evidence ↗
- The pH index was primarily Class 4 (High), covering 73.53% (338,217.24 hectares) of the area, while Class 3 (Moderate) covered 26.47% (121,782.76 hectares). View evidence ↗
- The index for calcium carbonate content was classified as Class 3 (Poor). View evidence ↗
- The electrical conductivity (EC) index for the study area soils was classified as Class 1 (Low). View evidence ↗
- The overall Soil Quality Index (SQI) for the study area was determined to be Class 2, indicating Moderate Quality. View evidence ↗
- Remote sensing analysis from 2000 to 2020 showed a clear transformation of large agricultural or arable land areas into urban or non-agricultural land. View evidence ↗
What it means
- The authors conclude that the soil quality in the studied semi-arid region of Iraq is of moderate quality. View evidence ↗
Visual summary
3 visualsIllustrations explain the paper; charts are replotted from the paper's own table values.
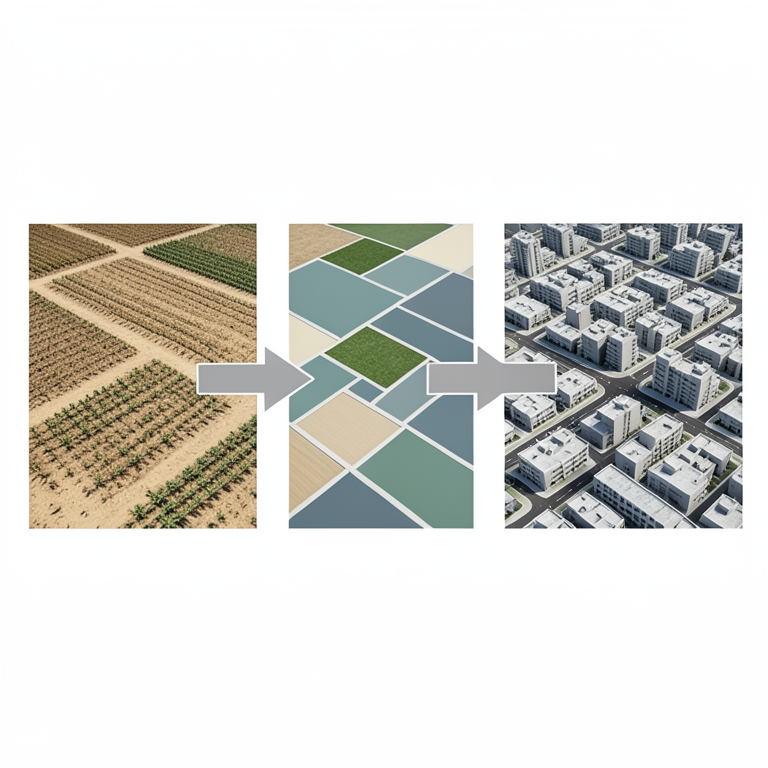
Land Use Transformation
AI-generated conceptual illustration (arid and semi-arid landscape transitioning from agricultural fields to urban development). It explains the idea and does not show study data.
View source evidence ↗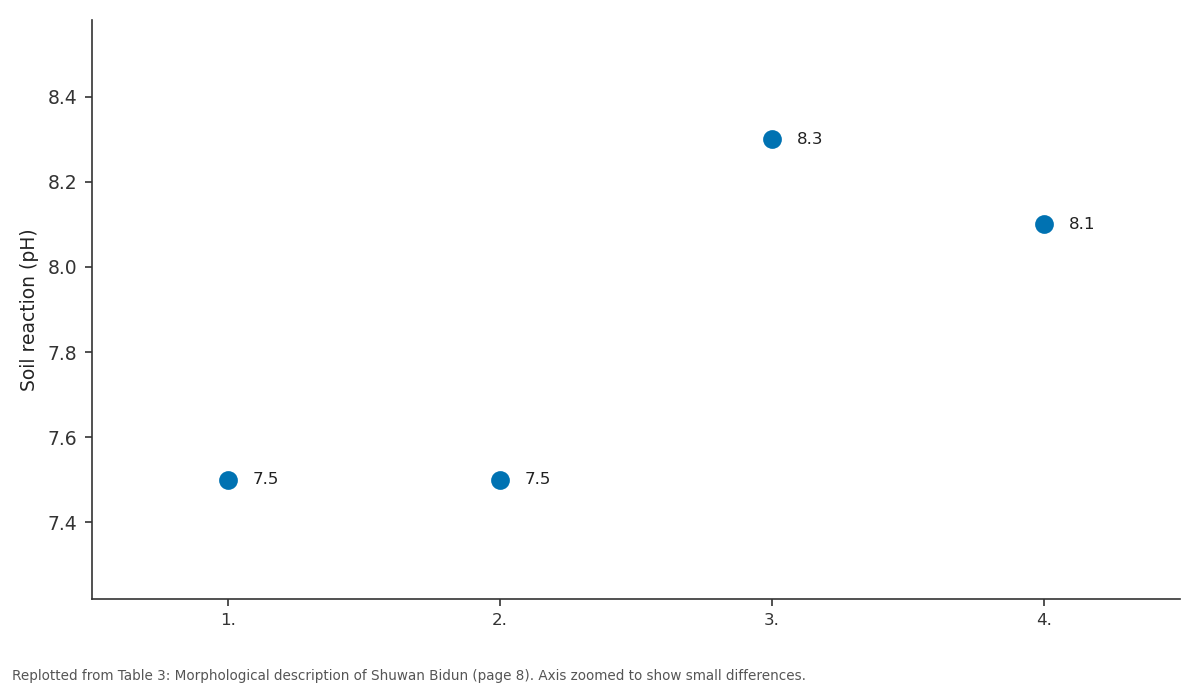
Soil reaction: 1. vs 2. vs 3. vs 4.
Replotted from Table 3 (page 8) of the original paper. Every bar is the paper's own table value.
View source evidence ↗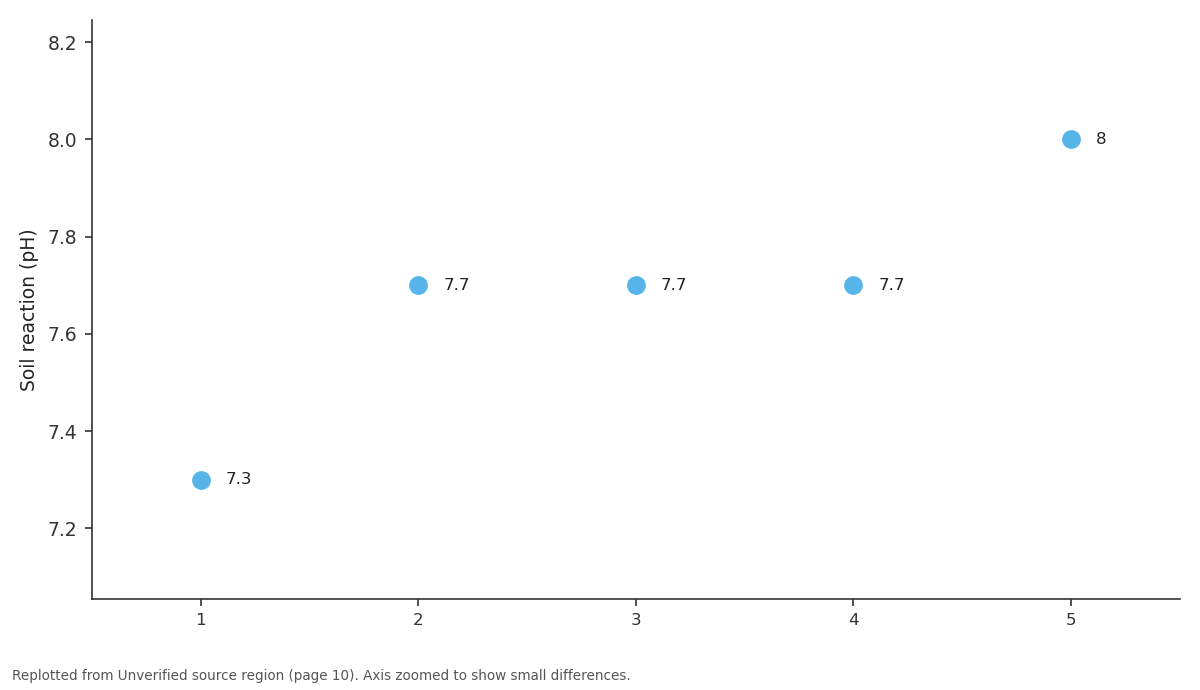
Soil reaction: 1 vs 2 vs 3 vs 4 vs 5
Replotted from a table (page 10) of the original paper. Every bar is the paper's own table value.
View source evidence ↗Figures & tables
From the original paper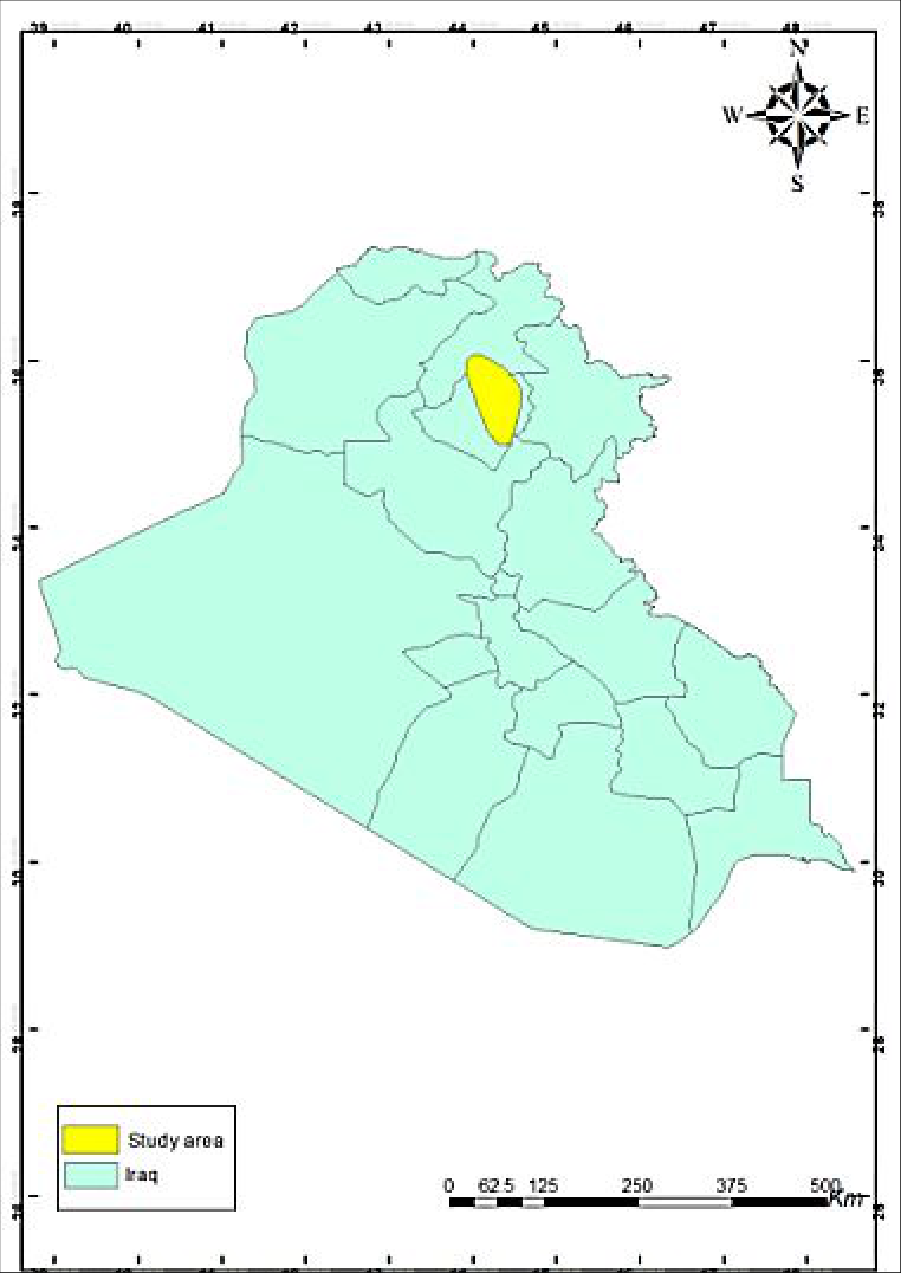 Figure 1
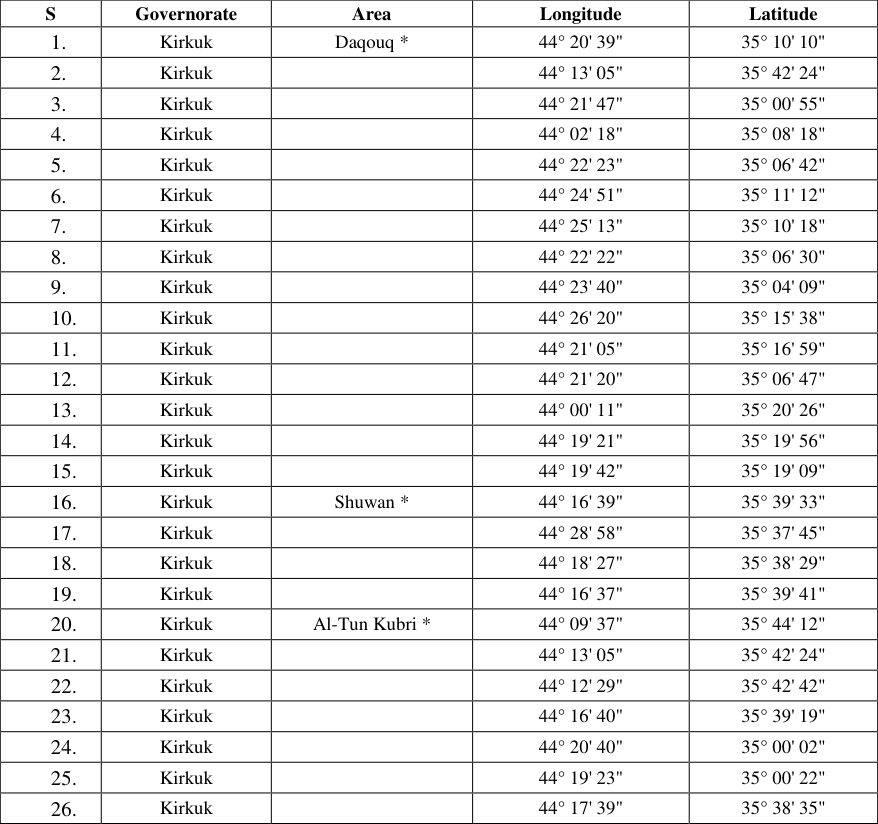 Table 1
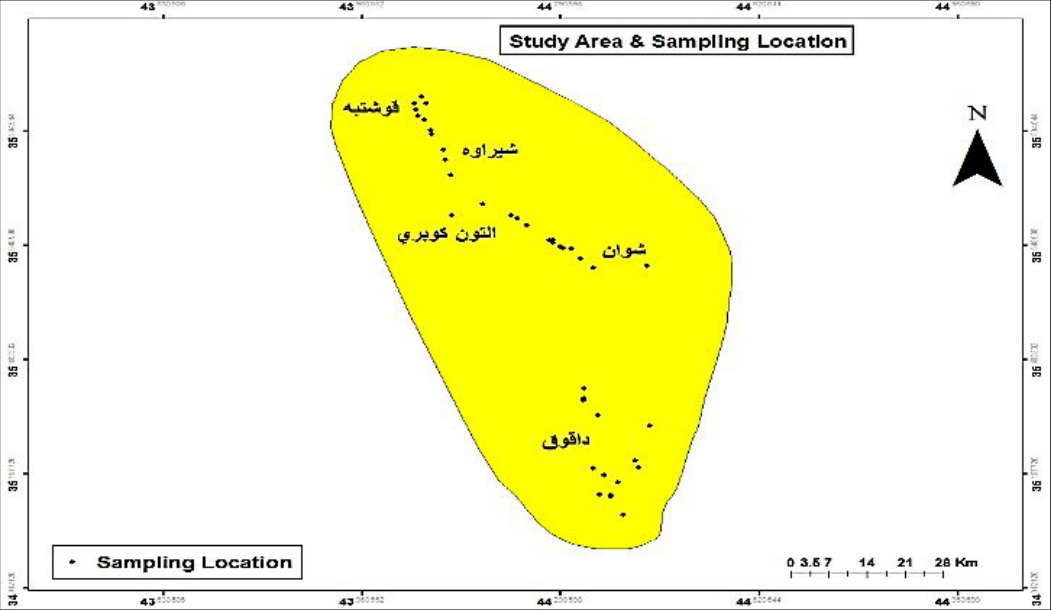 Figure 2
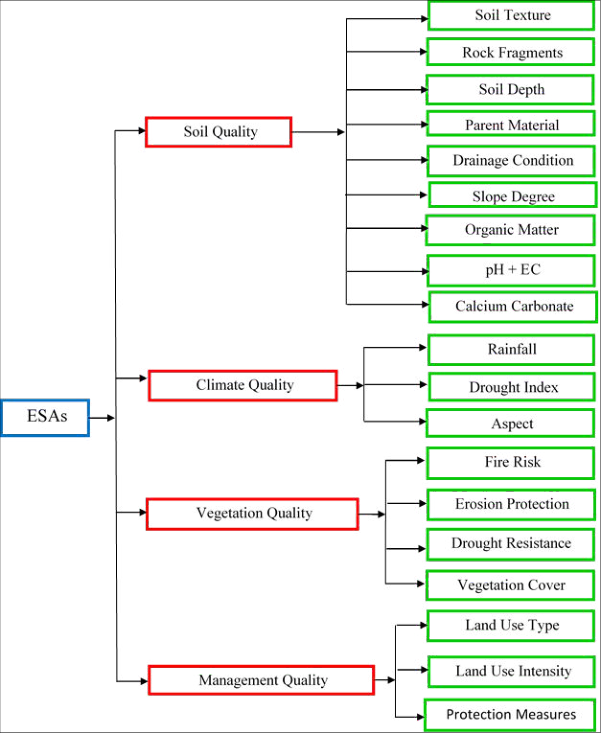 Figure 3
 Table 3
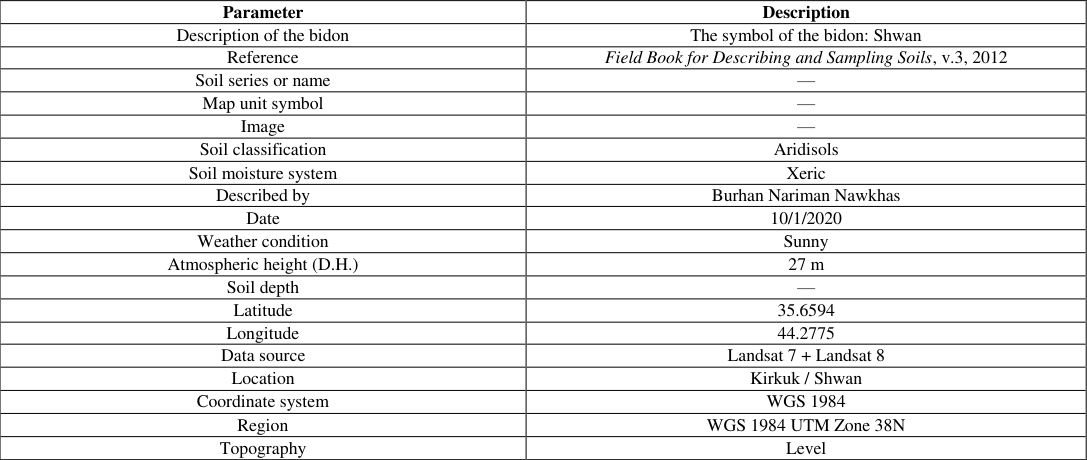 Table 3
Introduction
Soil is one of the most important renewable natural resources and is not a static mass as many believe. It forms through the interacting effects of climate and living organisms on parent material under the influence of topography over a period of time. This indicates that soil formation in arid and semi-arid regions differs significantly from soils formed in humid regions. Due to the mismanagement of lands by their owners, the rate of land degradation and desertification has accelerated because of increasing pressures on agricultural production and the unscientific exploitation of land resources. This results in the removal of vegetative cover, degradation of the land's productive capacity, and the loss of an irreplaceable natural resource, which constitutes a catastrophe for agricultural production, as no agricultural intervention can fully restore its original productivity. Arid lands are formed due to low rainfall, drought, and high temperatures, as well as human activities such as deforestation, fires, overgrazing, and intensive farming. These factors lead to water and wind erosion, reduced soil fertility, and decreased biomass, ultimately causing land degradation and desertification (FAO, 2007) [2] . Desertification describes the condition in which productive land becomes less productive due to degradation, eventually rendering it unproductive. Desertification is a serious issue that requires monitoring, control, and mitigation by the state, and international efforts should recognize it as a global problem (EOLSS). Desertification is a global phenomenon resulting from a combination of geological, climatic, biological, and human factors that reduce the physical, chemical, and biological potential of the land in arid and semi-arid environments, which cover more than 40% of the Earth's land surface (Deichman & Eklundh, 1991). About one-third of the Earth's surface lies in arid and semi-arid regions, and more than 20% of the land in two-thirds of the world's countries is directly threatened by desertification. Desertification is a dynamic process resulting from the progression of land degradation in arid, semi-arid, and dry sub-humid areas due to the environmental characteristics of these regions, as well as improper human practices in utilizing their resources. It is considered the final stage of land degradation (UNCCD, 2014) [5] . The global area of drylands is estimated at 5.2 billion hectares, with more than 3.6 billion hectares affected by desertification to varying degrees. Approximately 1.25 billion people, or about 25% of the world's population, are threatened by desertification, which causes material losses exceeding 52 billion USD annually due to decreased land productivity, affecting 110 countries (Al-Louzi, 2008). According to Asio et al. (2009) [6] , approximately 6 million hectares of agricultural land become unproductive each year due to degradation processes. Bini (2009) [8] indicated that 33% of the world's land surface is affected by various types of degradation, including wind and water erosion, deforestation, salinization, acidification, and chemical pollution. Low (2013) [7] reported that land degradation impacts 1.9 billion hectares of land and 250 million people. Stavi and Lal (2015) [9] noted that degraded lands cover approximately 23% of the world's surface, increasing at a rate of 5-10 million hectares per year and affecting nearly 1.5 billion people. Due to the presence of vast areas of drylands in Iraq and the evident degradation of these lands for several reasons, most notably desertification, this study was conducted to assess the state of land degradation and desertification using the MEDALUS model. This is achieved through the following:
1. Adopting soil quality indicator criteria to determine environmental sensitivity. 2. Preparing a map of environmental sensitivity to desertification and its severity levels. 3. Monitoring spatial and temporal changes using remote sensing techniques.
Materials and Methods Study Area
As part of the field procedures, observations and field data were recorded, which play a significant role in describing the study areas through field visits. These visits aimed to determine the land-use patterns in these areas and to record information related to the effects of soil properties, which are crucial in assessing the degree of soil degradation. Several sites were selected within the administrative boundaries of Kirkuk and Erbil governorates, noting variations in their environmental, chemical, and physical properties. The lands in these areas were characterized by undulating terrain with hills, while the majority of the land was flat to gently sloping. In terms of land use, wheat, barley, and vegetables were the most cultivated crops, and the vegetative cover consisted mainly of short seasonal herbaceous plants.
After field investigation and study, the area located between longitudes 43°54'25" E and 44°03'27" E east and latitudes 34°05'58" N and 36°04'31" N north was selected. This area includes parts of the Kirkuk and Erbil plains within Kirkuk and Erbil governorates (Figure 2 and Table 1), covering a total area of approximately 460,000 hectares. Five pedons were excavated and morphologically described according to Schoeneberger et al. (2002) [1] , and samples were taken from the representative horizons of each pedon. In addition, thirty-six surface soil samples were collected from areas surrounding each pedon, resulting in a total of sixty samples. These samples were placed in nylon bags, labeled, and transported to the laboratory for physical and chemical analyses.
| S | Governorate | Area | Longitude | Latitude |
|---|---|---|---|---|
| 1. | Kirkuk | Daqouq * | 44° 20' 39" | 35° 10' 10" |
| 2. | Kirkuk | 44° 13' 05" | 35° 42' 24" | |
| 3. | Kirkuk | 44° 21' 47" | 35° 00' 55" | |
| 4. | Kirkuk | 44° 02' 18" | 35° 08' 18" | |
| 5. | Kirkuk | 44° 22' 23" | 35° 06' 42" | |
| 6. | Kirkuk | 44° 24' 51" | 35° 11' 12" | |
| 7. | Kirkuk | 44° 25' 13" | 35° 10' 18" | |
| 8. | Kirkuk | 44° 22' 22" | 35° 06' 30" | |
| 9. | Kirkuk | 44° 23' 40" | 35° 04' 09" | |
| 10. | Kirkuk | 44° 26' 20" | 35° 15' 38" | |
| 11. | Kirkuk | 44° 21' 05" | 35° 16' 59" | |
| 12. | Kirkuk | 44° 21' 20" | 35° 06' 47" | |
| 13. | Kirkuk | 44° 00' 11" | 35° 20' 26" | |
| 14. | Kirkuk | 44° 19' 21" | 35° 19' 56" | |
| 15. | Kirkuk | 44° 19' 42" | 35° 19' 09" | |
| 16. | Kirkuk | Shuwan * | 44° 16' 39" | 35° 39' 33" |
| 17. | Kirkuk | 44° 28' 58" | 35° 37' 45" | |
| 18. | Kirkuk | 44° 18' 27" | 35° 38' 29" | |
| 19. | Kirkuk | 44° 16' 37" | 35° 39' 41" | |
| 20. | Kirkuk | Al-Tun Kubri * | 44° 09' 37" | 35° 44' 12" |
| 21. | Kirkuk | 44° 13' 05" | 35° 42' 24" | |
| 22. | Kirkuk | 44° 12' 29" | 35° 42' 42" | |
| 23. | Kirkuk | 44° 16' 40" | 35° 39' 19" | |
| 24. | Kirkuk | 44° 20' 40" | 35° 00' 02" | |
| 25. | Kirkuk | 44° 19' 23" | 35° 00' 22" | |
| 26. | Kirkuk | 44° 17' 39" | 35° 38' 35" |
Table text extracted from the original PDF; superscript letters are shown inline. The original table image is below.
View original table image
A-Lab Work
Soil samples were transported to the laboratory after being placed in nylon bags and labeled according to the study objectives. This included samples from pedon horizons and surface soils surrounding the pedons. The collected samples were air-dried, sieved, homogenized, and passed through a 2 mm mesh sieve, then stored in plastic bags for the purpose of conducting physical and chemical analyses of the soil properties relevant to the study, as follows:
A-Physical Characteristics 1. Soil Particle Size Distribution:
The volumetric distribution of soil separates (sand, silt, clay) was determined using the hydrometer method described by Gee and Bauder (1986) [10] , in addition to using the textural triangle to classify soil texture.
Bulk Density: Bulk density was measured using the paraffin wax method as described by Black (1965) [11] . [12] .
Electrical Conductivity (EC): Electrical conductivity
was measured in a soil-water extract (1:2.5) using an EC meter and expressed in dS m⁻¹, as described by Richards (1954) [12] . 3. Soluble Ions: Soluble ions were determined in a soilwater extract (2.5:1) as follows:
Soluble Cations a) Potassium (K⁺) and Sodium (Na⁺) ions: Potassium and sodium ions were measured using a flame photometer (PFP7). b) Calcium (Ca²⁺) and Magnesium (Mg²⁺) ions:
Dissolved calcium and magnesium ions were determined by titration with standard 0.01 M EDTA, according to Richards (1954) [12] .
Soluble Anions a) Chloride (Cl⁻) ions
Dissolved chloride ions were measured by titration with 0.05 M silver nitrate, as described by Richards (1954) [12] . b) Carbonate (CO₃²⁻) and Bicarbonate (HCO₃⁻) ions:
Carbonate and bicarbonate ions were determined by titration with 0.01 M diluted sulfuric acid (H₂SO₄), according to Richards (1954) [12] . c) Sulfate (SO₄²⁻) ions: Sulfate ions were determined using the turbidity method with barium chloride (BaCl₂)
and measured with a spectrophotometer at a wavelength of 470 nm, as described by Black (1965b) [13] .
Cation Exchange Capacity (CEC):
Cation exchange capacity (CEC) was determined using the sodium acetate saturation method at pH 8.2, followed by alcohol washing and ammonium acetate precipitation at pH 7, according to FAO (1990) [2] . Sodium ions were measured using a flame photometer (PFP7).
Organic Matter
Organic matter in the studied soil samples was determined using the wet oxidation method according to the Smith-Weldon modification of the Walkley-Black method, as described by Abdelhadi (1986).
Calcium Carbonate
Calcium carbonate in the soil samples of the studied sites was determined using the gravimetric method, which is based on measuring the weight of CO₂ lost from the soil sample during the decomposition of calcium carbonate with HCl, as described by Richards (1954) [12] .
Gypsum
Gypsum content was determined using the dilution method as described by Al-Zubaidi et al. (1981) [14] .
C-Office Work Desertification Assessment According to the MEDALUS Project (Kosmas et al., 1999)
The assessment involves two stages. In the first stage, four indicators are calculated, including the Soil Quality Indicator, Climate Quality Indicator, Vegetation Quality Indicator, and Management Quality Indicator, providing a measure of the inherent quality of the physical environment and the human-induced stress caused by desertification (Figure 3).
Results and Discussion 1. Morphological Characteristics
The morphological description of the pedons in the study area (Tables 28-32) indicated the presence of a surface diagnostic horizon (Ochric Epipedon) and a subsurface diagnostic horizon (Calcic Epipedon), with some subsurface horizons containing high calcium content. The soils of the study area included the main horizons (A-B-C) (Schoeneberger et al., 2012) [1] . Variations in soil consistency were due to differences in soil mineral components, calcium carbonate content, and organic matter levels.
The morphological description indicated that horizon boundaries ranged from abrupt smooth to gradual wavy, reflecting soil formation processes and agricultural practices such as plowing. Root abundance varied from common (C) to few (F) and very few (V), depending on vegetation density. Root size ranged from fine (F) to very fine (VF) in surface horizons, decreasing with depth, and roots were mainly located between soil aggregates. Porosity varied from many (M) to common (C), moderately few (MF), and very few (VF), with pore sizes ranging from fine (F) to very fine (VF) and medium (M), and pore shapes varying between vesicular (VS) and tubular (TU). Differences in porosity and its decrease with depth were attributed to soil compaction and high calcium carbonate content. Soil reaction (pH) analysis (Tables 3536) showed pH values ranging from 7.3-8.3. Previous studies (Al-Zubadi, 1974; Dregne, 1976; Awad, 1986) [15] indicated that Iraqi soils are generally slightly basic, consistent with the high calcium content in pedons of the study area, ranging from slightly basic to basic
Figures and tables from the paper
| S. No. | Location of the Bidun | Oxidation and reduction features | Concentrations | Pore features and surface soil aggregates | Root distribution | — | — | Pores | — | — | Soil reaction | Notes |
|---|---|---|---|---|---|---|---|---|---|---|---|---|
| Abundance | Size | Location | Abundance | Size | Shape | |||||||
| 1. | Daquq | C | F | P | C | F | VS | 7.5 | ||||
| 2. | N | N | N | MF | F | TU+VS | 7.5 | |||||
| 3. | N | N | N | F | VF | TU | 8.3 | |||||
| 4. | N | N | N | VF | VF | VS | 8.1 |
Table text extracted from the original PDF; superscript letters are shown inline. The original table image is below.
View original table image
| Parameter | Description |
|---|---|
| Description of the bidon | The symbol of the bidon: Shwan |
| Reference | Field Book for Describing and Sampling Soils, v.3, 2012 |
| Soil series or name | — |
| Map unit symbol | — |
| Image | — |
| Soil classification | Aridisols |
| Soil moisture system | Xeric |
| Described by | Burhan Nariman Nawkhas |
| Date | 10/1/2020 |
| Weather condition | Sunny |
| Atmospheric height (D.H.) | 27 m |
| Soil depth | — |
| Latitude | 35.6594 |
| Longitude | 44.2775 |
| Data source | Landsat 7 + Landsat 8 |
| Location | Kirkuk / Shwan |
| Coordinate system | WGS 1984 |
| Region | WGS 1984 UTM Zone 38N |
| Topography | Level |
Table text extracted from the original PDF; superscript letters are shown inline. The original table image is below.
View original table image
References
14 in the original paper- Schoeneberger PJ, Wysocki DA, Benham EC, Broderson WD. Field book for describing and sampling soils. Version 2.0. Lincoln (NE): Natural Resources Conservation Service, National Soil Survey Center; 2002.
- Food and Agriculture Organization (FAO). Dryland forestry [Internet]. Rome: FAO; 2007 [cited 2025 Nov 8]. Available from: http://www.fao.org/dryland-forestry/background/whatare-drylands/en/
- Ekhtesasi MR, Mohajeri S. Iranian classification of desertification method. In: 2nd National Conference of Desertification and Combating Desertification Methods; 1995; Kerman, Iran.
- United Nations Convention to Combat Desertification (UNCCD). Land Degradation Neutrality: The Target Setting Programme. Technical Report. Bonn (DE): UNCCD; 2016.
- Asio VB, Jahn R, Perez FO, Navarrete IA, Abit Jr SM. A review of soil degradation in the Philippines. Ann Trop Res. 2009;31:69-94.
- Low PS. Economic and social impact of desertification. In: Land degradation and drought, White Paper I. Bonn (DE): UNCCD 2nd Scientific Conference; 2013.
- Bini C. Soil: A precious natural resource. In: Kudrow NJ, editor. Conservation of Natural Resources. Hauppauge (NY): Nova Science Publishers; 2009. p. 1-48.
- Stavi I, Lal R. Achieving zero net land degradation: Challenges and opportunities. J Arid Environ. 2015;112:44-51.
- Gee GW, Bauder JW. Particle size analysis. In: Klute A, editor. Methods of Soil Analysis. Part 1: Physical and Mineralogical Methods. 2nd ed. Madison (WI): American Society of Agronomy; 1986. p. 383-409.
- Black CA. Methods of Soil Analysis. Part 1: Physical Properties. Madison (WI): American Society of Agronomy; 1965.
- Richards LA. Diagnosis and Improvement of Saline and Alkali Soils. Washington (DC): U.S. Salinity Laboratory, U.S. Department of Agriculture; 1954. (Agriculture Handbook No. 60).
- Black CA. Methods of Soil Analysis. Parts 1 and 2. Madison (WI): American Society of Agronomy; 1965. (Agronomy Monograph No. 9).
- Al Zubaidi AH. Chemical characteristics of some Iraqi soils. Pedology. 1974;19(1):65-148.
- Dregne HF. Soils of Arid Regions. Amsterdam: Elsevier Scientific Publishing Company; 1976.