
Research article · 2025 · Full text
International Journal of Geography Geology and EnvironmentCoffee production and land cover change in kyarumba sub-county, Kasese district
Volume 7(11) · Pages 08–17 · DOI: 10.22271/27067483.2025.v7.i11a.439 ↗
Research areasCocoa and Sweet Potato AgronomyCoffee research and impactsConservation, Biodiversity, and Resource Management
Abstract
Author-writtenThis study examined coffee production and land cover change in Kyarumba Sub-County, Kasese District, Uganda. Using survey data from 165 respondents and GIS analysis, the study found that about 1,800 hectares of land are under coffee cultivation making as the main land use activity in the sub county. It was established that between 2000 and 2020, forest cover declined by 36%, while agricultural land increased by 90%, largely due to coffee expansion. Although initiatives like Rainforest Alliance, organic farming and fair trade exist, their impact remains limited. This is because of low farmer awareness and weak institutional support. The study concludes that coffee farming sustains livelihoods but encourages deforestation. It therefore calls for stronger policies and farmer training to promote sustainable coffee production and compliance with the European Union Deforestation Regulation (EUDR).
Summary
Source-checkedPlain-language reading of the full paper, prepared with AI and checked against the text. Each point links to the authors' own words.
Why it matters
- Coffee is a globally significant commodity, ranking as the second most traded after oil. View evidence ↗
- Compliance with environmental standards is economically critical for Uganda because approximately 65% of its coffee is exported to the European Union. View evidence ↗
- The European Union Deforestation Regulation (EUDR) aims to prevent the import of agricultural commodities, including coffee, that are linked to deforestation. View evidence ↗
The question
- The study aims to determine the amount of land used for coffee production, analyze land cover changes from 2000 to 2020, and identify environmental protection initiatives in Kyarumba Sub-County. View evidence ↗
What they did
- The researchers used a cross-sectional survey design that combined qualitative and quantitative methods. View evidence ↗
- The study interviewed a sample of 165 respondents. View evidence ↗
- Landsat 8 satellite imagery from 2000, 2010, and 2020 was used to analyze land cover dynamics over two decades. View evidence ↗
What they found
- Coffee cultivation is the primary land use activity in the sub-county, covering approximately 1,800 hectares. View evidence ↗
- Between 2000 and 2020, forest cover dropped from 45.5% to 23.5% of the total area, which is a 36% reduction in actual forest area (from 25 ha to 16 ha). View evidence ↗
- Agricultural land increased by 90% (from 10 ha to 19 ha) over the same period, indicating that forests were converted into cropland, including coffee farms. View evidence ↗
- Bare land doubled from 5 ha to 10 ha, signaling land degradation resulting from unsustainable land use. View evidence ↗
- Only 16.4% of respondents were aware of the EUDR, suggesting a high risk of non-compliance among local farmers. View evidence ↗
- The Rainforest Alliance initiatives were the most recognized sustainability effort, with a 60.6% recognition rate. View evidence ↗
What it means
- The authors conclude that while coffee farming provides essential livelihood support, it simultaneously drives deforestation. View evidence ↗
- The authors recommend implementing stronger policies and farmer training to ensure sustainable production and compliance with EUDR. View evidence ↗
- The accuracy of land cover classification declined from 92.7% in 2000 to 79.4% in 2020, indicating a need for more advanced remote sensing and ground-truthing in future studies. View evidence ↗
Visual summary
3 visualsIllustrations explain the paper; charts are replotted from the paper's own table values.
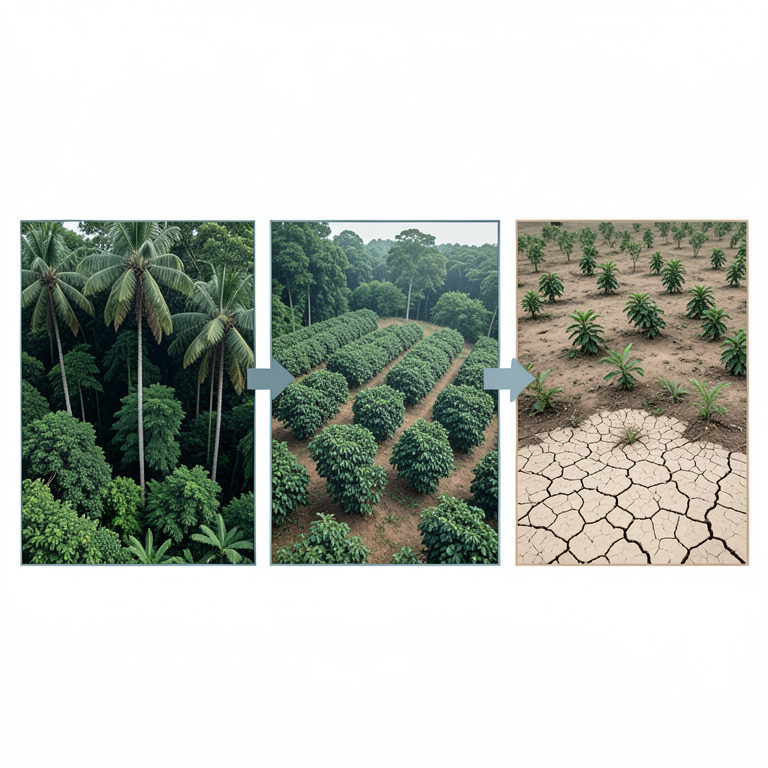
Land Cover Transition
AI-generated conceptual illustration (Ugandan landscape with native forests and coffee plantations). It explains the idea and does not show study data.
View source evidence ↗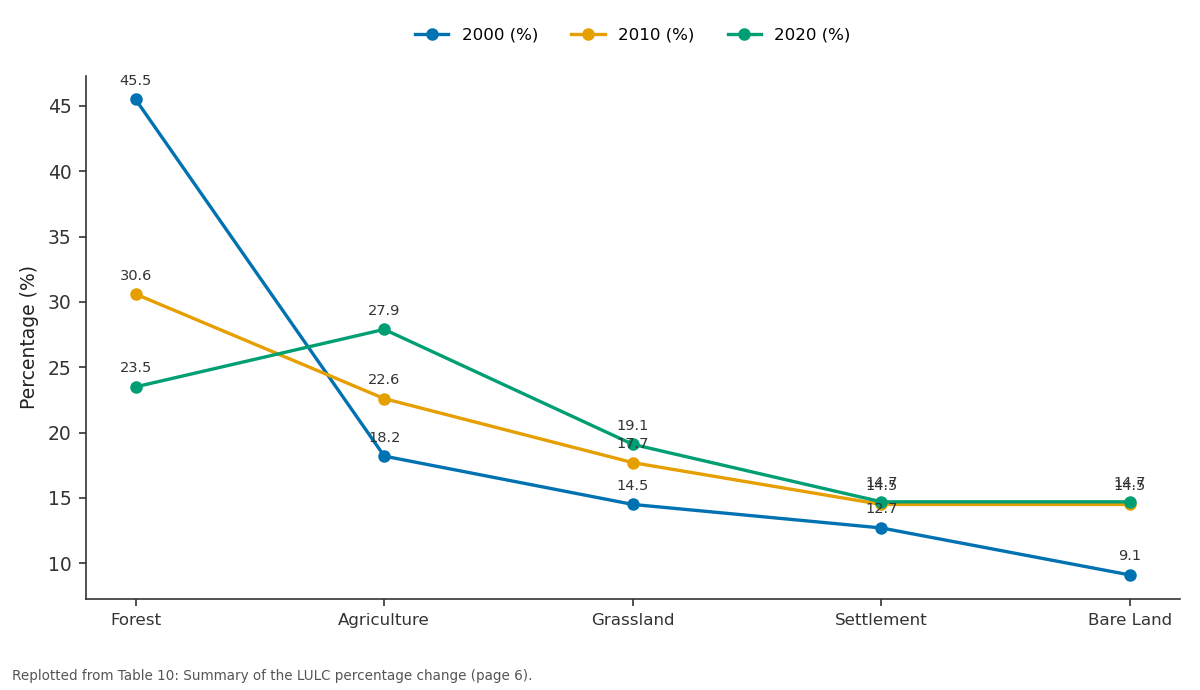
2000 (%) and 2010 (%) and more: Forest vs Agriculture vs Grassland vs Settlement vs Bare Land
Replotted from Table 10 (page 6) of the original paper. Every bar is the paper's own table value.
View source evidence ↗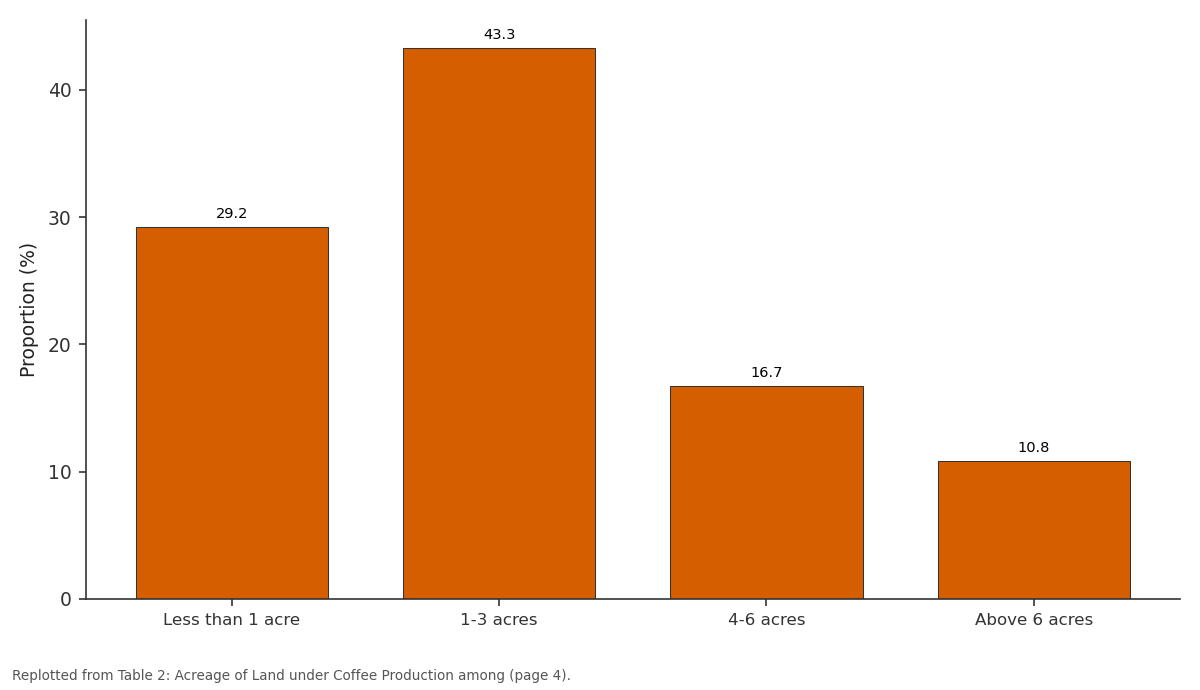
Proportion (%): Less than 1 acre vs 1-3 acres vs 4-6 acres vs Above 6 acres
Replotted from Table 2 (page 4) of the original paper. Every bar is the paper's own table value.
View source evidence ↗Figures & tables
From the original paper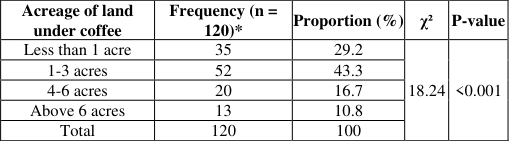 Table 2
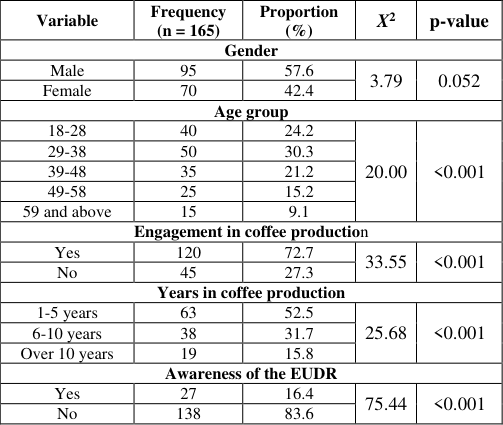 Table 1
 Table 3
 Table 4
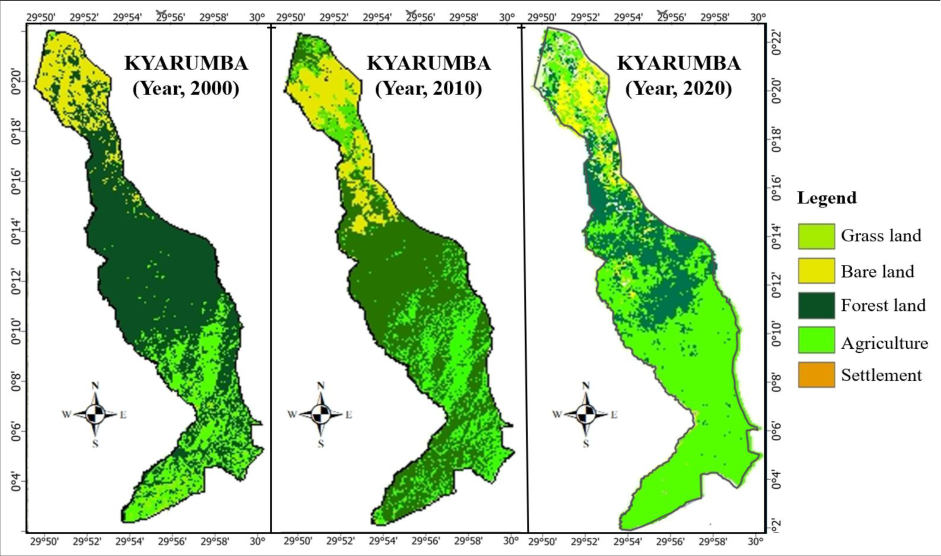 Figure 1
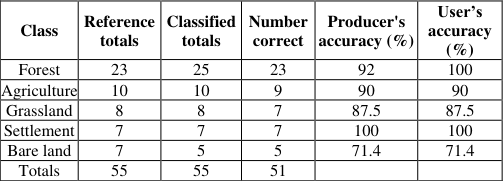 Table 5
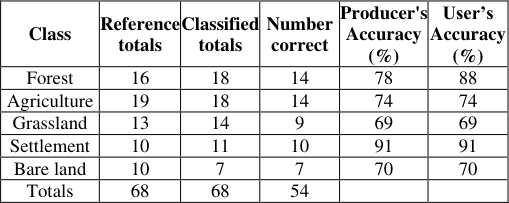 Table 9
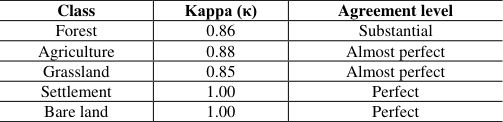 Table 6
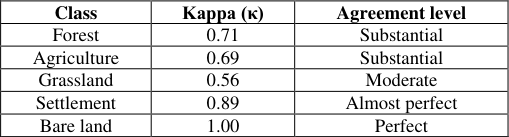 Table 10
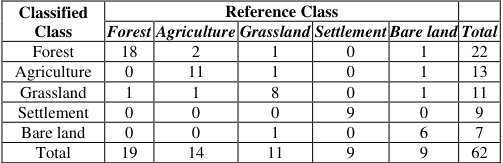 Table 6
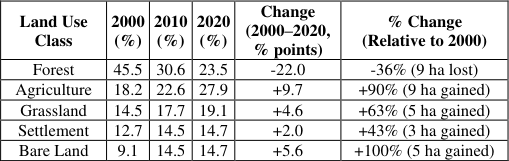 Table 10
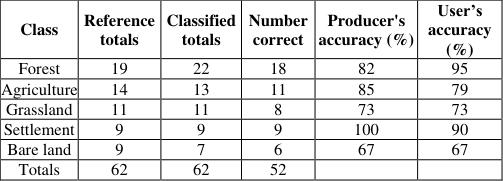 Table 7
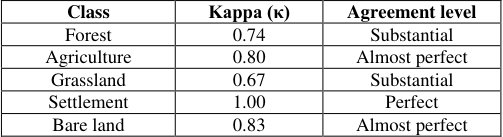 Table 8
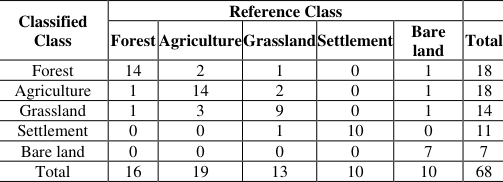 Table 8
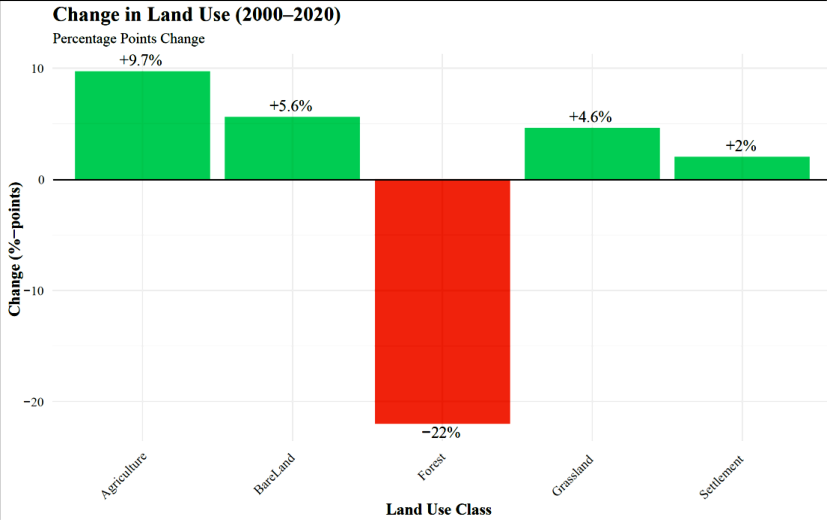 Figure 2
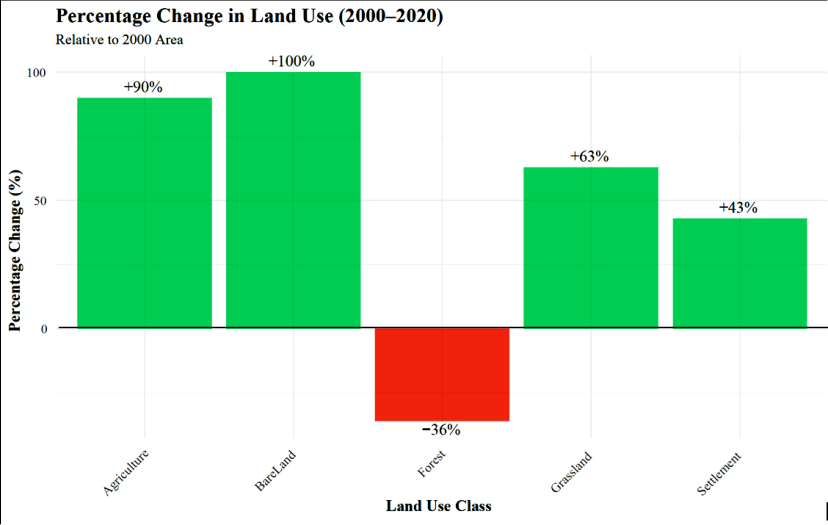 Figure 3
 Table 11
Introduction 1.1 Background
Globally, agricultural production and international trade have increasingly been linked to environmental degradation, especially deforestation and land cover change. Achieving Sustainable Development Goal (SDG) 12, which promotes responsible consumption and production, requires balancing economic growth with environmental conservation. Many governments and private organizations have introduced sustainability standards to reduce the negative effects of global commodity chains (Oluwatosin Yetunde Abdul-Azeez et al., 2024). However, gaps still exist in enforcing these measures effectively, especially in developing countries (Fernandes Martins et al., 2022; Macdonald, 2020; Negi et al., 2020) [23,. 31, 36] . To curb deforestation associated with trade in agricultural and forestry products, the European Union (EU) introduced the EU Timber Regulation, which was later replaced by the EU Deforestation Regulation (EUDR) in 2023 (Berning & Sotirov, 2024) [11] . The EUDR seeks to ensure that agricultural commodities imported into the EU, such as coffee, cocoa, palm oil, and soybeans, are not linked to deforestation. This regulation, which will take effect in December 2025, uses satellite imagery and remote sensing technologies to trace the origins of these commodities (Escobar et al., 2020) [20] . Coffee, being the second most traded commodity globally after oil (Ole, 2024) [39] is one of the key agricultural products affected by the EUDR. Major coffee-producing countries, including Uganda, now face the challenge of aligning coffee production with sustainable land use practices. Uganda exports about 65% of its coffee to the EU market (UCDA, 2023a), making compliance with environmental standards crucial for the country's economy. The coffee sector supports over 1.7 million households, mainly smallholders located in the central, eastern, and western parts of Uganda (Poncet et al., 2024) [43] . In the Rwenzori region, including Kyarumba Sub-County in Kasese District, Arabica coffee is the main crop grown on the hilly slopes. Over the years, coffee production in Kyarumba has expanded as more land is cleared for cultivation. While this has increased household income, it has also contributed to land cover change and environmental degradation.
Yet, the actual extent of land under coffee production, the pattern of land cover change over time and the existing initiatives promoting environmental protection in Kyarumba Sub-County remain unclear. Understanding these dynamics is essential for promoting sustainable coffee production that supports both livelihoods and environmental conservation.
Problem Statement
Coffee is a vital cash crop in Uganda and a major source of income for households in Kyarumba Sub-County, Kasese District. However, the expansion of coffee farms has increasingly been associated with deforestation and loss of vegetation cover. As global attention shifts toward sustainable production, regulations such as the EU Deforestation Regulation (EUDR) require coffee exported to the EU to be traceable and free from deforestation risk (Berning & Sotirov, 2024) [11] . This presents both opportunities and challenges for smallholder coffee farmers in Uganda, who depend heavily on natural forests and steep slopes for cultivation. In Kyarumba Sub-County, anecdotal evidence suggests that land under coffee cultivation has increased over the past two decades, often replacing natural vegetation and other land uses. Yet, there is limited documentation on how much land is currently under coffee production and how this expansion has influenced land cover change between 2000 and 2020. Additionally, while several environmental protection initiatives exist at national and district levels, it is unclear how these are being implemented or integrated within local coffee farming practices in Kyarumba. Therefore, this study seeks to assess the amount of land under coffee production, examine land cover change between 2000, 2010, and 2020, and identify existing environmental protection initiatives in Kyarumba Sub-County, Kasese District. The findings will contribute to understanding the relationship between coffee production and land use dynamics, supporting sustainable agricultural and environmental management efforts in the region.
Objectives i) To assess the amount of land under coffee production in
Kyarumba Sub-County. ii) To examine the land cover change in Kyarumba Sub-County from the years 2000, 2010 and 2020. iii) To examine the existing initiatives for environmental protection in Kyarumba Sub-County.
Significance of the Study
This study provides critical insights into the relationship between coffee production and land cover change in Kyarumba Sub-County, Kasese District. It offers evidence on how the expansion of coffee farming has influenced environmental conditions and supports the formulation of sustainable land management strategies. The study findings will guide local authorities, policymakers and the Ministry of Agriculture, Animal Industry and Fisheries (MAAIF) in balancing agricultural productivity with environmental conservation. Additionally, the study contributes to academic knowledge on sustainable coffee production and raises community awareness about integrating environmental protection into farming practices.
Materials and Methods
Materials and Methods
Description of the study area
Geographically the study was conducted in Kyarumba Sub-County in Kasese district, southwestern Uganda. This was because Kyarumba Sub-County is one of the main coffee producing hubs in Uganda but also known for rampant destruction of trees. The neighboring areas of Kyarumba were also of great importance.
Research Design
This study applied a cross-sectional survey design, incorporating both quantitative and qualitative approaches. A qualitative approach was used due to its ability to study phenomena in detail. Meanwhile, a quantitative approach was employed to capture measurable data. The crosssectional research design enabled the researcher to analyze land cover change by examining the phenomena as they existed within the recorded time, drawing on existing occurrences.
Target population
The study involved coffee producers in Kyarumba Sub-County who are directly affected by coffee-related regulations. It also engaged policymakers from government departments such as UCDA, NFA, NEMA and GIZ to gain insight into their reception of the coffee production and land cover change in Uganda.
Sampling procedure and sample size determination 3.4.1. Sampling procedure
Simple random sampling was used to select participants from the coffee producers/farmers. The researcher randomly chose participants, ensuring that everyone in the study population had an equal likelihood of being selected. Additionally, purposive sampling was employed to select key informants. This non-probability sampling method involved deliberately choosing participants based on specific qualities. Coffee producers were selected through purposive sampling since they were clearly identified and known to be relevant to the study.
Sample size determination
The sample size was determined from a population of 290. Using the Krejcie and Morgan table, 165 respondents participated and were interviewed. This method was chosen because the selected sample accurately reflects the characteristics of the target population that is coffee producers and buyers in Kyarumba Sub County.
Data collection methods
Being a qualitative study, the research involved interviews, questionnaires and documentary reviews to collect data from participants.
Questionnaire method
A structured questionnaire was used to collect data from producers. This helped the researcher to collect quantifiable data which was used to provide triangulation and validation of the qualitative findings from key informants (Rathi & Ronald, 2022) [44] .
Interviews
Interviews helped the researcher to engage deeper with the participant and thus a deeper understanding of the phenomenon of the study. Data from key stakeholders were collected using Key informant interviews.
Document review
This involved systematic collection, documentation, analysis and interpretation to collect data from secondary sources. Relevant publications such as institutional reports, research publications, textbooks, newspapers and others were visited by the researcher to collect relevant information about coffee production and sustainable regulations. During the discussion, primary data was validated using information from these secondary.
Satellite Imagery
To investigate land cover change and degradation in Kyarumba Sub-county between 2000 and 2020, the researcher employed remote sensing techniques using Landsat satellite imagery. The process was structured to ensure that data collected would be both accurate and relevant to the local landscape. The researcher acquired Landsat 8 satellite images for the years 2000, 2010, and 2020, representing three critical periods over a span of 20 years. These images were selected to provide a comparative view of land cover dynamics over time. Since raw satellite images are often affected by cloud cover, cloud removal techniques were applied using cloud computing algorithms. Specifically, raster-based cloud filtering was used to eliminate clouded areas, resulting in clear and usable imagery suitable for classification and analysis. The study utilized Google Earth Engine (GEE) for preprocessing Landsat imagery, leveraging its extensive satellite imagery archive and advanced geospatial analysis capabilities to detect and quantify earth surface changes.
Data management and analysis 3.6.1. Descriptive statistics
Quantitative survey data was analyzed using SPSS version 27, and the descriptive statistics are presented as frequencies and percentages in the tables and charts.
Thematic analysis
Qualitative data was thematically analyzed through categorization into similar groups which groups were then presented and explained as narratives, experiences, proverbs and quotations to make the data meaningful (Braun & Clarke, 2019) [13] . The fields were systematically arranged in order of occurrence to make them more meaningful and the events in these themes were chronologically analyzed.
GIS Analysis
Geographic Information System (Arc GIS) tools were used to analyze historical and current satellite imagery. Image processing was conducted in ArcGIS Pro 3.02 using the maximum likelihood classification algorithm. For each of the three study periods, we will classify images using 40 training areas (10 per LULC class) based on signature files. All imagery will maintain 30m resolution with UTM-WGS 1984 Zone 36 projection. Preprocessing steps included band ratio calculations, radiometric correction (haze reduction), Tasseled Cap transformation, and post-classification comparisons to ensure accurate reflectance characterization. After preprocessing, the researcher carried out both unsupervised and supervised classification. Unsupervised classification helped in identifying general land cover categories based on spectral similarities. This step provided a basis for selecting training samples for more refined classification. For supervised classification, the researcher used different spectral band combinations to enhance feature differentiation. One of the most effective was the 432 RGB band combination (Red, Green, Blue), which was particularly useful in distinguishing agricultural areas, especially coffee plantations. Each land cover type was identified based on its unique spectral signature. The classified land cover types included: Agriculture (mainly coffee farms); Bareland (exposed or degraded soil); Forest land; Grassland; and Settlements (villages and towns).We analyzed two decades of Landsat 8 data (2000-2020) through cross-tabulation matrices and overlayed functions in ArcGIS to quantify temporal changes. Change matrix analysis and calculation of gross gains/losses were performed in Excel. Accuracy assessment evaluated how well classified images represent ground conditions. We conducted ground verification to identify misclassified areas, then generate an error matrix and calculate overall accuracy using Kappa statistics (Gunathilaka & Fernando, 2022) [26] . Overall accuracy was determined by dividing correctly classified pixels by total pixels, with ≥70% considered acceptable. The figure below presents the statistical analysis workflow. The CVI value of 0.78 was obtained, and since it is greater than 0.7 as recommended by Avinç & Doğan, (2024), the instrument was considered valid for data collection.
Reliability
This looked at data collection instruments' capability to produce similar results when used to measure something severally (Salmia, 2023) [48] . Before going to the field, I conducted a pilot study and peer review of the tools to identify any omissions and eliminate possibilities of error. The reliability of the research was calculated from the formula;
Where N is equal to the number of items, c is the average inter-item covariance among the items and v equals the average variance. A value 0.80 was obtained, and hence the instrument was considered reliable for use in data collection.
Ethical Considerations
Ethical principles as guided in scientific research were observed closely by the researcher. First, informed consent was sought from all participants and for in-school adolescents being mainly minors; it was sought first from the responsible authorities at the local government and line MDAs. Objectivity from the level of sampling were observed through the simple random sampling technique. Furthermore, anonymity was highly observed that respondent's identity won't be attached to their responses but responses will be treated as general findings (Mozersky et al., 2020) [33] . Confidentiality was observed and individual data will not be exposed to third parties but their contributions were treated as general data. The study also kept academic that no material rewards were given to respondents in exchange for data.
Results and Discussions
This chapter presents and analyzes the demographic information of respondents, study's findings on land under coffee production, land cover change and existing Initiatives for Environmental Protection in Kyarumba Sub-County. The chapter also compares local trends with global practices, offering insights into the balance between agricultural growth and environmental conservation. [34] . This instability may hinder longterm sustainability investments, requiring policy support for farmer retention. The critically low awareness (χ² = 75.44, p< 0.001) parallels studies in Peru (Bwalya et al., 2023) [14] , where top-down regulations failed to reach smallholders. Implications stress the need for localized education and cooperative-led training to bridge this gap. These findings underscore a misalignment between EUDR requirements and on-ground realities, calling for participatory policy design and capacity-building-a recommendation supported by literature on inclusive sustainability governance (Vellema et al., 2022). The results in Table 2 indicate that coffee occupies a substantial proportion of agricultural land in Kyarumba Sub-County. A majority of farmers (43.3%) cultivate coffee on 1-3 acres of land, while 29.2% operate on less than 1 acre. Notably, 27.5% of farmers have expanded their farms beyond 4 acres, with 10.8% owning more than 6 acres of coffee plantations. The Chi-square (χ² = 18.24, p< 0.001) shows a statistically significant variation in farm sizes, implying that coffee production is not only widespread but also expanding across varying landholding categories. These findings suggest that a large proportion of arable land in Kyarumba is now dedicated to coffee cultivation. This aligns with national trends reported by the Uganda Coffee Development Authority (UCDA, 2023a), which notes that Uganda currently has over 350,000 hectares under coffee production, producing about 8.6 million 60-kg bags annually. Similarly, Lominda, (2024) [30] , observed that coffee acreage in rural Uganda has expanded rapidly due to growing market demand and government-led promotion of coffee as a key export commodity. The dominance of smallholder farms (1-3 acres) is consistent with reports by Poncet et al., (2024 [43] , which highlight that over 1.7 million households in Uganda depend on coffee farming for their livelihoods. In areas like the Rwenzori region, where Kyarumba is located, farmers have increasingly converted natural vegetation and marginal lands into coffee plots due to the crop's economic benefits. However, the rapid expansion of coffee acreage has contributed to noticeable land cover change and environmental pressure. Twongyirwe and Ndisiima, (2018) [35] link such expansion to deforestation, soil degradation and biodiversity loss in western Uganda. As global demand for sustainable coffee increases under frameworks like the EU Deforestation Regulation (EUDR), maintaining a balance between production and environmental conservation becomes crucial (Berning & Sotirov, 2024) [11] . According to the data collected, 66.7% of respondents agreed that forest cover has declined over the years, while 21.2% disagreed. Similarly, 63.6% believed that most deforestation happened between 2000 and 2020. When it comes to forest conservation, 48.5% disagreed that forest cover has been maintained, while 27.3% think it had increased. More than half (61.2%) of the respondents confirmed that coffee is now being grown on previously forested land, though 30.3% disagreed. Lastly, 60.6% of the respondents believed that coffee farming has contributed to deforestation, whereas 27.3% did not share this view. Accuracy Assessment for 2010 Accuracy Assessment for 2020 The analysis of land use and land cover (LULC) changes in Kyarumba Sub-County reveals a dramatic transformation of the landscape over two decades, characterized by significant forest loss, agricultural expansion, and land degradation. Forest cover decreased from 45.5% of the total area in 2000 to just 23.5% in 2020, representing a 36% reduction in actual forest area (25 ha to 16 ha). This decline aligns with global trends in tropical deforestation, where agricultural expansion and settlement growth are primary drivers (Austin et al., 2017) [6] . The concurrent 90% increase in agricultural land (from 10 ha to 19 ha) suggests that forest conversion for cropland, including coffee farming, is a key factor. Such trends are consistent with studies in other coffee-producing regions of East Africa, where economic pressures and population growth have accelerated deforestation (Della Peruta et al., 2025) [19] . The doubling of Bare land (from 5 ha to 10 ha) further underscores the ecological consequences of unsustainable land use, including soil erosion and reduced biodiversity (Nut et al., 2021) [38] . The overall classification accuracy decreased from a high of 92.7% in 2000 to 79.4% in 2020. This decline suggests that as land cover patterns become more complex and fragmented, it becomes more challenging to distinguish between different classes, impacting the precision of the analysis over time. The implications of these changes are profound, both environmentally and socio-economically. The rapid loss of forest cover threatens ecosystem services such as carbon sequestration, water regulation, and habitat provision, which are critical for climate resilience and rural livelihoods (Hallaj et al., 2024) [27] . The expansion of agriculture, while economically beneficial in the short term, may undermine long-term sustainability if it relies on deforestation, as this could conflict with international regulations like the European Union Deforestation Regulation (EUDR). The rise in Bare land signals land degradation, which could reduce agricultural productivity and exacerbate poverty among smallholder farmers (Barbier & Hochard, 2018) [10] . These findings echo research in Uganda's Rwenzori region, where similar LULC shifts have been linked to climate vulnerability and food insecurity (Nkuba et al., 2021)C [37] . From a policy perspective, these results highlight the urgent need for integrated land management strategies. Promoting agroforestry systems that combine coffee production with tree cover could mitigate deforestation while ensuring compliance with the EUDR (Gallemore et al., 2025) [24] . Additionally, restoring degraded areas and enforcing land-use planning regulations are critical to reversing Bare land expansion. Community-based forest management programs, such as those implemented in neighboring Tanzania, have shown promise in balancing conservation and development goals (Gayo, 2025) [25] . However, success will depend on addressing underlying drivers, including population pressure and limited alternative livelihoods. The declining accuracy of LULC classifications over time (from 92.7% in 2000 to 79.4% in 2020) further underscores the growing complexity of land cover patterns, necessitating advanced remote sensing techniques and ground-truthing for future monitoring (Ahmad et al., 2022) [1] . The findings of the study reveal a compelling and complex picture of land cover change in Kyarumba Sub-County between 2000 and 2020, with a strong connection to the expansion of coffee farming. While the qualitative data from farmer interviews and surveys reflect community perceptions and lived experiences, the GIS-based analysis offers a quantitative dimension that reinforces and deepens this understanding. One of the most outstanding findings from the GIS analysis is the substantial decline in natural forest cover by 25%, from 18,000 hectares in 2000 to just 13,500 hectares in 2020. These losses are reflected in the declining accuracy of classification results in the later years of analysis, suggesting increased fragmentation and degradation of the landscape. This is not just a matter of land use, but also of ecological importance as forest loss is a key indicator of declining biodiversity, reduced carbon storage and weakening ecosystem services. The local voices echo these figures. Many respondents noted that forest density has reduced significantly over the years, with 66.7% agreeing that forests are no longer as intact as they once were. One male coffee farmer shared: "...We used to have big trees all around, but now, they are fewer." This real-world observation closely aligns with the data captured in satellite imagery and GIS analysis and affirms that forest degradation is both visible on the ground and measurable from space.
| Acreage of land under coffee | Frequency (n = 120)* | Proportion (%) | χ² | P-value |
|---|---|---|---|---|
| Less than 1 acre | 35 | 29.2 | 18.24 | <0.001 |
| 1-3 acres | 52 | 43.3 | ||
| 4-6 acres | 20 | 16.7 | ||
| Above 6 acres | 13 | 10.8 | ||
| Total | 120 | 100 |
Table text extracted from the original PDF; superscript letters are shown inline. The original table image is below.
View original table image
Socio-demographic characteristics of respondents
Socio-demographic characteristics of respondents
Analysis of the study objectives 4.2 Land under coffee production in Kyarumba Sub-County
Analysis of the study objectives 4.2 Land under coffee production in Kyarumba Sub-County
Land cover change in Kyarumba (2000-2020)
The study also confirms a 15% increase in agricultural land, mostly occurring between 2000 and 2010, with coffee farming being a major driver of this expansion. This finding matches the perception among 54.5% of respondents who said coffee is now being grown on land that was once forested. The economic motivation behind this trend is clear. One female coffee farmer explained: "...If you don't grow coffee, you won't have money," Such trends are also observed globally. As Barbier, (2014) [9] noted, in developing countries where land is the main source of wealth, forest-to-farm conversion is often inevitable. This study finding also aligns that of with that of De Oliveira et al., (2022) [23] in Brazil where they found out a massive forest loss has occurred in coffee-growing regions like the Amazon and Cerrado. Uganda appears to be following a similar path, albeit on a smaller scale.
Beyond forests and farmland, other land cover classes have also changed. Grassland areas experienced modest declines, suggesting continued pressure on natural vegetation. Settlement areas increased by 10%, driven by population growth and the spread of infrastructure. This further intensifies the demand for land and natural resources, complicating conservation efforts.The accuracy of land classification using GIS techniques also declined significantly from 92.7% in 2000 to 79.4% in 2020. This reflects the increasing complexity and fragmentation of the landscape, making it more difficult to distinguish between land cover types. The overlap between forest, agriculture, and Bare land areas highlight how dynamic and interlinked these land cover changes are. The confusion between classes is not just a technical challenge but a reflection of real transitions happening on the ground. These findings directly relate to global concerns, particularly the European Union Deforestation Regulation (EUDR), which aims to stop the import of products linked to deforestation (Capuzzi, 2023) [15] . As Uganda targets 20 million bags of coffee by 2030 (UCDA, 2023b) land pressures will only increase unless more sustainable approaches are adopted. Yet only a small fraction of Uganda's coffee is currently produced under sustainability schemes 5% for Arabica and 1.2% for Robusta (Atukunda, 2025) [5] . Farmers recognize the problem, but they also feel trapped.
One of the key informants noted: "We need coffee to feed our families, but we also see how it is affecting the land... I wish we would have an alternative, but where is it?!" This highlights the tension between environmental sustainability and economic survival. While some companies like Kyagalanyi, Kawacom and Ugacof are supporting sustainable production, adoption remains low.
As one the male coffee farmer expressed; "If we had support, we would plant trees and grow coffee in a better way." Globally, consumers are shifting towards sustainable coffee, as Bager & Lambin, (2020) [8] observed. But for producers in Kyarumba, the lack of access to certification, training and financial support makes it difficult to meet these expectations. Without stronger government and stakeholder involvement, Uganda risks falling behind in complying with international sustainability requirements like the EUDR. echoing findings from Latin America where certification benefits often fail to reach smallholders uniformly (Oya et al., 2017) [41] . The emphasis on organic coffee farming (57.6% recognition) reflects a growing shift toward agro ecological practices, which reduce chemical inputs while enhancing soil health and market access (Martinez et al., 2024) [32] . This transition is critical for environmental protection, as organic systems typically maintain higher tree cover and lower deforestation risks (Cesar De Oliveira et al., 2024) [17] . Yet, the 21.2% neutral responses indicate persistent knowledge gaps, mirroring challenges observed in Ethiopia where organic adoption was hindered by limited technical support (Boru et al., 2025) [12] . Similarly, Fair Trade recognition (54.5% agreement) signals progress toward equitable trade, though the 24.2% uncertainty underscores the need for better awareness campaigns, as noted in Ugandan studies where farmer participation in certification schemes remained low due to misinformation. The optimism regarding environmental protection (60.6% agreement) suggests stakeholders perceive existing initiatives as foundational for meeting regulatory demands to protect the environment even when carrying out coffee production. This aligns with research advocating for certification programs as steppingstones to deforestationfree supply chains (Lambin et al., 2018) [29] . However, the 18.2% uncertainty and 21.2% combined disagreement highlight systemic barriers, such as high compliance costs or inadequate infrastructure-a recurring theme in studies of Global South producers (Andreoni et al., 2021) [3] . For instance, Colombian coffee farmers faced similar hurdles when adapting to EU sustainability standards, requiring targeted subsidies and training (Rubio-Jovel, 2024) [46] .
Existing Initiatives for Environmental Protection
Existing Initiatives for Environmental Protection
Conclusions
Based on the findings, the study concludes that coffee farming occupies a large proportion of arable land in Kyarumba Sub-County and continues to expand as farmers pursue better income opportunities. However, this expansion has led to conversion of forest and grassland into coffee plantations, causing deforestation, loss of biodiversity, and increased soil erosion. Land cover analysis confirms that Kyarumba has undergone rapid environmental changes from 2000 to 2020, with forested areas giving way to coffee fields and settlements. This pattern highlights the urgent need to balance agricultural growth with environmental conservation to ensure long-term sustainability.
The study further concludes that although there are ongoing environmental protection initiatives including agroforestry practices, organic farming promotion, Rainforest Alliance programs and conservation awareness campaigns their reach and impact remain limited. Many farmers remain unaware of international sustainability requirements, particularly the European Union Deforestation Regulation (EUDR), which poses a potential risk to Uganda's coffee exports if compliance measures are not urgently strengthened.
Figures and tables from the paper
| Variable | Frequency (n = 165) | Proportion (%) | X2 | p-value |
|---|---|---|---|---|
| Gender | ||||
| Male | 95 | 57.6 | 3.79 | 0.052 |
| Female | 70 | 42.4 | ||
| Age group | ||||
| 18-28 | 40 | 24.2 | 20.00 | <0.001 |
| 29-38 | 50 | 30.3 | ||
| 39-48 | 35 | 21.2 | ||
| 49-58 | 25 | 15.2 | ||
| 59 and above | 15 | 9.1 | ||
| Engagement in coffee production | ||||
| Yes | 120 | 72.7 | 33.55 | <0.001 |
| No | 45 | 27.3 | ||
| Years in coffee production | ||||
| 1-5 years | 63 | 52.5 | 25.68 | <0.001 |
| 6-10 years | 38 | 31.7 | ||
| Over 10 years | 19 | 15.8 | ||
| Awareness of the EUDR | ||||
| Yes | 27 | 16.4 | 75.44 | <0.001 |
| No | 138 | 83.6 |
Table text extracted from the original PDF; superscript letters are shown inline. The original table image is below.
View original table image
| Statement | Strongly agree | Agree | Not sure | Disagree | Strongly disagree |
|---|---|---|---|---|---|
| Reduction in forest cover | 60 (36.4%) | 50 (30.3%) | 20 (12.1%) | 20 (12.1%) | 15 (9.1%) |
| Most deforestation occurred 2000-2020 | 55 (33.3%) | 50 (30.3%) | 30 (18.2%) | 15 (9.1%) | 15 (9.1%) |
| Forest cover has been maintained or increased | 20 (12.1%) | 25 (15.2%) | 40 (24.2%) | 45 (27.3%) | 35 (21.2%) |
| Coffee grown in previously forested land | 55 (33.3%) | 46 (27.9%) | 14 (8.5%) | 30 (18.2%) | 20 (12.1%) |
| Coffee farming reduced tree cover | 55 (33.3%) | 45 (27.3%) | 20 (12.1%) | 25 (15.2%) | 20 (12.1%) |
Table text extracted from the original PDF; superscript letters are shown inline. The original table image is below.
View original table image
| Classified Class | Reference Class | — | — | — | — | — |
|---|---|---|---|---|---|---|
| Forest | Agriculture | Grassland | Settlement | Bare land | Total | |
| Forest | 23 | 1 | 0 | 0 | 1 | 25 |
| Agriculture | 0 | 9 | 1 | 0 | 0 | 10 |
| Grassland | 0 | 0 | 7 | 0 | 1 | 8 |
| Settlement | 0 | 0 | 0 | 7 | 0 | 7 |
| Bare land | 0 | 0 | 0 | 0 | 5 | 5 |
| Total | 23 | 10 | 8 | 7 | 7 | 55 |
Table text extracted from the original PDF; superscript letters are shown inline. The original table image is below.
View original table image
| Class | Kappa (κ) | Agreement level |
|---|---|---|
| Forest | 0.86 | Substantial |
| Agriculture | 0.88 | Almost perfect |
| Grassland | 0.85 | Almost perfect |
| Settlement | 1.00 | Perfect |
| Bare land | 1.00 | Perfect |
Table text extracted from the original PDF; superscript letters are shown inline. The original table image is below.
View original table image
| Class | Kappa (κ) | Agreement level |
|---|---|---|
| Forest | 0.71 | Substantial |
| Agriculture | 0.69 | Substantial |
| Grassland | 0.56 | Moderate |
| Settlement | 0.89 | Almost perfect |
| Bare land | 1.00 | Perfect |
Table text extracted from the original PDF; superscript letters are shown inline. The original table image is below.
View original table image
| Classified Class | Reference Class | — | — | — | — | — |
|---|---|---|---|---|---|---|
| Forest | Agriculture | Grassland | Settlement | Bare land | Total | |
| Forest | 18 | 2 | 1 | 0 | 1 | 22 |
| Agriculture | 0 | 11 | 1 | 0 | 1 | 13 |
| Grassland | 1 | 1 | 8 | 0 | 1 | 11 |
| Settlement | 0 | 0 | 0 | 9 | 0 | 9 |
| Bare land | 0 | 0 | 1 | 0 | 6 | 7 |
| Total | 19 | 14 | 11 | 9 | 9 | 62 |
Table text extracted from the original PDF; superscript letters are shown inline. The original table image is below.
View original table image
| Class | Kappa (κ) | Agreement level |
|---|---|---|
| Forest | 0.74 | Substantial |
| Agriculture | 0.80 | Almost perfect |
| Grassland | 0.67 | Substantial |
| Settlement | 1.00 | Perfect |
| Bare land | 0.83 | Almost perfect |
Table text extracted from the original PDF; superscript letters are shown inline. The original table image is below.
View original table image
| Classified Class | Reference Class | — | — | — | — | — |
|---|---|---|---|---|---|---|
| Forest | Agriculture | Grassland | Settlement | Bare land | Total | |
| Forest | 14 | 2 | 1 | 0 | 1 | 18 |
| Agriculture | 1 | 14 | 2 | 0 | 1 | 18 |
| Grassland | 1 | 3 | 9 | 0 | 1 | 14 |
| Settlement | 0 | 0 | 1 | 10 | 0 | 11 |
| Bare land | 0 | 0 | 0 | 0 | 7 | 7 |
| Total | 16 | 19 | 13 | 10 | 10 | 68 |
Table text extracted from the original PDF; superscript letters are shown inline. The original table image is below.
View original table image
| Statement | Strongly agree | Agree | Not sure | Disagree | Strongly disagree |
|---|---|---|---|---|---|
| Stakeholders promote sustainable coffee | 55 (33.3%) | 60 (36.4%) | 20 (12.1%) | 20 (12.1%) | 10 (6.1%) |
| Rainforest alliance initiatives exist | 50 (30.3%) | 50 (30.3%) | 30 (18.2%) | 20 (12.1%) | 15 (9.1%) |
| Organic coffee farming promoted | 45 (27.3%) | 50 (30.3%) | 35 (21.2%) | 20 (12.1%) | 15 (9.1%) |
| Fair trade recognition | 40 (24.2%) | 50 (30.3%) | 40 (24.2%) | 20 (12.1%) | 15 (9.1%) |
| Existing initiatives will improve environmental protection | 55 (33.3%) | 45 (27.3%) | 30 (18.2%) | 20 (12.1%) | 15 (9.1%) |
Table text extracted from the original PDF; superscript letters are shown inline. The original table image is below.
View original table image
References
50 in the original paper- Ahmad MN, Shao Z, Javed A. Modelling land use/land cover (LULC) change dynamics, future prospects, and its environmental impacts based on geospatial data models and remote sensing data. Environmental Science and Pollution Research. 2022;30(12):3298533001.
- An Z, Yang Y, Yang X, Ma W, Jiang W, Li Y, et al. Promoting sustainable smallholder farming via multistakeholder collaboration. Proceedings of the National Academy of Sciences. 2024;121(21):e2319519121.
- Andreoni A, Mondliwa P, Roberts S, Tregenna F, editors. Structural Transformation in South Africa: The Challenges of Inclusive Industrial Development in a Middle-Income Country. 1st ed. Oxford: Oxford University Press; 2021.
- Aslihan A, Eva-Maria E, Paul CW. Migration, Demography, and Agri-Food Systems. 2018.
- Atukunda R. Uganda Claims Top Spot as Africa's Leading Coffee Exporter. SoftPower News. 2025 Jun 26.
- Austin KG, González-Roglich M, Schaffer-Smith D, Schwantes AM, Swenson JJ. Trends in size of tropical deforestation events signal increasing dominance of industrial-scale drivers. Environmental Research Letters. 2017;12(5):054009.
- Avinç E, Doğan F. Digital literacy scale: Validity and reliability study with the rasch model. Education and Information Technologies. 2024;29(17):22895-22941.
- Bager SL, Lambin EF. Sustainability strategies by companies in the global coffee sector. Business Strategy and the Environment. 2020;29(8):3555-3570.
- Barbier EB. Economics: Account for depreciation of natural capital. Nature. 2014;515(7525):32-33.
- Barbier EB, Hochard JP. Land degradation and poverty. Nature Sustainability. 2018;1(11):623-631.
- Berning L, Sotirov M. The coalitional politics of the European Union Regulation on deforestation-free products. Forest Policy and Economics. 2024;158:103102.
- Boru EM, Hwang J, Ahmad AY. Understanding the Drivers of Agricultural Innovation in Ethiopia's Integrated Agro-Industrial Parks: A Structural Equation Modeling and Qualitative Insights Approach. Agriculture. 2025;15(4):355.
- Braun V, Clarke V. Reflecting on reflexive thematic analysis. Qualitative Research in Sport, Exercise and Health. 2019;11(4):589-597.
- Bwalya B, Mutandwa E, Chiluba BC. Awareness and Use of Sustainable Land Management Practices in Smallholder Farming Systems. Sustainability. 2023;15(20):14660.
- Capuzzi B. Is the European Union Deforestation Regulation WTO-Proof? The Context of EU's Green Agenda and an Exercise of WTO Compatibility. SSRN Electronic Journal. 2023.
- CBI C. Potential for climate-smart coffee from Uganda. 2024 Jul.
- Cesar De Oliveira SEM, Nakagawa L, Lopes GR, Visentin JC, Couto M, Silva DE, et al. The European Union and United Kingdom's deforestation-free supply chains regulations: Implications for Brazil. Ecological Economics. 2024;217:108053.
- De Oliveira ML, Dos Santos CAC, De Oliveira G, Silva MT, Da Silva BB, Cunha JEDBL, et al. Remote sensing-based assessment of land degradation and drought impacts over terrestrial ecosystems in Northeastern Brazil. Science of The Total Environment. 2022;835:155490.
- Della Peruta R, Mereu V, Spano D, Marras S, Vezy R, Trabucco A. Projecting trends of arabica coffee yield under climate change: A process-based modelling study at continental scale. Agricultural Systems. 2025;227:104353.
- Escobar N, Tizado EJ, Zu Ermgassen EKHJ, Löfgren P, Börner J, Godar J. Spatially-explicit footprints of agricultural commodities: Mapping carbon emissions embodied in Brazil's soy exports. Global Environmental Change. 2020;62:102067.
- European Commission EC. Deforestation Regulation implementation-European Commission. 2023.
- FAO F. Country Gender Assessment of the agriculture and rural sector -The Republic of the Sudan. 2021.
- Fernandes Martins K, Teixeira D, De Oliveira Corrêa R. Gains in sustainability using Voluntary Sustainability Standards: A systematic review. Cleaner Logistics and Supply Chain. 2022;5:100084.
- Gallemore C, Berecha G, Eneyew A, Grabs J, Jespersen K, Kasongi N'gwinamila, et al. Avoiding Access Inequity Due to classification errors in zerodeforestation value chains: Coffee and the European union deforestation regulation. Land Use Policy. 2025;157:107609.
- Gayo L. Community-based conserved areas in advancing sustainable development and conservation in Sub-Saharan Africa. Discover Conservation. 2025;2(1):27.
- Gunathilaka MDKL, Fernando SLJ. Accuracy Assessment of Unsupervised Land Use and Land Cover Classification Using Remote Sensing and Geographical Information Systems. International Journal of Environment, Engineering and Education. 2022;4(3):76-82.
- Hallaj Z, Bijani M, Karamidehkordi E, Yousefpour R, Yousefzadeh H. Forest land use change effects on biodiversity ecosystem services and human well-being: A systematic analysis. Environmental and Sustainability Indicators. 2024;23:100445.
- IACO I. 2 ND EDITION OF THE G25 AFRICA COFFEE SUMMIT KAMPALA DECLARATION. 2023.
- Lambin EF, Gibbs HK, Heilmayr R, Carlson KM, Fleck LC, Garrett RD, et al. The role of supply-chain initiatives in reducing deforestation. Nature Climate Change. 2018;8(2):109-116.
- Lominda A. Northern Uganda turns to coffee for economic revival. Monitor. 2024 May 17.
- Macdonald K. Private sustainability standards as tools for empowering southern pro-regulatory coalitions? Collaboration, conflict and the pursuit of sustainable palm oil. Ecological Economics. 2020;167:106439.
- Martinez HEP, Andrade SALD, Santos RHS, Baptistella JLC, Mazzafera P. Agronomic practices toward coffee sustainability. A review. Scientia Agricola. 2024;81:e20220277.
- Mozersky J, Parsons M, Walsh H, Baldwin K, McIntosh T, DuBois JM. Research Participant Views regarding Qualitative Data Sharing. Ethics & Human Research. 2020;42(2):13-27.
- Mubiru DN, Radeny M, Kyazze FB, Zziwa A, Lwasa J, Kinyangi J, et al. Climate trends, risks and coping strategies in smallholder farming systems in Uganda. Climate Risk Management. 2018;22:4-21.
- Ndisiima A. Natural calamities and wildlife populations in the selected conservation areas of Western Uganda [dissertation]. Kampala: Kampala International University; 2018.
- Negi A, Pérez-Pineda JA, Blankenbach J, editors. Sustainability Standards and Global Governance: Experiences of Emerging Economies. Singapore: Springer Singapore; 2020.
- Nkuba MR, Chanda R, Mmopelwa G, Adedoyin A, Mangheni MN, Lesolle D, et al. Indigenous and Scientific Forecasts on Climate Change Perceptions of Arable Farmers: Rwenzori Region, Western Uganda. In: Oguge N, Ayal D, Adeleke L, Da Silva I, editors. African Handbook of Climate Change Adaptation. Cham: Springer International Publishing; 2021. p. 1685-1703.
- Nut N, Mihara M, Jeong J, Ngo B, Sigua G, Prasad PVV, et al. Land Use and Land Cover Changes and Its Impact on Soil Erosion in Stung Sangkae Catchment of Cambodia. Sustainability. 2021;13(16):9276.
- Ole H. Coffee, one of the world's most traded commodities, surges to a 47-year high. 2024 Nov 28.
- Oluwatosin Yetunde Abdul-Azeez, Uloma Stella Nwabekee, Edith Ebele Agu, Tochukwu Ignatius Ijomah. Strategic approaches to sustainability in multinational corporations: A comprehensive review. International Journal of Frontline Research in Science and Technology. 2024;3(2):038-054.
- Oya C, Schaefer F, Skalidou D, McCosker C, Langer L. Effects of certification schemes for agricultural production on socio-economic outcomes in low-and middle-income countries: A systematic review. Campbell Systematic Reviews. 2017;13(1):1-346.
- Polizel SP, Vieira RMDSP, Pompeu J, Ferreira YDC, Sousa-Neto ERD, Barbosa AA, et al. Analysing the dynamics of land use in the context of current conservation policies and land tenure in the Cerrado - MATOPIBA region (Brazil). Land Use Policy. 2021;109:105713.
- Poncet V, Van Asten P, Millet CP, Vaast P, Allinne C. Which diversification trajectories make coffee farming more sustainable? Current Opinion in Environmental Sustainability. 2024;68:101432.
- Rathi T, Ronald DB. Questionnaire as a Tool of Data Collection in Empirical Research. Journal of Positive School Psychology. 2022:7697-7699.
- RFA R. EUDR Archives. Rainforest Alliance. 2025.
- Rubio-Jovel K. Coffee production networks in Costa Rica and Colombia: A systems analysis on voluntary sustainability standards and impacts at the local level. Journal of Cleaner Production. 2024;445:141196.
- Sachs JD, Cordes K, Rising J, Toledano P, Maennling N. Ensuring Economic Viability and Sustainability of Coffee Production. SSRN Electronic Journal. 2019.
- Salmia S, Sudarmin. Development of quality instruments and data collection techniques. Jurnal Pendidikan Dan Pengajaran Guru Sekolah Dasar (JPPGuseda). 2023;6(1):119-124.
- Senyonyi TW. IACO State Members Officially Sign The Nairobi Declaration To Have Coffee Anchored As A Strategic Commodity Under AU. Business Focus. 2022 May 25.
- Sepúlveda WS, Chekmam L, Maza MT, Mancilla NO. Consumers' preference for the origin and quality attributes associated with production of specialty coffees: Results from a cross-cultural. 2016.