
Research article · 2025 · Full text
International Journal of Agriculture and Food ScienceUnderstanding Agricultural Volatility: An Analysis of Production Instability in India’s Major Cash Crops
Volume 7(11) · Pages 125–127 · DOI: 10.33545/2664844x.2025.v7.i11b.950 ↗
Research areasAgricultural Economics and PracticesClimate change impacts on agricultureMonetary Policy and Economic Impact
Abstract
Author-writtenThe study examines the patterns of instability in the area, production and yield of major cash crops in India. Secondary data from 1990-91 to 2023–24 are employed to study the instability in production for selected cash crops- cotton, jute, sugarcane, soybean, rapeseed-mustard and groundnut. Instability was analysed through the Cuddy–Della Valle (CDV) instability index. The CDV analysis showed that there was higher instability in production compared to area and yield. High variability in production was observed for cotton, groundnut, rapeseed & mustard and soyabean. These findings highlight the fragility of rain-fed cash crops to climatic and market variability. The study points out that policies that support climate-resilient technologies, expanding irrigation, and diversifying crops are important. It also highlights the significance of implementing effective measures to stabilize prices in order to ensure agricultural growth. A coordinated approach involving technological innovation, financial security, and region-specific interventions can ensure sustainable and stable agricultural growth.
Summary
Source-checkedPlain-language reading of the full paper, prepared with AI and checked against the text. Each point links to the authors' own words.
Why it matters
- Indian agriculture experiences significant annual variations in crop production, driven by factors including technology, climate, and policy changes. View evidence ↗
- Production instability increases farming risks and affects farmer incomes, which can discourage investments in high-paying technologies. View evidence ↗
- Analyzing production instability is critical for maintaining macro-economic stability and effective food management. View evidence ↗
The question
- The study aims to examine instability patterns regarding the yield, production, and area of major Indian cash crops. View evidence ↗
What they did
- The research used secondary data from 1990-91 to 2023–24 for six cash crops: groundnut, rapeseed-mustard, soybean, sugarcane, jute, and cotton. View evidence ↗
- The Cuddy–Della Valle (CDV) instability index was the primary tool used to analyze production instability. View evidence ↗
- The study measured area in million hectares, production in million tonnes, and yield in kilograms per hectare. View evidence ↗
What they found
- Overall, production exhibited higher instability than either yield or cultivated area. View evidence ↗
- Cotton showed very high instability in production (20.46%) and yield (18.29%), while area instability was moderate at 8.09%. View evidence ↗
- Jute was relatively stable, recording the lowest yield instability (3.26%) of all studied crops, with moderate area (7.74%) and production (8.71%) instability. View evidence ↗
- Sugarcane showed low instability in area (7.41%) and yield (6.15%), and moderate instability in production (10.13%). View evidence ↗
- Soybean had the highest area instability (11.16%) among the crops and high production instability (17.70%), but low yield instability (6.07%). View evidence ↗
- Rapeseed and mustard showed high instability in both area (14.23%) and production (18.37%), with moderate yield instability (9.02%). View evidence ↗
- Groundnut exhibited very high instability in production (20.60%) and yield (18.43%), while area instability was moderate (8.27%). View evidence ↗
What it means
- The authors recommend strengthening climate resilience by improving weather forecasting, enhancing irrigation, and adopting flood- and drought-tolerant crop varieties. View evidence ↗
- The authors conclude that future agricultural growth in India must rely on productivity improvements rather than simply expanding cultivated land. View evidence ↗
Visual summary
2 visualsIllustrations explain the paper; charts are replotted from the paper's own table values.
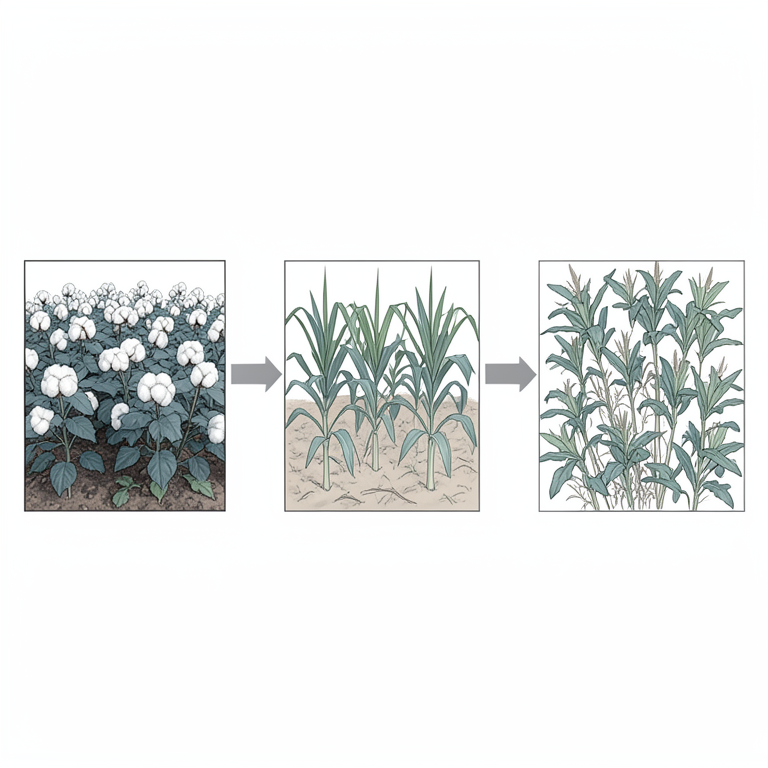
Production vs Area/Yield Instability
AI-generated conceptual illustration (Indian cash crops (cotton, sugarcane, and tobacco plants)). It explains the idea and does not show study data.
View source evidence ↗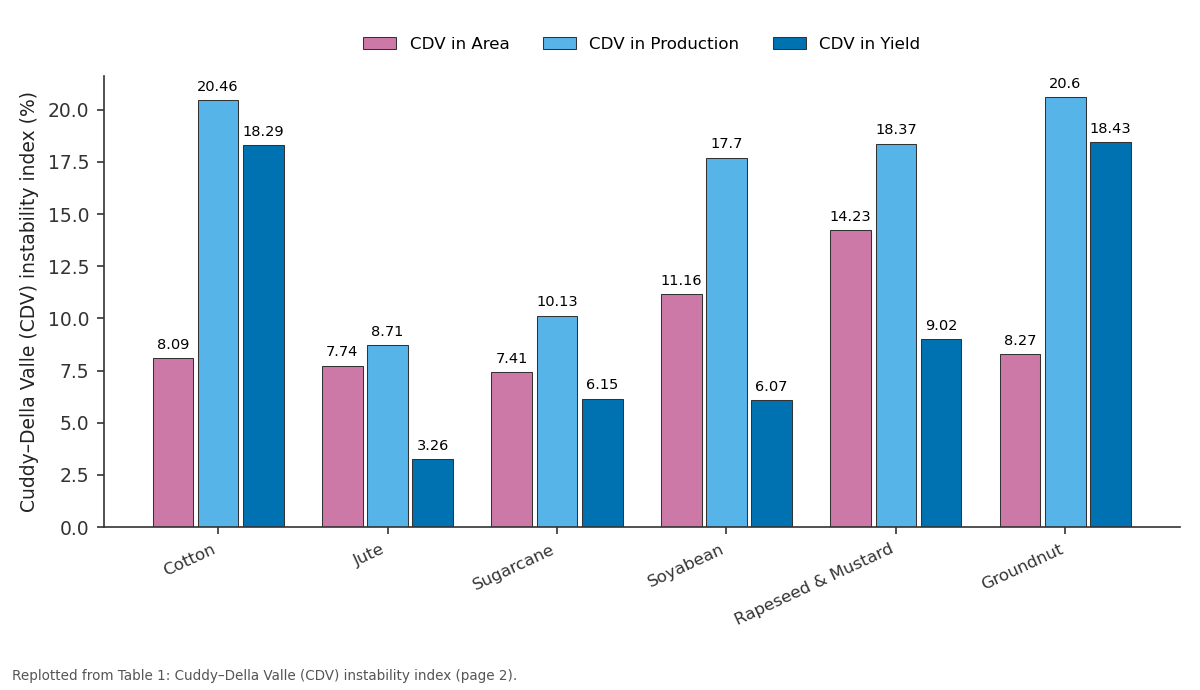
CDV in Area and CDV in Production and more: Cotton vs Jute vs Sugarcane vs Soyabean vs Rapeseed & Mustard
Replotted from Table 1 (page 2) of the original paper. Every bar is the paper's own table value.
View source evidence ↗Figures & tables
From the original paper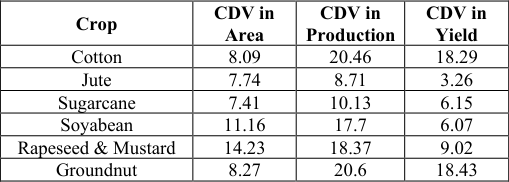 Table 1
Introduction
Indian agriculture is prone to large year-to-year variations in production of crops. This variability is influenced by several factors such as changes in policy, climatic conditions and technology. The introduction of Green Revolution technology has resulted in self-sufficiency in foodgrains production in the country. Fluctuations in agricultural production can make farming risky and impact income of farmers. It can also influence whether farmers decide to use high paying technology and invest in their farms. Instability in production can cause prices to fluctuate and influence the market behaviour of customers. Understanding the instability in agricultural and food production is also important for food management and macro-economic stability. Important cash crops like cotton, jute, sugarcane, soybean, rapeseed-mustard and groundnut have historically shaped and transformed agricultural growth in India since the Green Revolution period. Green revolution has played a significant role in boosting foodgrain and crop production in India. However, this increase has led to greater fluctuations and unpredictability in yields (Larson et al., 2004) [8] . A study by Bairwa, Sharma, and Kumar (2012) [3] analysed the extent of instability in India's fruit crop production during the period 1992 to 2008. They found that citrus, grapes, papaya, and sapota experienced high growth rates in production. On the other hand, banana, papaya, litchi, apple, and sapota experienced higher instability in their production levels. Bera, Chakraborty, Nandi, and Sarkar (2011) [4] examined the growth and stability of food grain production in India and West Bengal between 1950 and 2006. Results indicated significant improvements in area, production, and productivity of foodgrains. Growth in food grain production in India doubled in the post green revolution period due to sharp improvements in productivity. West Bengal also experienced significant increases in production and productivity mainly due to the adoption of modern agricultural technologies. Even though both India and West Bengal saw more stability in production after the Green Revolution, there were more instability at national level. The increase in food grains production was mainly because of higher growth rate of production in cereals, while the production of pulses remained relatively stagnant.
Singh and Ranjan (1998) [10] examined the instability of major foodgrain crops in North Bihar. The instability analysis indicated that wheat, maize, and arhar crops consistently display lower instability over time. This stabilization in growth performance was largely seen as a result of the advancement of agricultural technologies. The effect of an advancement in new technologies did increase instability in the initial phase it eventually declined as the adoption of technologies matured with production practices. Anjum and Madhulika (2018) [2] assessed the instability of some major Indian crops by employing the Cuddy-Della Valle and Coppock instability indices across three subperiods: 1990-91 to 1999-2000, 2000-01 to 2009-10, and 2009-10 to 2016-17. The results showed striking differences in the growth and instability exhibited in area, production, and productivity, demonstrating the fluctuating and weather-sensitivity of Indian agriculture. Kumar et al. (2019) [7] analysed instability in the production of soyabean in India from 1997 to 2016. The analysis of instability showed relatively low variation in area as compared to production and yield. Their analysis revealed that the increase in output was primarily due to increase in area and negatively influenced by yield and interaction effects. The study also found that there was a strong and positive association between area and the amount of production of soyabean. Kumar et al. (2013) [6] studied the patterns of growth and instability in Indian agriculture at the district level, highlighting key factors driving productivity differences across regions. It found substantial variation in crop productivity both among districts and within states, underlining the need for region-specific strategies to promote sustainable and inclusive agricultural growth. Persistent instability in productivity was observed, with notable disparities across districts, suggesting the need for stronger stabilization initiatives such as agricultural insurance. Ahmad, N., Sinha, D., & Singh, K. M. (2018) [1] analysed the instability in sugarcane production in India during the period 2001 to 2016.The results of Cuddy-Della Valle index showed sugarcane area was stable in states such as Uttar Pradesh, Uttrakhand, and Gujarat. Meanwhile, the sugarcane yield was found stable in Uttar Pradesh, Uttrakhand, and Tamil Nadu. It is important to understand the instability in area, production and productivity of major cash crops so that policy can be designed to sustain agriculture and stabilize farmer income. Most of the studies have mainly focused on the early stages of the green revolution. Only a few studies have looked into the more recent years, when the green revolution became widespread and firmly established. Therefore, this study attempts to examine long-term variability in area, production and productivity of major cash crops in India.
Data Sources and Methodology
The study is based on secondary time-series data on area, production and productivity of major cash crops in India for the period 1990-91 to 2022-23. The major cash crops selected are cotton, jute, sugarcane, soybean, rapeseedmustard and groundnut. Area is expressed in million hectares, production in million tonnes, and yield in kilograms per hectare. Secondary data is collected from the Directorate of Economics and Statistics, Government of India. Cuddy-Della Valle Instability Index was used to analyse the instability in area, production and productivity of major cash crops. Soyabean shows the highest area instability (11.16%) among the major crops and high instability in production (17.70%), whereas yield instability remains comparatively low (6.07%). This pattern suggests that fluctuations in soyabean output are mainly area-induced, consistent with its expansion into new regions and sensitivity to monsoon variability. Rapeseed and mustard exhibit high instability in area (14.23%) and production (18.37%), accompanied by moderate instability in yield (9.02%). These results imply that both acreage shifts and productivity variations contribute significantly to output volatility, possibly reflecting changes in relative profitability, climatic conditions, and crop competition within oilseed rotations. Groundnut displays moderate instability in area (8.27%), but very high instability in production (20.60%) and yield (18.43%), mirroring the pattern observed for cotton. The high yield and production instability point to the crop's vulnerability to rainfall fluctuations and pest incidence, as large portions of groundnut cultivation are rainfed.
Results and Discussion
Results and Discussion
Instability in Area under cultivation, Production and Productivity
Instability in Area under cultivation, Production and Productivity
Conclusion and Policy Implications
This study examined the instability associated with area, production, and productivity of major cash crops in India namely cotton, jute, sugarcane, soyabean, rapeseed and mustard, and groundnut during the study period.
The results of the Cuddy-Della Valle (CDV) instability index revealed that, for most crops, production was more unstable than area or yield due to the impacts of climatic variations, volatility in market conditions and input uncertainties. Cotton and groundnut exhibited particularly high instability in production and yield and were most susceptible to variability in rainfall, pest attacks, and volatility in market dynamics. In contrast, jute and sugarcane showed the lowest level of instability owing to irrigated cultivation approaches and adaptation of regionally-based production systems. The results reveal that while India's cash-crop sector experienced significant advancement, there was still production and yield instability, especially in rainfed crops.
In order to improve stability among competing cash crops, we need a systematic and comprehensive plan that involves policies, infrastructure, and technology. It is very important to strengthen climate resilience through the adoption of drought and flood-tolerant varieties, enhancing irrigation systems, and improved weather forecasting systems. This will help farmers deal with the unpredictable weather conditions. In the future, India's agricultural growth will heavily depend on improvements in productivity rather than just increasing the land under cultivation. Efforts aimed to reduce fluctuations could also boost productivity, ensuring long-term agricultural sustainability and better income security for farmers.
Disclosure and conflicts of interest
The author declares that there are no conflicts of interest or financial disclosures related to this work.
Figures and tables from the paper
| Crop | CDV in Area | CDV in Production | CDV in Yield |
|---|---|---|---|
| Cotton | 8.09 | 20.46 | 18.29 |
| Jute | 7.74 | 8.71 | 3.26 |
| Sugarcane | 7.41 | 10.13 | 6.15 |
| Soyabean | 11.16 | 17.7 | 6.07 |
| Rapeseed & Mustard | 14.23 | 18.37 | 9.02 |
| Groundnut | 8.27 | 20.6 | 18.43 |
Table text extracted from the original PDF; superscript letters are shown inline. The original table image is below.
View original table image
References
10 in the original paper- Ahmad N, Sinha D, Singh KM. Economic analysis of growth, instability and resource use efficiency of sugarcane cultivation in India: an econometric approach. Indian Journal of Economics and Development. 2018;6(4):1-10.
- Anjum S, Madhulika. Growth and instability analysis in Indian agriculture. International Journal of Multidisciplinary Research and Development. 2018;5(11):119-125.
- Bairwa KC, Sharma R, Kumar T. Economics of growth and instability: fruit crops of India. Rajasthan Journal of Extension Education. 2012;20(1):128-132.
- Bera BK, Chakraborty AJ, Nandi AK, Sarkar A. Growth and instability of food grains production of India and West Bengal. Journal of Crop and Weed. 2011;7(1):94-100.
- Chand R, Raju SS, Garg S, Pandey LM. Instability and regional variation in Indian agriculture. Indian Journal of Agricultural Economics. 2011;66(3):345-356.
- Kumar A, Jain R. Growth and instability in agricultural productivity: a district level analysis. Agricultural Economics Research Review. 2013;26:31-42.
- Kumar S, Singh PK, Rathi D, Nahatkar SB, Choudhary VK, Parey SK. Growth and instability in area, production and productivity of soybean in India. International Journal of Science, Environment and Technology. 2019;8(2):278-288.
- Larson DW, Jones RS, Pannu RS, Sheokand RS. Instability in Indian agriculture: a challenge to the green revolution technology. Food Policy. 2004;29(3):257273.
- Ministry of Agriculture and Farmers' Welfare, Government of India. Agricultural statistics at a glance. New Delhi: Ministry of Agriculture and Farmers' Welfare; 2023.
- Singh RKP, Ranjan KP. Growth and instability in production of principal foodgrain crops: a case of backward economy. Bangladesh Journal of Agricultural Economics. 1998;21:1-20.
Cited by 1
From OpenAlex, OpenCitations and reference lists read by Scinovex
- Structural change in input use instability and farm profitability in cotton and sugarcane in India ↗
Amit Mandal · Discover Agriculture · 2026
Rising cultivation costs and fluctuating farm incomes have intensified concerns regarding the economic viability of commercial crop cultivation in India. Against this backdrop, the present study examines the trends, instability, and profitability of cotton and sugarcane cultivation, and identifies the major cost components influencing value of output (VoP) across selected major producing states during 1996–97 to 2021–22. The analysis employs…
❝ 0PDF