
Research article · 2025 · Full text
International Journal of Agriculture and NutritionTowards nutrition security among children and their primary caretakers through livelihood education programs in rural Uganda
Volume 7(11) · Pages 01–21 · DOI: 10.33545/26646064.2025.v7.i11a.308 ↗
Research areasChild Nutrition and Water AccessFood Security and Health in Diverse PopulationsPoverty, Education, and Child Welfare
Abstract
Author-writtenPromoting nutritional security is both an institutional and individual noble cause. The government of Uganda and several stakeholders have invested in nutritional health interventions. In 2003, a public-private partnership was established between Uganda and Iowa State University (ISU) of the United States. ISU, through its Center for Sustainable Rural Livelihood, has since invested in interrelated livelihood education programs (LEPs) to end hunger in Uganda. Nutrition programs are fostered through the community-based nutrition education centers (NECs) initiated in 2010 to manage malnutrition among children 0-59 months of age and their primary caretaker. This study assessed the impacts of NECs’ programs on nutrition security in Kamuli district. A comparative approach was employed to study the relationship between participants’ affiliation with NECs, participation in LEPs, as well as their household socioeconomic and reproductive characteristics, maternal practices, and nutrition security. The study was based on a survey of 454 households with 606 children. Anthropometric measurements were taken of primary caretakers and children. Caretakers’ nutritional health status was based on their Body Mass Index to determine the rates of underweight, overweight, or healthy statuses. Children’s anthropometric measurements were transformed into Z-scores using the WHO-Anthro software to assess the rates of undernutrition: stunting, underweight, or wasting. Respondents were categorized into three categories: program households who are 1) NEC clients and 2) non-NEC clients, and 3) non-program participants. Results showed that NEC clients and non-program participants were healthier nutritionally than non-NEC clients. However, NEC clients had more underweight caretakers than the two other groups. Incidents of underweight caretakers were strongly associated with low education and young age at first pregnancy. Related to participation in LEPs, the study found that participants in nutrition and infant feeding, public health, and complementary services, such as taking nutrient-dense/therapeutic porridge, were associated with nutritionally healthier caretakers than non-participants. Similarly, participants in agronomy, postharvest, and livestock programs were associated with fewer incidences of underweight and overweight caretakers than non-participants. On children’s health, there were more stunted (37.1%) than underweight (22.7%) or wasted (16.7%) children. Incidents of stunting and wasting affected more boys, whereas underweight affected more girls. Stunting and underweight increased with age and significantly affected the 24-35 and 36-47 age groups, respectively. More stunted (39.7%) and underweight (24.0%) children were found among non-program participants. Stunting and underweight children were strongly associated with underweight caretakers. Overall, 51.1% were healthy and 48.9% undernourished. Recommendations for improving the program include participatory planning involving community, cultural, and government partners in the design of activities, decision-making to strengthen implementation, monitoring, and evaluation of maternal practices. Collaboration with health workers and village health trainers to educate and encourage households to adopt improved maternity practices and monitor children.
Summary
Source-checkedPlain-language reading of the full paper, prepared with AI and checked against the text. Each point links to the authors' own words.
Why it matters
- Community-based nutrition education centers (NECs) were established in 2010 to address malnutrition in children aged 0-59 months and their primary caretakers. View evidence ↗
- Food insecurity remains a significant issue in Uganda, with 46% of the population reported as food insecure and the country ranked as 'serious' in hunger severity on the Global Hunger Index since 2019. View evidence ↗
The question
- The study aimed to evaluate the impact of Nutrition Education Centers (NECs) and Livelihood Education Programs (LEPs) on the nutritional health status of primary caretakers and children aged 0-59 months in rural Uganda. View evidence ↗
What they did
- The research surveyed 454 households, including 253 NEC clients and 201 non-NEC households, involving a total of 606 children aged 0-59 months. View evidence ↗
- Nutritional status was measured using Body Mass Index (BMI) for caretakers and WHO Anthro software Z-scores for children to identify stunting, underweight, and wasting. View evidence ↗
What they found
- Among primary caretakers, 70.7% were classified as healthy, 12.6% as underweight, and 16.7% as overweight based on BMI. View evidence ↗
- Among the children surveyed, stunting was the most prevalent form of undernutrition at 37.1%, followed by underweight (22.7%) and wasting (16.7%). View evidence ↗
- Childhood undernutrition varied by age, with stunting peaking at 42.1% in the 24-35 month cohort and underweight peaking at 32.4% in the 36-47 month cohort. View evidence ↗
- Children from households that did not participate in the programs had higher rates of stunting (39.7%) and underweight (24.0%) compared to other groups. View evidence ↗
- There is a significant association between maternal and child health: underweight mothers had higher rates of stunted children (44.6%) and underweight children (27.7%) than healthy or overweight mothers. View evidence ↗
- Overall, 48.9% of the children were malnourished in some form, while 51.1% were nutritionally healthy. View evidence ↗
- NEC clients had fewer years of formal education than other groups, which the authors suggest may contribute to higher rates of underweight among these caretakers. View evidence ↗
What it means
- The authors recommend increasing collaboration with health workers and village trainers to improve maternal practices and child monitoring. View evidence ↗
- To prevent relapses among children who have graduated from rehabilitation, the authors suggest coordinated monitoring involving the program, government trainers, local councils, and cultural leaders. View evidence ↗
- The authors note that distance to rehabilitation centers may have limited access for some households, indicating a need for program expansion. View evidence ↗
Visual summary
2 visualsIllustrations explain the paper; charts are replotted from the paper's own table values.
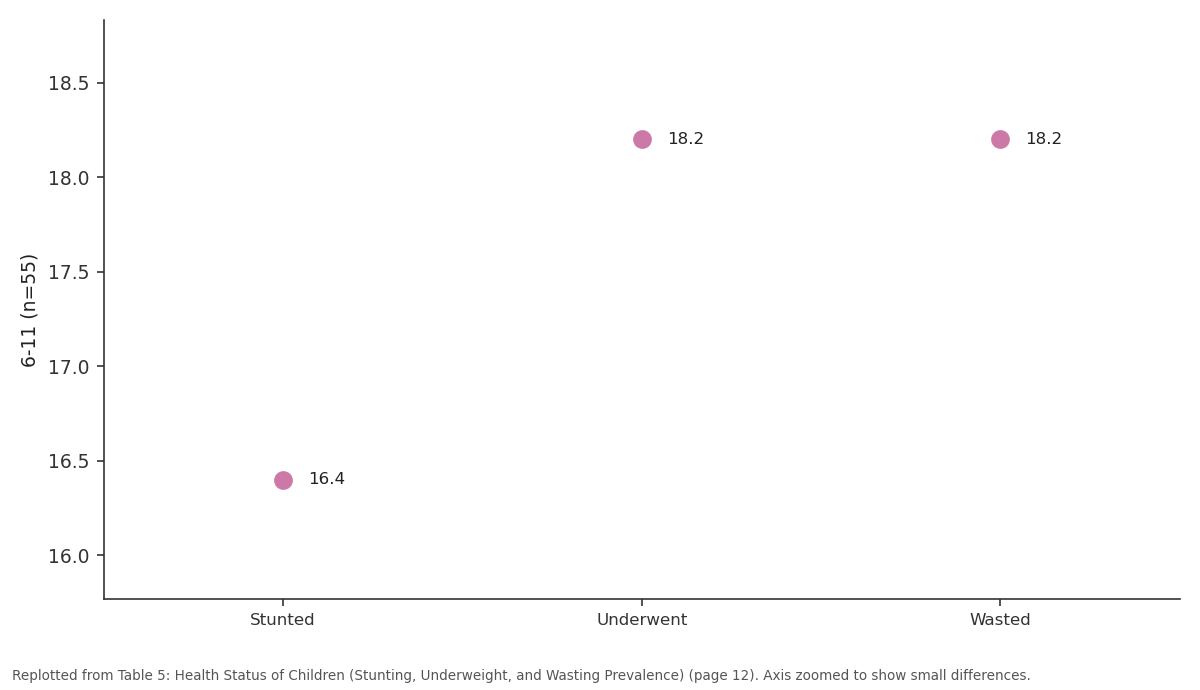
6-11 (n=55): Stunted vs Underwent vs Wasted
Replotted from Table 5 (page 12) of the original paper. Every bar is the paper's own table value.
View source evidence ↗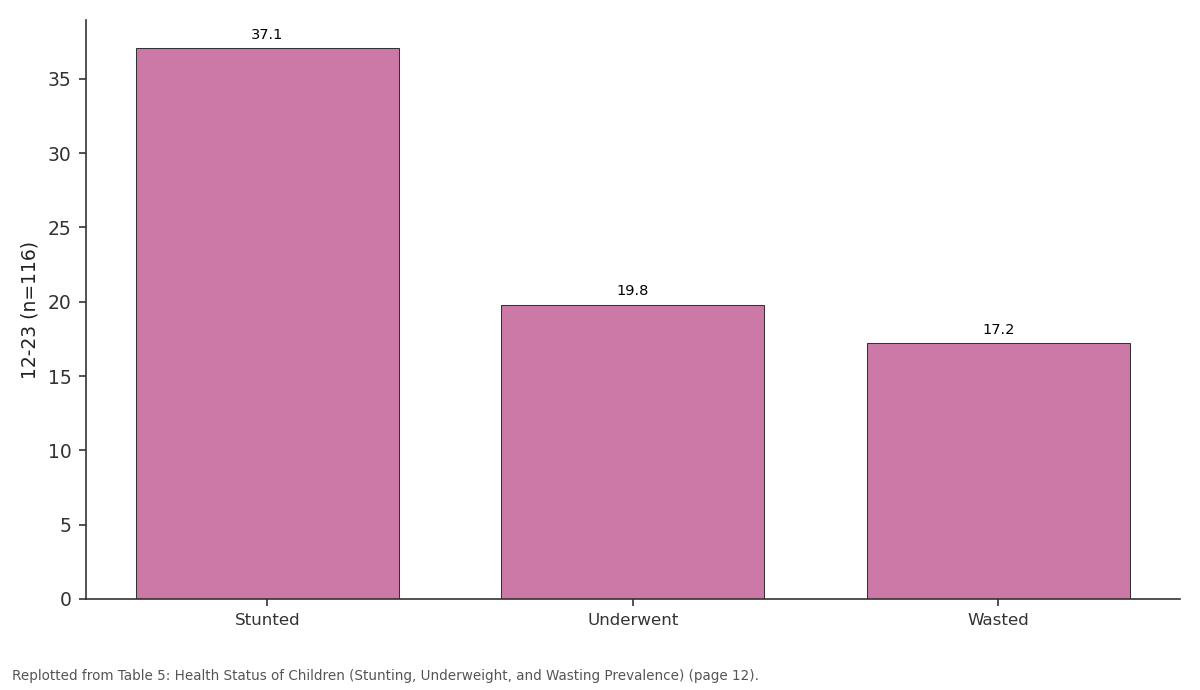
12-23 (n=116): Stunted vs Underwent vs Wasted
Replotted from Table 5 (page 12) of the original paper. Every bar is the paper's own table value.
View source evidence ↗Figures & tables
From the original paper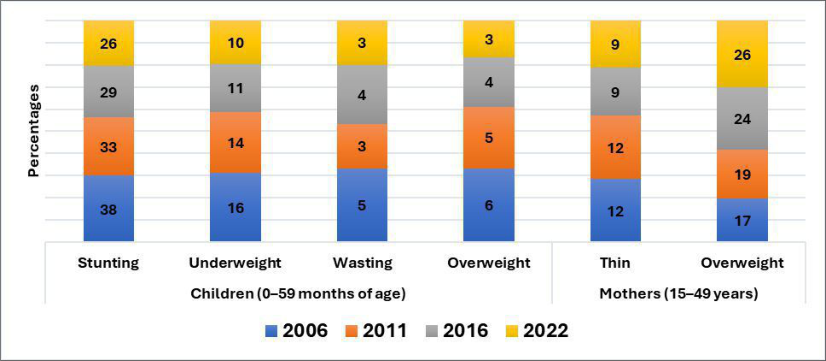 Figure 1
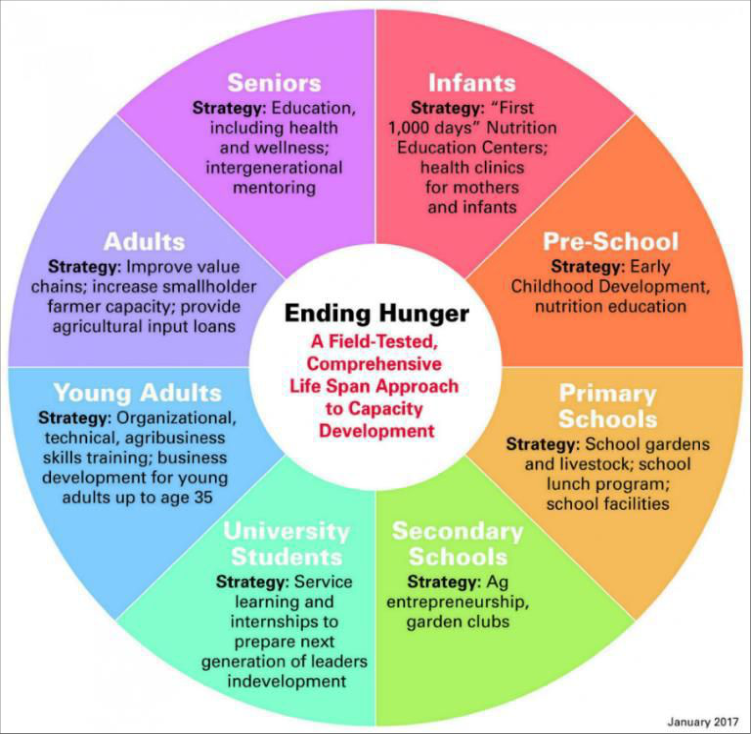 Figure 2
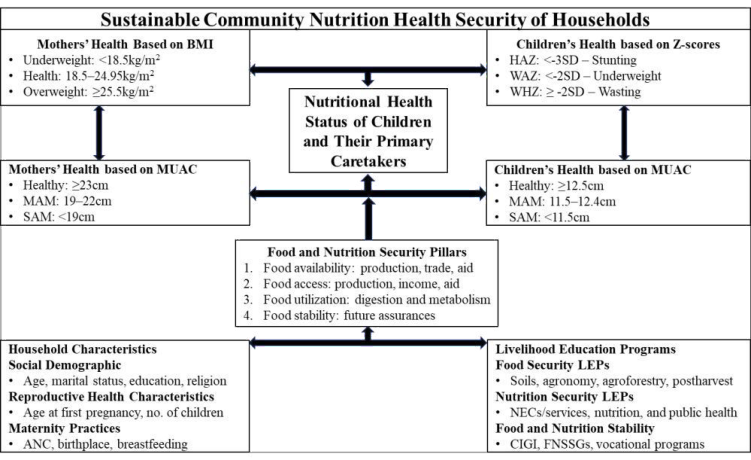 Figure 3
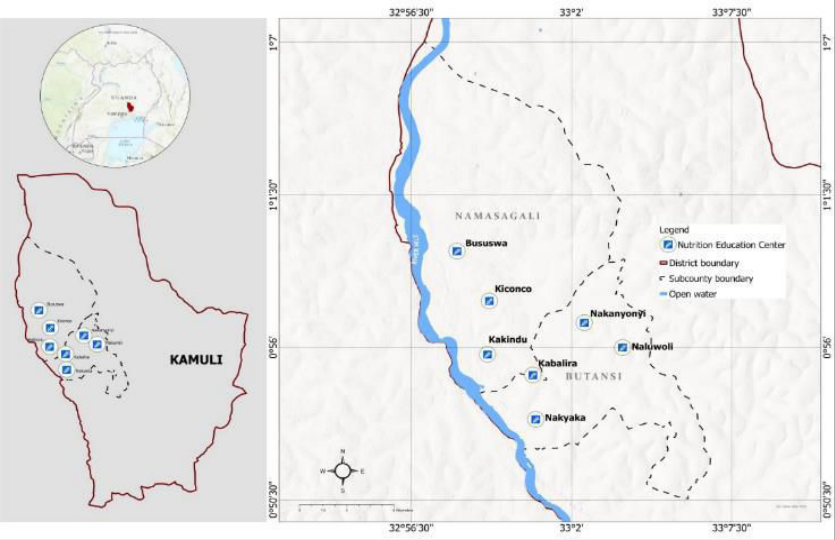 Figure 4
 Table 1
 Table 2
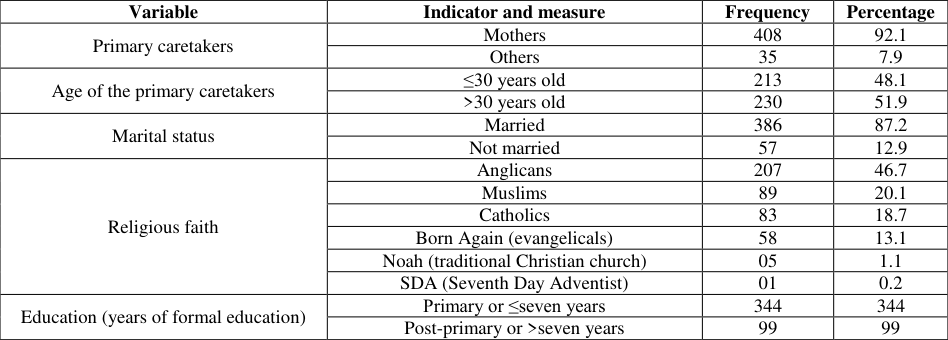 Table 3
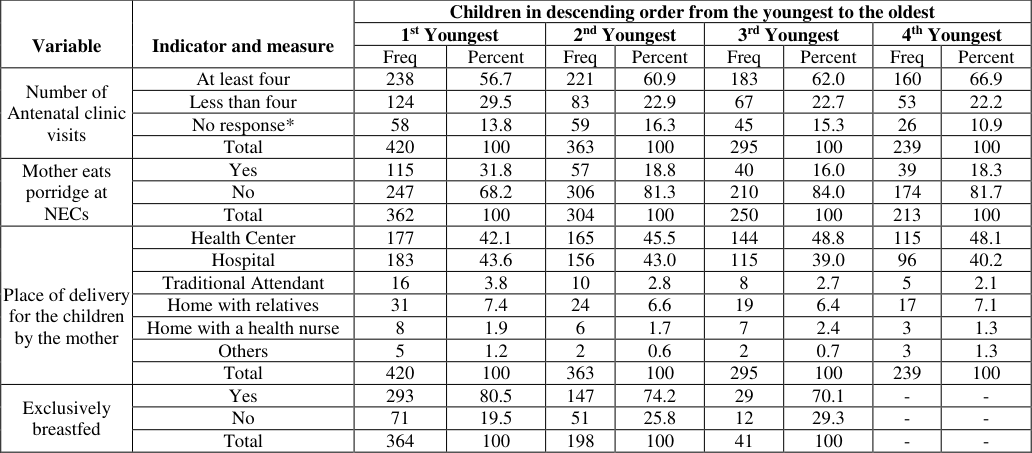 Table 4
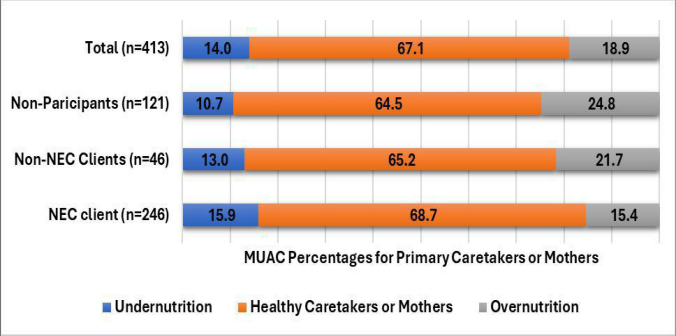 Figure 5
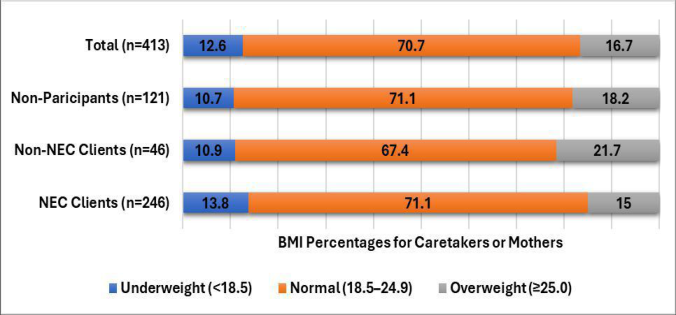 Figure 6
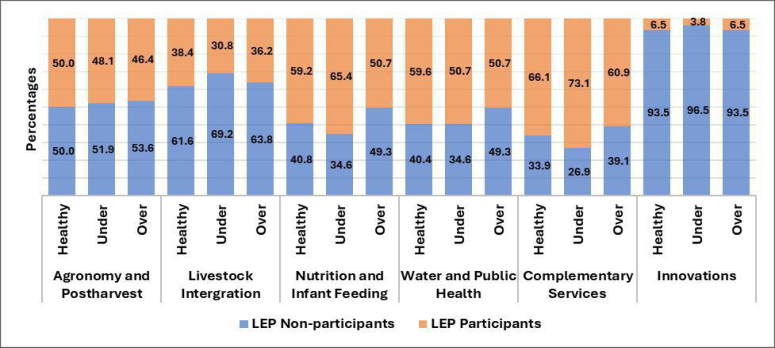 Figure 7
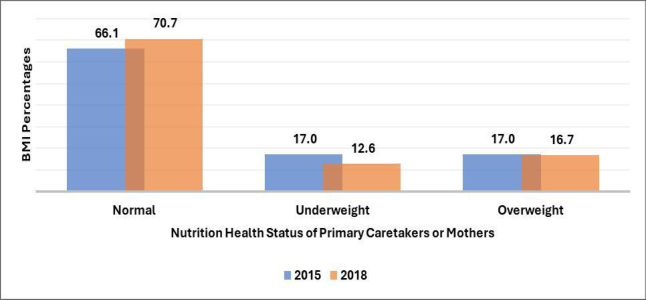 Figure 8
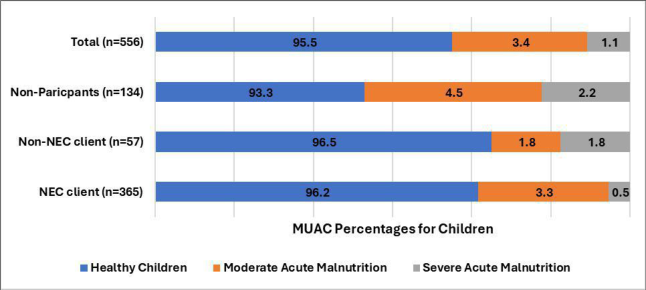 Figure 9
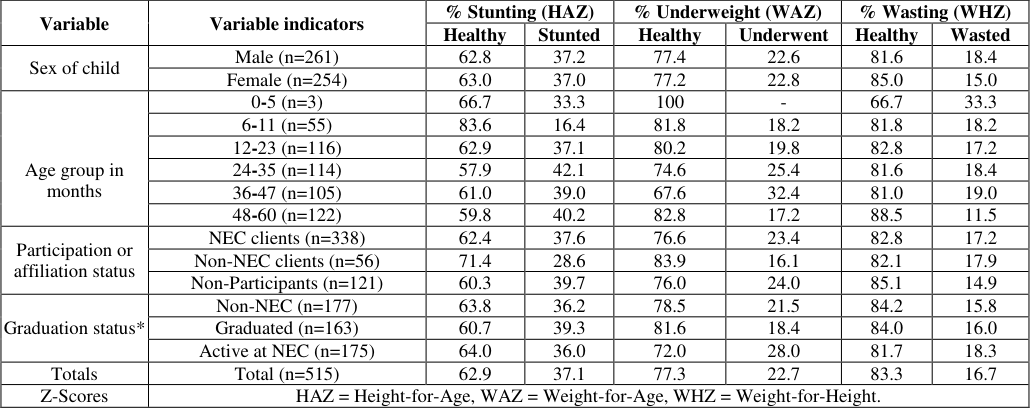 Table 5
 Table 6
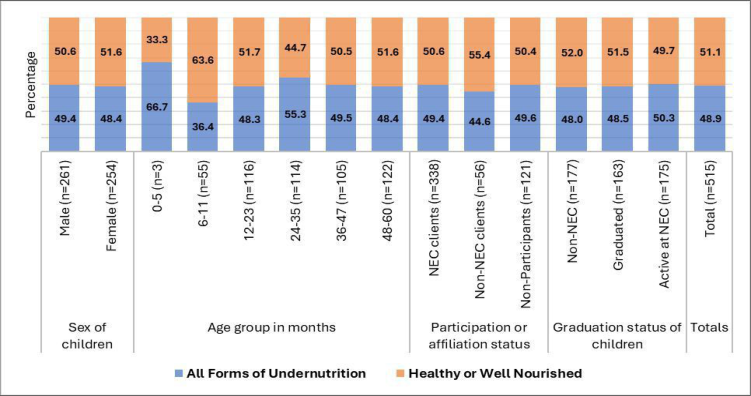 Figure 10
Introduction
Promoting food and nutrition security has been the cornerstone of the United Nations bodies, collaboratively fostering 15-year phased strategic plans from the Millennium Development
The operations of the Uganda Food Strategy and Investment Plan were monitored by the Uganda Food and Nutrition Council (UFNC) housed in the Office of the Prime Minister of Uganda (OPM). In execution of its duties, the Council worked in tandem with line ministries, including, among others, Agriculture, Health, Land, Education, Trade, Finance, Gender, and the OPM, non-governmental organizations, and voluntary stakeholders. Embedded in the Uganda Food and Nutrition Policy Strategy were two more strategies designed by the Ministry of Health. In 2005, phase two of the 2005-2010 Health Sector Strategic Plan (HSSP) emphasized micronutrient supplementation for infant malnutrition reduction [11] In 2010, the overall HSSP investment plan was redesigned for the five years (2011-2016), fitting into the 10-year National Health Policy (2010-2020) to curb food and nutrition insecurity, promote health, and enhance development in the country [11] Nutrition and health improvement have been monitored periodically through the Uganda demographic and health surveys every five years and presented as timeseries data: 2006, 2011, 2016, and the latest of 2022 [12] .
Uganda's Regional and Global Efforts for Food and Nutrition Security: Uganda's efforts in food and nutrition security are beyond its borders. Globally, Uganda is a signatory to the United Nations Sustainable Development Goals of September 2015 [1] These goals target having a healthy population by 2030 through ending all forms of malnutrition and improving access to food as a human right. The strategies within all the declarations focus on enhancing the productivity of the agricultural sector, building resilience, and enhancing incomes and livelihoods. Regionally, Uganda is a signatory to the June 2014 Malabo Declaration of the African Union [13] The Malabo Declaration sought to reduce the malnutrition rate of children of 0-59 months of age, specifically stunting to 10% and wasting to 5% by 2025.
Source: Uganda Bureau of Statistics (pp. 172; 177) [12]
The State of Food and Nutrition Security in Uganda
The government of Uganda and several stakeholders have invested in food and nutrition interventions [14] Despite all the efforts, the problem of food insecurity and malnutrition still exists. For instance, since 2019, Uganda has been ranked as serious in hunger severity on the Global Hunger Index [15] Moreover, the recent census also indicated that 46% of Ugandans were food insecure [16] . The nutrition health status has been improving since the launch of the phased Health Sector Strategic Plans, and the subsequent Uganda Nutrition Action Plan I and II [12,14] Specifically, among children of 0-59 months of age, stunting-linear growth retardation, underweight, and overweight reflect a reduction in severity by different magnitudes over time, 2006-2022. While wasting (weightfor-height index, a severe undernutrition) despite an increase between 2011-2016, there was a reduction between 2016-2022 (Figure 1). Among mothers aged 15-49 years, the level of thinness remained constant between 2016-2022, while overweight/obesity has consistently risen since 2006. The nutrition security statuses among children and mothers are consistent with several trend studies [17][18] and global trend analyses [15,19] conducted across Uganda. The government, through the ministries of Agriculture and Health, called upon stakeholders for support in implementing the food and nutrition interventions (p. v) [4] Similarly, the Office of the Prime Minister renewed these calls for collaboration during the Uganda Nutrition Action Plan II of 2020-2025 to strengthen the structural functionality of the nutrition health interventions [14] The government calls for collaborations, the low food and nutrition security, poverty, and the availability of partner organizations and institutions ushered in the partnership between Uganda and Iowa State University of the United States through the Center for Sustainable Rural Livelihood [20][21][22][23] . [21, 23-24] Vested in the CSRL goal, this tripartite partnership sought to improve food and nutrition security, deploying several approaches to community development [22] Development efforts are fostered by Iowa State University's land grant ethos of research and discovery [22,25] guided by livelihood frameworks [26][27] while blending indigenous knowledge [28] to create opportunities for community development. The inaugural strategies deployed involved a farmer-tofarmer extension approach to improve food security through the formation of food security groups, 2004-2014, commensurate with CSRL/VEDCO partnership [26-27-28] . In the renewed partnership of CSRL/ISU-UP, 2014 to date, a comprehensive human capacity development was devised (Figure 2), touching the lives of people from pregnancy to seniors through interrelated livelihoods education programs [21][22] .
Fig 2: The CSRL/ISU-UP Human Capacity Development Model
The CSRL/ISU-UP's Interrelated Livelihood Programs The livelihood education programs (LEPs) of the CSRL/ISU-UP are closely aligned into three categories, including those fostering: food security and economic prosperity, nutrition health security, and food and nutrition security stability and sustainability. The clientele served by CSRL/ISU-UP sign up for at least one of the programs in any of these categories.
CSRL/ISU-UP Food Security Interventions
These LEPs focus on research to devise means of improving food production and access. Programs such as soil and agronomy seek to improve household knowledge in soil and crop production and increase access to high-yielding varieties [29][30][31][32][33][34][35] Agroforestry and orchards support schools and communities in improving knowledge on integrated fruit trees for consumption and tree production for environmental conservation [31,[36][37][38][39][40][41] Postharvest programs seek to improve management of postharvest losses, especially grains, to improve their shelf life for use and reduce the incidence of aflatoxins due to poor storage [31,[37][38][39][40][41] Livestock production and management support communities and schools in managing livestock to improve production, foster consumption of animal-source proteins, and sales income [42][43] School gardens, in addition to providing knowledge, these gardens support the production of food crops and vegetables used in school lunches and reduce the effect of hidden hunger among school-going children [44][45][46][47] Youth entrepreneurship programs support skilling youths in approaches to managing small to medium businesses to improve food production, access, and income to diversify their livelihood strategies [22,48] .
CSRL/ISU-UP Nutrition Security Interventions
Nutrition education programs foster community development through the management of malnutrition in communities and schools. The program uses Nutrition Education Centers (NECs) as community-based locations for rehabilitation of at-risk-of-malnutrition primary caretakers and children of 0-59 months of age using nutrient-dense therapeutic porridge [43,[49][50] . The program enhances the knowledge of communities through nutrition and infant feeding education programs to understand the root cause of malnutrition and how using food diets can manage the program [51] The program also uses water and public health education programs to foster knowledge on sanitation-related challenges, such as diarrhea and the importance of construction and maintaining the WASH infrastructures, such as latrines, to manage the related diseases [52] and food safety education and handling programs [53] . In schools, the school feeding programs use proceeds from school gardens to prepare meals that are served to children during their time in school [44,47,54] Parents and the organization also support the school feeding program through the contribution of grains/maize (parents), beans, and the construction of modern kitchens for the lunch programs [21] .
CSRL/ISU-UP Food and Nutrition Security Stability
Interventions: After rehabilitation through the NECs, clients are encouraged to enroll in stability and sustainability programs to sustain the gains in addition to continued participation in routine education programs, fostering food and nutrition security. Currently, there are three food and nutrition stability programs: Community Income Generating Innovations (CIGI), Food and Nutrition Security Support Groups (FNSSGs), and vocational and teen mother programs [22] . Launched in 2016, CIGI supports mothers' innovations, especially projects that harness their skills of their head, hands, heart, and health [22,[55][56] . Mothers produce goods from bead products, which include bangles, bracelets, necklaces, and purses; palm leaf products like mats; sewing products like dresses, laptop bags; raffia products like baskets; and scholastic materials like books. Similarly, in 2019, FNSSGs were launched to support further stabilization of nutrition gains from the NECs, focusing on rehabilitated mothers but also including fathers as key players in food and nutrition interventions [22] The key in the FNSSGs is the provisioning of technical support and some inputs and market for the group's products.
For effectiveness, the CSRL/ISU-UP adopted a positive deviance approach. It identifies members struggling with similar food and nutrition challenges, but have maneuvered their way to overcome the challenge. Such maneuverability places those members at an advantage as role models to influence in their community [57] Those members are used as program contact people in implementing the activities of the FNSSGs [22] . The vocational and teen mother projects were launched in 2021 due to the rise of school dropouts and early marriages owing to the long-term effects of the COVID-19 pandemic [22] Teen mothers are clustered, formally trained by their specialties, and certified by the vocational and industrial education body in Uganda. In their groups, mothers make products such as exercise books, leather crafts like shoes, while others are in projects like baking, hair dressing, and tailoring. In summary, CSRL/ISU-UP LEPs foster household behavioral change [58] toward food and nutrition security and building their capacity to diversify their livelihood strategies. Although several studies have assessed the impact of these LEPs on food security in communities [59][60][61] and nutrition security in schools [44] so far, no comprehensive assessment has been conducted to assess the LEPs' impact on nutrition health security in rural communities in Kamuli district.
Purpose and Objectives of the Study
This study sought to bridge the research gap in nutrition health security to understand the programs' impact and facilitate program planning for improvements. The study assessed the nutritional health status of the primary caretakers and children (0-59 months of age) in relation to their affiliation with the nutrition education centers (NECs) and participation in the livelihood education programs (LEPs). The study had five key objectives: 1. Identify the socio-demographic and reproductive characteristics and practices of the primary caretakers of children. 2. Determine the nutritional health status of the primary caretakers of children and compare to their affiliation with NECs and participation in LEPs. 3. Determine the nutritional health status of children and compare to their affiliation with NECs and participation in LEPs. 4. Establish the factors influencing household nutritional health status. 5. Establish the relationship between the nutritional health status of the primary caretakers and their children.
Literature Review and Household Nutrition Health Conceptual Framework
In 2013, the Food and Agriculture Organization (FAO) and partner organizations of the United Nations came to a consensus and adopted the term food and nutrition security [62] They urged that households need consistent access to food to meet their nutritional demands for a physically, economically, and socially healthy life to be considered food secure. However, households also need to be nutritionally secure, leading to the concept of food and nutrition security, which comprises all elements of food security coupled with conducive, clean environments that reduce household vulnerability to diseases. The food and nutrition security concept comprises four core pillars, including 1) availability, 2) access, 3) utilization, and 4) stability, which work in synergy for a sustainable food and nutritionally secure household [62] Food security focuses on food availability and access, whereas nutrition security focuses on food utilization within our bodies digestion and metabolism, and food stability focuses on assurances and sustainable future access to food.
To expound on food utilization, this concept deals with the ability of our bodies to absorb nutrients. Food absorption is influenced by several factors, including the health status of the body and the diet consumed. Additionally, household cleanliness, especially water and sanitation infrastructures like latrines, determines the household predisposition to sanitation-related illness such as diarrhea and malaria [52,63] Although the food security aspects of food availability and food access are influential, these do not guarantee the nutritional concept of food utilization. In any case, high income, for instance, is a key determinant of food access; however, it may result in unbalanced food consumption behaviors. These behaviors include a preference for hypocaloric (low-calorie foods), leading to underweight, and/or hypercaloric (high-calorie foods), leading to overweight [64] Similarly, consumption of alcohol and/or fast foods is associated with low body nutrients [65][66] Nevertheless, the key to food utilization rests on household hygiene, as well as support from the government and development partners in reducing and preventing tropical diseases like malaria [67] Such support ensures health described in food systems as the "ability to adapt and selfmanage in the face of social, physical, and emotional challenges" to contribute to food production while "successfully adapting to an illness" (pp. 235-236) [68] In summary, this study focused on food utilization.
Measurement of Food Utilization -An Index of Nutrition
Security: Food utilization was measured by anthropometric indices for both children of 0-5 years of age and their primary caretakers or mothers [69][70][71] Anthropometric indices measure the body's physical proportions, such as height, weight, and circumferences of various parts like head, arms, waist, and hips, that are used to detect the nutritional health status of the individual relating to undernutrition and obesity. Weights are mainly used to identify signs of undernutrition or overnutrition (obesity), heights for stunting, and arm circumferences provide additional nutritional indicators and health. These anthropometric measures are combined to measure individual variables that are used to determine the health status of individuals. These include the Body Mass Index (BMI), which measures weight-for-height to detect underweight or obesity among the primary caretakers of children or mothers. Also, among children (0-59 months of age), weight for age (WAZ) to detect underweight, height (recumbent length of infants) for age (HAZ) to detect stunting, and weight for height (WHZ) to detect wasting health incidences. In the determination of the health of children, those indices are compared with reference to their sex and the WHO reference population already standardized in the WHO Anthro software [69][70][71] .
The conceptual framework was designed for this study, illustrating the pathway to nutritional health security (Figure 3). The framework shows how the inherent household characteristics influence their participation in LEPs and ardently influence the food and nutrition security pillars. This study, therefore, assessed progress towards sustainable food utilization in our bodies, measured through anthropometric indices, to determine the levels of stunting, underweight, wasting, or healthy status among children. The indices were also used to determine the levels of underweight, overweight, and health status among the primary caretakers or the mothers of the children. All indices were merged to determine the level of severity, either acute or moderate malnutrition.
Methods
This study was part of a larger cross-sectional survey that assessed the impact of livelihood programs of the CSRL/ISU-UP on food and nutrition security in Kamuli district, Uganda [55] The target population for the study comprised 1503 NECs' registered clients, 2013-2018, with additional non-NEC clients for purposes of comparison in the sub-counties of Butansi and Namasagali (Figure 4). A representative sample of 306 NEC clients was established at a 95% significance and 5% margin of error. We randomly accessed and interviewed 253 NEC households (70.3% access rate). An additional 201 non-NEC households were randomly selected to match every NEC household client to a non-NEC household client in a quarter-mile radius from the NEC respondent. During data collection, locating the NEC household clients' homes was led by the community-based NEC trainers [49] . Data on socio-economic and demographic factors at a household level, such as gender, marital status, household size, age, and level of education, among others, were obtained. Data on maternal practices of mothers were collected, especially on the youngest four children, 0-59 months of age in the household. The maternal practices included attending antenatal clinic visits, places where children were given in, such as hospitals or homes, and the status of exclusive breastfeeding practices. To assess the nutrition security of households, data were collected on anthropometric indicators that involved measuring primary caretakers and children 0-59 months of age. The measurements included weight, height, and Mid Upper Arm Circumference (MUAC) for both categories, and this was done by the community-based NEC trainers who were paired with the research assistants.
Nutrition Security and Health Status of Households
The nutritional health statuses of households were assessed on the primary caretakers/mothers, and infants and children of 0-59 months of age. Anthropometric measurements were conducted to obtain data on children and their primary caretakers, who were mainly their mothers. Three measurements, including weight, height, and MUAC, were taken. For purposes of accuracy and consistency, each measurement was taken twice, and an average was computed as the final value for analysis [72][73] .
Measurement of weight:
The study adapted Casadei and Kiel and Lee and Nieman's weighing method [72][73] Babies/infants under six months were weighed using a hanging scale. The baby was made to sit in a weighing bag, which was then hooked onto the hanging scale. For children who are above six months but below two years and/or cannot stand, we used a standing scale that was placed on flat ground. The mother or caretaker's weight was taken individually and recorded, then the total weight of the mother holding the child was taken and recorded, and the difference between these two values gave the weight of the child. Children who could stand could stand straight on the weighing scale without their shoes, and their weight was read off the weighing scale.
For mothers/primary caretakers, a standing scale was used to measure their weight. However, caution was taken that the mother was not wearing shoes or heavy clothing that could add significant weight to her normal body weight. The weight of all subjects was recorded to the nearest 0.1 and in kilograms (kgs).
Measurement of height and recumbent length
Heights of children too young to stand were obtained by taking their recumbent length while lying straight on a Calibrated Height-Board placed horizontally on flat ground without shoes or a hat. Mothers (and children) who could stand had their heights taken by standing on the Calibrated Height-Board. Values were read off the scale and recorded to the nearest 0.1, and in centimeters (cm). The relative height of the mother's hair, and/or the child, especially baby girls, was subtracted from the value to obtain the actual value. This was done since some of them had different hairstyles, which had a significant effect on their heights.
Measurement of Mid Upper Arm Circumference (MUAC):
A MUAC tape was used to take measurements for children and primary caretakers independently. Before taking the reading, the hand that is less used, like the left hand (for right-handed people) was made to hang relaxed alongside the body, and a midpoint between the elbow and the shoulder was determined. We determined the midpoint of the upper arm while the arm was at about 90 degrees-touching the tummy, then the hand was allowed to hang during the actual MUAC measurement. A tape was then placed around the mid-point of the arm. Caution was taken to ensure that the tape was neither too tight nor too loose. Readings were taken from the window of the tape and/or from the tape, and these values were read off to the nearest 0.1cm and recorded for analysis [69][70][71] .
The Health of Primary Caretakers Based on MUAC Readings:
The MUAC readings of primary caretakers were included in the interpretations, although they are not commonly used; most research goes by their BMI. Readings of <23cm reflect undernutrition, 23-28cm reflect health status, and >28cm reflect overnutrition/overweight health condition among primary caretakers [74] .
The Health of Primary Caretakers Based on Their Body Mass Index (BMI):
The BMI for caretakers/mothers was obtained by taking their weight in kilograms divided by height in square meters (BMI = Kg/m 2 ). Table 1 has the interpretations of the BMI cut-offs. The results were analyzed on indices of underweight, normal/healthy, and overweight [69][70][71] . Author note: Our results are provided for three categories: Underweight, healthy, and overweight. All results were presented as descriptive statistics with frequencies, percentages, sums, means, medians, standard deviations, and graphs. Chi-Square analyses were employed to determine the association between caretakers' health with their 1) household characteristics, 2) personal characteristics, and 3) reproductive practices. ANOVA and post hoc analyses were performed to determine the differences in the results among them and to draw generalized conclusions in the population of our study based on the statistical significance that existed between them and differentiated them.
| Nutrition Health Status BMI Cut-off | — | BMI Cut-off for Obese Categories | — |
|---|---|---|---|
| Underweight | <18.5kg/m2 | Obese class I (moderate) | 30.0-34.95kg/m2 |
| Healthy | 18.5-24.95kg/m2 | Obese class II (severe) | 35.0-39.95kg/m2 |
| Overweight | 25.0-29.95kg/m2 | Obese class III (very severe) | ≥40.05kg/m2 |
Table text extracted from the original PDF; superscript letters are shown inline. The original table image is below.
View original table image
Child Health Based on the MUAC Readings
The MUAC readings help to determine whether the infant or child is wasting. Based on a 3-color-coded tape, measurements were done, read, and interpreted accordingly [69][70][71] Children who had MUAC readings in the green zone (≥12.5cm) were well nourished and most likely had good weight-for-height (WHZ). Children who had MUAC readings in the yellow zone (11.5-12.4cm)
Children's Health Status Based on Z-scores of their Anthropometrics:
The Z-scores on anthropometric indicators for infants and children are both age (in months) and sex-independent [69][70][71] . We used the WHO Anthro software (version 3.2.2, January 2011) to convert the indices (height and weight) into their Z-score for age to determine the presence of stunting, underweight, and wasting (Table 2). As a caution, before uploading data in the software, all children who had incomplete biodata, including age, sex, weight, and or height, were excluded, as well as children diagnosed with oedema. In our study, we had a total of 606 children. After the exclusion of 91 children who did not meet the criteria, there were no flagged children in the final data analyzed, with 515 children. Data were then converted into database format before exporting to WHO Anthro. The results are presented as descriptive statistics with frequencies, percentages, sums, means, medians, standard deviations, and graphs. Chi-Square was used to determine the association between the personal, caregivers', and households' characteristics believed to influence their health. ANOVA and post hoc analyses were also employed to determine the differences that existed in their health with reference to the characteristics mentioned above.
| Health Status, Z-scores | — | Undernutrition with Z-scores ˂-2SD | — | MUAC, Color | — |
|---|---|---|---|---|---|
| Severe | ˂-3SD | HAZ - Height-for-Age | Stunting | <11.5cm | Red |
| Moderate | ˂-2SD | WAZ - Weight-for-Age | Underweight | 11.5-12.4cm | Yellow |
| Healthy | ≥-2SD | WHZ - Weight-for-Height | Wasting | ≥12.5cm | Green |
Table text extracted from the original PDF; superscript letters are shown inline. The original table image is below.
View original table image
Participation in LEPs and Nutrition Health
The nutritional health statuses of primary caretakers and children were categorized into 1) healthy or malnourished (underweight and overweight); healthy or undernourished (stunting, underweight, and wasting), respectively. Then a bivariate analysis was employed, specifically using the Chi-Square to determine the association between participants in LEPs and the health status of children and their caretakers.
Data are present in tabular form showing percentages and their statistical significance at 0.05, with a 0.1 considered due to variable categorization, which reduced its predication power [75] .
Results
Results
Socio-demographics and Reproductive Characteristics of the Primary Caretakers
To better understand the interpretations of the nutrition security status of the mothers/primary caretakers, infants, and children, it was prudent to first examine the sociocultural characteristics of respondents. The specifications are presented here in two categories: the sociodemographics of the caretakers, and the reproductive characteristics of the actual mother of the infants and children.
The socio-demographics of the primary caretakers
The total number of primary caretakers was 443 in the whole survey, with their socio-demographics detailed in Table 3. The majority were 92.1% were the mothers of the children, 31 (7.0%) were grandparents, only one father (0.2%), and 03 (0.7%) were other relatives. In terms of marital status, most caretakers, 87.2%, were married in either monogamous (85.2%) or polygamous (14.8%) arrangements, and 57 (12.8%) were not married in the categories of singles who never married, divorced/separated, or widowed. (11). The responses here did not track the total number of children but only tracked at least one child in the household who had attended the NECs. The households by the survey time who were currently attending the NECs were 107 of those who knew about the existence of the NECs, among whom 70 had at least a mother, 34 had at least one child, and 03 had at least a grandchild. These totals do not consider the total number of mothers, children, and grandchildren from each household of the caretaker, and more than one member of the household can be admitted to the centers.
| Variable | Indicator and measure | Frequency | Percentage |
|---|---|---|---|
| Primary caretakers | Mothers | 408 | 92.1 |
| Others | 35 | 7.9 | |
| Age of the primary caretakers | ≤30 years old | 213 | 48.1 |
| >30 years old | 230 | 51.9 | |
| Marital status | Married | 386 | 87.2 |
| Not married | 57 | 12.9 | |
| Religious faith | Anglicans | 207 | 46.7 |
| Muslims | 89 | 20.1 | |
| Catholics | 83 | 18.7 | |
| Born Again (evangelicals) | 58 | 13.1 | |
| Noah (traditional Christian church) | 05 | 1.1 | |
| SDA (Seventh Day Adventist) | 01 | 0.2 | |
| Education (years of formal education) | Primary or ≤seven years | 344 | 344 |
| Post-primary or >seven years | 99 | 99 |
Table text extracted from the original PDF; superscript letters are shown inline. The original table image is below.
View original table image
Reproductive Characteristics and Practices of Mothers
The total number of mothers of infants and children of 0-59 months of age was 423, of whom 408 were actual primary caretakers. Given the nature of extended families, and polygamous marriage, the survey tracked for the mothers in the household (since many children in the same household could belong to different mothers), and reports that mothers of child "one category" were 415 (93.7%), and mother of "child two categories" were 28 (6.3%), (there was no mother three/child three found), and this data was used to determine the number of children given birth by each of the mothers.
Among the 423 mothers, 293 (69.3%) first became pregnant before 19 years old. The minimum age at first pregnancy was 12 years, the mean at (18.94±4.00) years, and the modal age was 18.0 years. We found significant differences in the age at first pregnancy among the participants and nonparticipants. Non-NEC clients had a higher age (20.36 a ±4.14) above the mean, whereas the NEC clients (18.83 b ±4.07) and non-participants (18.55 b ±3.67) were statistically the same and below the mean. Among the 423 mothers, 33 (7.8%) were expectant mothers by the survey time, of whom 14 and 19 mothers had the age of pregnancy in months below and above five, respectively. There was no statistically significant association between membership in NEC and pregnancy as expected (χ² = 0.345, df = 1, p = 0.558), however, more pregnant mothers (7.9%) were likely to be found at the NEC for services of porridge, immunization, among others, than at home (6.5%) as nonparticipants. About the number of babies given birth alive by "mother one", 250 (60.2%) of 415 had 1-4 babies, 161 (38.8%) had above 4 babies, and 04 (1.0%) their babies were not alive at birth (were dead), whereas the maximum number of children was 10, the mean was 04 babies. For "mother two" of the 28 mothers, 11 (39.3%) had 1-4 babies, 10 (35.7%) had over 04 babies, and 07 (25.0%) their babies that were not alive at birth (were dead), the maximum was 09 and the mean was 03 babies. We found no statistically significant differences among the participants and non-participants; however, NEC clients, being younger in age, had a relatively lower mean (4.12 a ±2.44) compared to the non-NEC clients (4.37 a ±2.67), and non-participants (4.13 a ±2.53 a ) with reference to the overall mean number of babies (4.15±2.50).
Maternity Practices of Mothers of Children
The survey further tracked the antenatal clinic visits of the mothers, in general, using four antenatal clinic visits as a minimum suggested by Lincetto et al [76] with reference to the last four babies, with the youngest child as the first to fourth child in descending order. Similarly, tracked the therapeutic porridge consumption of the mother for each of those four children and the place of birth for every child. The results are summarized in Table 4 below. There were no statistically significant differences in the number of times mothers visited antenatal clinics for each of the four children among the participants and nonparticipants. However, with reference to the youngest child, program participants: NEC clients visited more times (4.29 a ±1.88) compared to non-NEC clients (4.26 a ±1.31), though above the mean, as well as non-participants (3.92 a ±1.26) who were below the overall mean (4.18±1.67).
| Variable | Indicator and measure | Children in descending order from the youngest to the oldest | — | — | — | — | — | — | — |
|---|---|---|---|---|---|---|---|---|---|
| 1st Youngest | 2nd Youngest | 3rd Youngest | 4th Youngest | ||||||
| Freq | Percent | Freq | Percent | Freq | Percent | Freq | Percent | ||
| Number of Antenatal clinic visits | At least four | 238 | 56.7 | 221 | 60.9 | 183 | 62.0 | 160 | 66.9 |
| Less than four | 124 | 29.5 | 83 | 22.9 | 67 | 22.7 | 53 | 22.2 | |
| No response* | 58 | 13.8 | 59 | 16.3 | 45 | 15.3 | 26 | 10.9 | |
| Total | 420 | 100 | 363 | 100 | 295 | 100 | 239 | 100 | |
| Mother eats porridge at NECs | Yes | 115 | 31.8 | 57 | 18.8 | 40 | 16.0 | 39 | 18.3 |
| No | 247 | 68.2 | 306 | 81.3 | 210 | 84.0 | 174 | 81.7 | |
| Total | 362 | 100 | 304 | 100 | 250 | 100 | 213 | 100 | |
| Place of delivery for the children by the mother | Health Center | 177 | 42.1 | 165 | 45.5 | 144 | 48.8 | 115 | 48.1 |
| Hospital | 183 | 43.6 | 156 | 43.0 | 115 | 39.0 | 96 | 40.2 | |
| Traditional Attendant | 16 | 3.8 | 10 | 2.8 | 8 | 2.7 | 5 | 2.1 | |
| Home with relatives | 31 | 7.4 | 24 | 6.6 | 19 | 6.4 | 17 | 7.1 | |
| Home with a health nurse | 8 | 1.9 | 6 | 1.7 | 7 | 2.4 | 3 | 1.3 | |
| Others | 5 | 1.2 | 2 | 0.6 | 2 | 0.7 | 3 | 1.3 | |
| Total | 420 | 100 | 363 | 100 | 295 | 100 | 239 | 100 | |
| Exclusively breastfed | Yes | 293 | 80.5 | 147 | 74.2 | 29 | 70.1 | - | - |
| No | 71 | 19.5 | 51 | 25.8 | 12 | 29.3 | - | - | |
| Total | 364 | 100 | 198 | 100 | 41 | 100 | - | - |
Table text extracted from the original PDF; superscript letters are shown inline. The original table image is below.
View original table image
There was a statistically significant association between place of delivery in relation to the mother being an NEC member. When delivery places are merged into three categories according to their risk factor, with 1) health centers and hospitals as safe places, 2) traditional birth attendants and homes with health nurses as risky, and 3) homes with relatives and other means as highly risky, it was established that NEC clients for all the children went to safe places for their delivery. The first child, for instance, 89.2%
Nutritional Health Status of Primary Caretakers or Mothers:
Of the 443 households that had primary caretakers, 413 (93.2%) met the criteria for their anthropometry measurements to be taken. The 30 (6.8%) primary caretakers were either male, or (grandparents), or not mothers around by the time of the survey, and could not be traced even after several returns to the households by the research assistants. A quick assessment of health status using MUAC revealed that 67.1% of the primary caretakers were classified as healthy, 14.0% were undernourished, and 18.9% were classified as overnourished (Figure 5). However, MUAC assessment is not conclusive, and further examination was warranted using the BMI indices. By BMI, the number of households with caretakers classified as healthy was 70.7%, those classified as underweight were 12.6%, and those classified as overweight were 16.7% (Figure 6). Disaggregating data between CSRL/ISU-UP participants and non-participants, of the 292 overall participant households who had these primary caretakers, 70.6% were classified as healthy, 13.4% were underweight, and 16.1% were classified as overweight. the program caters to at-risk-for-malnutrition clients [49] whereas the non-NEC and non-participants were more overweight. Also, mothers at the NEC are either breastfeeding or pregnant, which increases energy demands on their bodies, so they are likely to be underweight.
Livelihood Education Programs and Primary Caretakers/Mothers' Health StatusLivelihood Education
Programs (LEPs) that foster food and nutrition security were clustered into six: agronomy and postharvest, livestock integration, nutrition and infant feeding, water and public health, complementary services, and community incomegenerating innovations. Although we did not establish any statistically significant association, households of primary caretaker participants in LEPs were more likely to be healthier than non-participants (Figure 7). The baseline data were assessed on 283 mothers in 2015 [55] Although there was an observed improvement in the health status between 2015 to 2018, there were no statistically significant differences among the health status categories between the years (Figure 8). Compared to the baseline data of 2015, healthy caretakers were 66.1% compared to 70.7% in 2018.
Nutrition Security and Health Status of Children
Of the 606 children of 0-59 months of age involved in the survey, 515 (91.8%) had their health assessed based on the emergency methods using MUAC. The majority, 95.5% were classified as healthy, 3.4% as moderately malnourished, and 1.1% as severely malnourished (Figure 9). The use of MUAC is further complemented with Z-score indices for a comprehensive analysis on a global standard reference scale [69][70][71] . The survey results report that there were more stunted children (37.1%) than underweight (22.7%) or wasted (16.7%) children (Table 5). We found no significant
| Variable | Variable indicators | % Stunting (HAZ) | — | % Underweight (WAZ) | — | % Wasting (WHZ) | — |
|---|---|---|---|---|---|---|---|
| Healthy | Stunted | Healthy | Underwent | Healthy | Wasted | ||
| Sex of child | Male (n=261) | 62.8 | 37.2 | 77.4 | 22.6 | 81.6 | 18.4 |
| Female (n=254) | 63.0 | 37.0 | 77.2 | 22.8 | 85.0 | 15.0 | |
| Age group in months | 0-5 (n=3) | 66.7 | 33.3 | 100 | - | 66.7 | 33.3 |
| 6-11 (n=55) | 83.6 | 16.4 | 81.8 | 18.2 | 81.8 | 18.2 | |
| 12-23 (n=116) | 62.9 | 37.1 | 80.2 | 19.8 | 82.8 | 17.2 | |
| 24-35 (n=114) | 57.9 | 42.1 | 74.6 | 25.4 | 81.6 | 18.4 | |
| 36-47 (n=105) | 61.0 | 39.0 | 67.6 | 32.4 | 81.0 | 19.0 | |
| 48-60 (n=122) | 59.8 | 40.2 | 82.8 | 17.2 | 88.5 | 11.5 | |
| Participation or affiliation status | NEC clients (n=338) | 62.4 | 37.6 | 76.6 | 23.4 | 82.8 | 17.2 |
| Non-NEC clients (n=56) | 71.4 | 28.6 | 83.9 | 16.1 | 82.1 | 17.9 | |
| Non-Participants (n=121) | 60.3 | 39.7 | 76.0 | 24.0 | 85.1 | 14.9 | |
| Graduation status* | Non-NEC (n=177) | 63.8 | 36.2 | 78.5 | 21.5 | 84.2 | 15.8 |
| Graduated (n=163) | 60.7 | 39.3 | 81.6 | 18.4 | 84.0 | 16.0 | |
| Active at NEC (n=175) | 64.0 | 36.0 | 72.0 | 28.0 | 81.7 | 18.3 | |
| Totals | Total (n=515) | 62.9 | 37.1 | 77.3 | 22.7 | 83.3 | 16.7 |
| Z-Scores | HAZ = Height-for-Age, WAZ = Weight-for-Age, WHZ = Weight-for-Height. |
Table text extracted from the original PDF; superscript letters are shown inline. The original table image is below.
View original table image
International Journal of Agriculture and Nutrition https://www.agriculturejournal.net association between stunting, being underweight, and wasting with reference to the gender of the children.
However, more boys were stunted and wasted, whereas more girls were found to be underweight. Graduation status*: Graduated children are those who have undergone malnutrition rehabilitation at the NECs [43,49] .
The study found an association between stunting and age of the child; it was likely to be higher (42.1%) among the 24-35 age cohort than other groups (χ² = 12.040, df = 5, p = 0.034). Similarly, underweight was found to be increasing with age and peaked at 32.4% within the 36-47 age group (χ² = 10.249, df = 5, p = 0.068). There was no significant association between stunting, underweight, and wasting with reference to the participation status of households. However, more stunted (39.7%) and underweight (24.0%) children were found among the non-participants, whereas non-NEC clients had more (17.9%) of the children with wasting health conditions. Regarding graduation status, there were more underweight (28.0%) within the active children at the NEC than the graduated and those who had never been at the NEC (χ² = 4.665, df = 2, p = 0.097). By means comparison through ANOVA, we found similar significant differences where active children (-1.33 a ±1.27) at the NEC were different from the graduated, but the graduated (-0.93 b ±1.26) and the non-NEC (-1.05 a,b ±1.41) were the same. Although no statistically significant association was found between wasting and stunting within the graduation category, the former was more within active children (18.3%), and the latter among graduates.
Relationship Between the Health of Primary Caretakers and Their Children
From the analysis, more stunted children (44.6%) were found to belong to the underweight mothers (χ² = 7.027, df = 2, p = 0.030) compared to 38.7% of stunted children with healthy mothers and 25.8% with overweight mothers. Similarly, underweight mothers had more of the underweight children (27.7%) compared to healthy and overweight, who had 24.4 and 12.9 percent, respectively (χ² = 6.573, df = 2, p = 0.037). Both relationships were statistically significant.
Overall Prevalence of Malnutrition among Children
In the sum of the stunted, underweight, and wasted children, there were slightly more healthy children (51.1%) than malnourished (48.9%). Among the malnourished, 26.8% were severely malnourished 16.7 and 5.4 percent moderately malnourished, and mildly malnourished, respectively. By gender, an equal proportion (each with 26.8%) of males and females were categorized as severe cases, but more females were healthier than the males. More than half of the children ages 0-5 months were severely malnourished, but its sample size was too small. However, there were more severe cases across all the age groups than moderate and mild, whereas the 6-11 months age cohort was healthier than the rest of the age groups. By participation status, non-NEC clients had more severely malnourished (28.6%) and health (55.4%) cases than the participants. There were more severe cases of malnutrition among the graduates/children who had been rehabilitated (30.1%) than in the other categories, reflecting high rates of relapses. Also, there were healthier children among non-NEC children (52.2%) than the rest of the categories. Despite the variations in the proportion of severe, moderate, and marginal malnutrition statuses and healthy children, there were no statistically significant associations between the above health ranks with sex, age groups, participation status, and children's graduation status. Table 6 provides additional details on the cases.
| Variable | Malnutrition in percentages | Severe | Moderate | Marginal | All forms | Healthy |
|---|---|---|---|---|---|---|
| Sex of children | Male (n=261) | 26.8 | 16.5 | 6.1 | 49.4 | 50.6 |
| Female (n=254) | 26.8 | 16.9 | 4.7 | 48.4 | 51.6 | |
| Age group in months | 0-5 (n=3) | 66.7 | - | - | 66.7 | 33.3 |
| 6-11 (n=55) | 20.0 | 16.4 | - | 36.4 | 63.6 | |
| 12-23 (n=116) | 28.4 | 13.8 | 6.0 | 48.3 | 51.7 | |
| 24-35 (n=114) | 30.7 | 18.4 | 6.1 | 55.3 | 44.7 |
Table text extracted from the original PDF; superscript letters are shown inline. The original table image is below.
View original table image
Summation of Undernutrition among Infants and
Children of 0-59 Months of Age: Upon merging stunting, underweight, and wasting together, children who had all three cases were 26.8% termed as Severely Acutely Malnourished (SAM), those who had two cases were 16.7% termed as Moderately Acutely Malnourished (MAM), and those who had one case were 5.4% termed as Mildly/Marginally Malnourished. Altogether, all forms of malnutrition accounted for 48.9% and the nutritionally healthy children were 51.1% (Figure 10). Therefore, there were slightly more healthy children than malnourished, though there were no statistically significant differences between them.
Fig 10: Overall Malnutrition Prevalence among Children
Fig 10: Overall Malnutrition Prevalence among Children
Discussions
This study assessed the nutritional health status of children (0-59 months of age) and their primary caretaker in Kamuli district, Uganda, where the Center for Sustainable Rural Livelihoods and Iowa State University Uganda Program implement livelihood programs towards ending hunger. The study sought to understand the programs' impact and facilitate program planning for improvements. We compared the nutritional health status of the primary caretakers and children by their affiliation with the nutrition education centers (NECs) and participation in the livelihood education programs (LEPs). The comparative results are discussed in the sections that follow.
Nutrition
Status and Health of Primary Caretakers/Mothers: Based on the Body Mass Index (BMI) of the primary caretakers/mothers, 70.7% were nutritionally healthy, 12.6% were underweight, and 16.7% were overweight. Among program participants, there were no significant differences in their health status, though NEC clients were below the overall mean. These results suggest that they were more likely to tend to be underweight, whereas non-participants were above the mean, tending to be overweight, and the non-NEC participants were within the mean. The mothers served by the NECs are at risk for malnutrition, and their higher association with the NECs was because they were under rehabilitation [43,[49][50] . This study's nutrition insecurity results can be explained by the status of food insecurity [59] and low dietary diversity and caloric intake [60] found within this population, surveyed at the same time. Mothers who were underweight aligned with food insecurity and low dietary diversity households, while mothers in the overweight categories aligned with higher caloric intake status [55] The food insecurity situation is not isolated in the program area. A recent study conducted in a neighboring district revealed higher levels of food insecurity [77][78][79] with implications for raising rates of nutrition insecurity among households. Further, in comparison between the baseline, 2015, and the endline data, 2018, the general results show that there was an improvement, more so in the reduction of underweight (from 17.0% to 12.6%), to healthy mothers, whereas a reduction in overweight (from 17.0% to 16.7%) was low but registered progress. However, there were no statistically significant observations between the two time periods. Nevertheless, the high prevalence of underweight mothers can be attributed to early pregnancy and childbearing. We found the minimum age of mothers to be 12 years, with 69.3% having given birth by 19 years. Our findings corroborate those put forward by Fink et al [80] who report that the risk of stunting was more likely to happen to early childhood mothers. Uganda has a high fertility rate of 5.2 children per woman and a teenage marriage prevalence of 24%, 15-19 years of first childbearing [12] .
Similarly, these findings are aligned with those of the Uganda Demographic and Health Survey, which reports that an average woman marries 4.5 years earlier than men, and their median age at first marriage was found to be 18.8 years, and first birth was 19.5 years [12] Among the participant categories, the NEC and non-participants had the lowest mean age at first pregnancy of (18.88 a ±4.07), (18.55 a ±40.0), respectively, and were significantly different from the non-NEC who are participants (20.36 b ±4.14) in the program. The other factor found statistically significant in relation to nutrition security was the education of household heads, spouses, and/or primary caretakers. As reported earlier, NEC clients, specifically the primary caretakers (6.27 a ±2.73), were likely to have spent fewer years in formal education than non-participants (6.94 a ±2.94) and the non-NEC participants (7.23 b ±3.29). In addition to influencing economic status, education does influence health behaviors and attitudes, and food choices that determine the dietary intake of the household [12,[59][60] , consequently impacting nutrition security. Nutrition knowledge is a significant factor in determining the dietary practices of households [51,[81][82][83] . Other studies in this population revealed that a high proportion of the households with low education of fewer than seven years of school were more food insecure, [59] with a low food consumption score and a poor dietary diversity [60] compared to those with post-primary education. These conclusions are further confirmed by earlier findings of Malual and Mazur [84] ; Sseguya et al [61] who found that higher education among households in Lira and Kamuli districts of Uganda, respectively, was positively associated with food security, a positive multiplier for good nutritional health security.
Nutrition Status and Health of Infants and Children
In this section, we discuss the nutrition and health status of the children, specifically focusing on the components of undernutrition such as stunting, underweight, and wasting.
Stunting among infants and children
In this study, we used height-for-age (HAZ) as an indicator of linear growth retardation among children [12,[69][70][71] We found out that 37.1% of the children were stunted, a percentage found to be higher than the national average estimated at 29.0% in 2016 [85] and 22% in 2022 [12] Limited access to food, health, and child care are likely the principal causes [85] . By gender, more males were stunted (37.2%) than females (37.0%), though the difference was not significant. This status is like the findings of the Uganda Demographic and Health Survey [12] where more males (29%) under the age of five years are more likely to be stunted than females (23%). Byaruhanga et al. also found that more boys of school-going age in elementary school were found to be more stunted than girls within the study area of Kamuli [44] . Further still, the association found between stunting and the 24-35 age group, wherein this survey, stunting peaked in that age cohort. Similar findings were reported by UBOS [12] which further confirmed that rural children are 27% more likely to be stunted than 22% of urban children. There was a reduction from the previous survey cycle of 2016, which reported stunting of 30% among rural children and 24% among urban children of less than six years of age [85] .
The reason for stunting is probably because children at this age are prone to malnutrition since their nutrition requirements for growth and maintenance are high [86][87] yet their households are food insecure [59] with poor diets and low caloric intake [60] The children are in the period after being weaned from breastfeeding, hence they could find it difficult to survive while scavenging around as a common practice in rural children for the meager available food in the household, and communities. The scavenging character of those children exposes them to contamination from water and food, and the environment [52,88] These findings are consistent with those of Glover-Amengor et al [89] . Similarly, the rate of stunting remained high up to the age of 60 months. These results are consistent with the findings of Benjamin-Chung et al. and Mbabazi et al., who further contend that the stunting could have been attributed to longterm nutrition deprivations of the children during their first 1000 days after birth [86][87] .
Underweight among infants and children
We used weight-for-age (WAZ) as an indicator to determine the body mass of children in their respective age groups, an indication of acute and chronic undernutrition [12,[69][70][71] The results showed that 22.7% of the 515 children were affected, still a proportion more than double the national average at 11.0% in 2016 [85] which reduced to 10% in 2022 [12] . Though not statistically significant, more females were found to be underweight (22.8%) than males (22.6%), consistent with the findings of Moshi et al. in Tanzania [90] Just like stunting, underweight was also found to increase with the age of children and peaked at 36-47 months. There were significant differences observed where the cohort of 36-47 was most affected, followed by 24-35. The former and the latter were statistically different from each other, while both were different from the rest of the cohorts (excluding 0-5 for having no underweight, and their sample was too small, with only three babies); these showed no differences among them. The reason for high proportions of underweight could be because, in addition to food insecurity of different forms [5960] there was a high prevalence of sicknesses such as malaria and diarrhea in this population, which may have been aggravated by inadequate and poor sanitation facilities [51][52] a similar finding with other studies [89][90][91][92] . There was no significant association between underweight with reference to participation status of households. However, more underweight (24.0%) children were found among the non-participants, whereas NEC clients had (23.4%) and non-NEC clients (16.1%). Regarding graduation status, there were more underweight (28.0%) among the active children at the NEC than among the graduated and those who had never been at the NEC. Active children are among the malnourished who were undergoing rehabilitation at the NECs [43,[49][50] . By means comparison, we found similar significant differences where active children (-1.33 a ±1.27) at the NEC were different from the graduated, but the graduated (-0.93 b ±1.26) and the non-NEC (-1.05 a,b ±1.41) were the same. These results were expected at the NEC since NECs are rehabilitation homes for mothers and children who are at risk for malnutrition [49] Other than those children born from the NEC by mothers who were already enrolled in the rehabilitation program, all other children are enrolled with various forms of undernutrition. Therefore, finding an underweight child at the NEC can be a function of how long the enrolled underweight child has been at the NEC [49] These children are usually rehabilitated for up to six months or as needed, depending on their malnutrition severity. The primary caretakers of the graduates are certified by the program and enrolled in food and nutrition stability programs, including support groups and income innovations [22,56] The mothers also continue to participate in other programs such as livestock [42] agronomy and postharvest [31] nutrition and infant feeding [51] and public health education [52] .
To differ from stunting that may have gene associations [93] and with the parents [94] underweight is more nutrition deficiencies [95][96] This situation explains why most of the households that reported having experienced kwashiorkor and marasmus among their children are at the NEC for rehabilitation [51] .
Wasting among infants and children
We used weight-for-height (WHZ) to measure children's body mass in relation to their height or recumbent length for infants [69][70][71] The overall percent of wasted children of 16.7% of the 515 was four times the national average at 4% in 2016 [12] and 3% in 2022 [12] Wasting was the lowest indicator of undernutrition among children compared to underweight and stunting. Wasting directly correlates with food insecurity, describing the failure to receive proper feeding, especially in periods of food scarcity. In this population, it was reported that most households were food insecure [59] with low diet and caloric intake [60] A similar food insecurity was found in the neighborhood districts of our study area [77][78][79] .
Other than local food insecurity [16,[59][60][61][77][78][79] global food insecurity [15,19] economic contraction [97] global polices on humanitarian aid [98] the prevalence of disease among the households including WASH-related malaria, dysentery, and diarrhea [52] and nutrition-related like kwashiorkor and marasmus [51] have shown to be another main cause of wasting among children under five years within this survey. By gender, it was found that more males were wasted (18.4%) than females (15.0%), and the difference between them was statistically significant. Glover-Amengor et al [89] also found that boys were more likely to be too thin for their weight than girls in Ghana. In a narrative review to assess why boys are more undernourished than girls, Thurstans et al [99] found that boys experience undernutrition in periods of food deprivation, liked low-income situations more vulnerable to infectious diseases, childcare practices that favor girls. Wasting further depicted an "N" trend, it starts high and lowers, again rises, significant to note here is the rise (other than the age cohort of 0-5 months), between 6-11 months, a window period when infants are beginning to eat solid foods to supplement breast milk. The 6-11 months age group is a risk period of children contracting diseases related to food contamination, such as diarrhea [52] and a window of change in feeding habits to start up complementary weaning foods, resulting in stomach complications. These findings echo earlier findings of Cohen et al [100] In its path, wasting relatively follows the path of underweight peaking at 36-47 months, a period when children are adapting to leave independence with breastfeeding. Mertens et al. also found that wasting occurs multiple times and warned that early episodes of wasting at less than six months influence later episodes and mortality [101] .
Wasting was more among the non-NEC program participants (17.9%) and NEC clients (17.2%), and statistically lower among the non-participants. Significantly still, there were more wasted children among the actively participating children in the rehabilitation program than the graduated (16.0%), and those who never attended the NEC (15.8%). These results were further expected as children at the NECs are under rehabilitation for malnutrition [43,[49][50] but further management interventions post-rehabilitation are needed to sustain the gains [22,56] .
Association Between Mothers' and Children's Nutrition
Health: Children's nutrition status was expected to have an association with their mother's nutrition status, practices, and other household characteristics. As reported, the analysis showed an association that more stunted children (44 [102103] Similarly, in Uganda, the UDHS reported that thin or underweight mothers were more likely to have stunted children (34%) compared to normal (29%) and overweight (23%) [85] .
As discussed earlier, with the caretaker's BMI and food security, the education of the primary caretaker has a positive association with children's nutrition status. Most caretakers were found within an average of six years of education. 37.2% were likely to have stunted children compared to 31.1% with at least seven years; similarly, they were 22.0% likely to be underweight than 18.9%. Therefore, it can be adduced that the education of the primary caretaker has a direct influence on the nutritional status of the children. UBOS and ICF [85] reported that the proportion of stunted children decreases with an increase in the education level of the primary caretakers. Shroff et al. affirm that women who participate in decision-making because of their intellect reported fewer incidences of underweight and wasting among their children [104] An educated caregiver in a household can amicably resolve issues of discrimination that may arise among children.
A meta-analysis of 45 low-middle-income countries also confirms that the low education level of the caregivers significantly contributes to child undernutrition [105] Adult learning about maternity, nutrition, and infant feeding programs has a positive impact on improving child and household nutrition and feeding practices [51,83,[106][107][108] . Also, the poor antenatal practices of mothers, with between 20-30 percent of them visiting the antenatal clinic less than four times, a minimum suggested by Lincetto et al [76] can be one of the causes of poor health. Health care practices and quality during the antenatal period are very significant to the outcome of pregnancy, which improves the maternal health of mothers and improves the child survival rate [109][110][111] . Maternal mortality is a big challenge, i.e., the deaths that happen during pregnancy or a "woman's death due to a pregnancy-related issues during pregnancy or a year from its termination or due to an existing condition exacerbated by pregnancy" (p. 40) [112] This survey found that 2.5% of 443 mothers experienced childbirth mortality. In Uganda, a high mortality was reported in the recent demographic survey of 2022. The rate of maternal mortality was 189 deaths, and pregnancy-related mortality was 228 deaths per 100,000 live births [12] Expectant mothers are further at risk with challenges associated with medical supplies [113] There is a need for efforts to enhance the policy and structural functionality of maternal programs [14,114] . In a similar practice that predisposes mothers to risks of nutrition and maternal health insecurities, women are giving birth using non-recommended ways and places. Data reports that over 10 percent of mothers gave birth by or using or with the help of traditional attendants, at home with relatives, with other means, including their own help at birth. Given the early childhood age, all these childbirth means do not help in cases of complications where the mother fails to deliver normally, or in cases of mothers with HIV/AIDS [115][116][117] the chances of transmission of the virus are high to the baby; the sanitation of the place can lead to contraction of tetanus [118] .
Conclusions
This study assessed the nutritional health status of children (0-59 months of age) and their primary caretaker in Kamuli district, Uganda, where the Center for Sustainable Rural Livelihoods and Iowa State University Uganda Program implement a livelihood program towards ending hunger and poverty. The study sought to understand the programs' impact and facilitate program planning for improvements. We compared the nutritional health status of the primary caretakers and children by their affiliation with the nutrition education centers (NECs) and participation in the livelihood education programs (LEPs).
Nutrition and Health Status of Mothers
Most of the mothers were healthy irrespective of their affiliation with the NEC program. However, the NEC clients were below the overall mean, tending toward underweight; non-NEC who are program participants were within the overall mean, and the non-participants were above the overall mean, tending towards overweight. However, the proportion of mothers among the NEC and non-participants was equal and higher than non-NEC who are participants. There were more underweight mothers among the NEC clients, whereas the other two participants had almost equal proportions. There were more overweight caretakers among the non-NEC who are program participants, and nonprogram participants. A comparison with the baselines showed that there were improvements in the health of mothers, but these were not statistically significant.
The study established an association between underweight and the age at first pregnancy of the mother. The NEC clients and non-participants had the lowest age below the overall mean and were more likely to be underweight, and both showed statistically significant differences from non-NEC participants who are program participants. We also found that the education of the caretaker had significant differences. NEC clients have fewer years of formal education than the other categories, and this could probably account for the high rates of underweight among the NEC clients. Education can determine economic status, the kind of job, and so does income. Also, well-educated caretakers can be able to have better-planned diets for their households, taking into consideration the principles of a balanced diet [51,119] .
Nutrition and Health Status of Infants and Children of 0-59 Months of Age:
In infants and children, stunting (37.1%) was the most severe form of undernutrition, and males were more affected than girls. Stunting increased with age and peaked at 24-35 months and remained high. Nonprogram participants had a high proportion of stunted children, followed by NEC clients, and non-NEC who are program participants, who had the least. We found significant associations between the nutritional health of caretakers and their children. Stunted children were significantly associated with underweight caretakers or mothers.
In addition to stunting, underweight among children was the second severe form of undernutrition (22.7%) and affected more females than males. Underweight increased with age and peaked at 36-47 months, but significantly decreased afterward. Underweight cases were more common among the non-program participants in the NEC, followed by the NEC clients, and non-NEC who are participants had the least effect. Just like stunting, underweight caretakers or mothers were significantly associated with underweight children.
Relatedly, wasting among children was the least severe case of undernutrition (16.7%), affecting more males significantly than females. Wasting, unlike stunting and underweight, started high and lowered with age, then increased (36-47 months) and lowered afterward. Mertens et al. found similar results of higher episodes of wasting and stated that there is a likelihood of multiple wasting episodes among those who had earlier experienced them [101] Among participants, wasting was found to be higher among the non-NEC who are program participants, followed by NEC clients, and least effect on the non-participants.
Recommendations
Households should be encouraged to participate in water and public health [52] maternal, nutrition, and infant feeding education [51] and complementary service programs [43,49] In these educational programs, there is a need for more collaboration with health workers and village health trainers to educate and encourage households to adopt improved maternity practices and monitoring of children. For instance, the survey revealed that the number of antenatal clinic visits reduced with an increase in the number of children born to the same mother, with reference to the last four children born to the same mother. Additionally, fostering child spacing and family planning, as well as limiting the number of children born in households. The dependency ratio was high at an average of six, which was above the national average of five in two census periods [16, 85] Given the low food security [59] and dietary diversity [60] statuses in this population, the burden of undernutrition was found to be shifted to the NEC services for rehabilitation [43,49] An association was established between membership in NEC as a component of CSRL/ISU-UP with several children of 0-59 months. For children's health, the CSRL/ISU-UP program has invested in rehabilitation and weaning through the NECs with promising results [43,49] but there were high rates of
relapse. These relapses suggest a need for collaboration in the monitoring and enforcement of maternal and nutrition practices among graduates between the program, the government through its village health trainers, the local council, and cultural leaders. Also, encourage graduated/rehabilitated mothers to participate in food and nutrition safety net and stabilization programs, including income innovations and technical support groups [22,56] Also, mothers should continue participating in other food security programs, including agronomy and postharvest [31] and livestock programs [42] to acquire knowledge for improved food production.
Participants in these programs were food secure [59] and with better diets [60] within this population. The proportion of severe cases of undernutrition was high, and when merged, both program participant non-NEC clients and non-program participants doubled the number of undernourished children at NECs. This scenario suggests that the malnutrition rates were higher within the operational areas of the program, especially among the households not affiliated with the NECs. Probably the affected households had limitations with distance to reach the rehabilitation centers, suggesting a need for the program to expand within its operational areas. Additionally, with additional funding, the NECs' approach could be adopted by the immediate neighboring districts of Jinja [77] and Buyende [78][79] with high rates of food insecurity, a likely precursor of malnutrition.
References
118 in the original paper- United Nations. Transforming our world: The 2030 Agenda for Sustainable Development. Department of Economic and Social Affairs, United Nations. 2015.
- World Health Organization. Nutrition for health and development: A global agenda for combating malnutrition. Geneva, Switzerland. 2000.
- World Health Organization. Joint WHO/FAO Expert Consultation on Diet nutrition and the prevention of chronic diseases, Geneva, Switzerland. 2003.
- Copenhagen Consensus Center. Copenhagen Consensus: The results. Copenhagen Consensus Center USA, Inc. 2004.
- Museveni Y. What is Africa's problem? University of Minnesota Press; 2000.
- Ministry of Agriculture, Animal Industry and Fisheries and Ministry of Health. Uganda food and nutrition policy. Kampala, Uganda. 2003.
- Ministry of Agriculture, Animal Industry and Fisheries and Ministry of Health. The national food and nutrition strategy. Kampala, Uganda. 2005.
- Ministry of Agriculture, Animal Industry and Fisheries and Ministry of Health. Uganda food and nutrition strategy and investment plan: Draft final. Kampala, Uganda. 2004.
- Ministry of Finance, Planning and Economic Development. Poverty Eradication Action Plan -PEAP (2001) Vol. 1. Kampala, Uganda. 2001.
- Ministry of Health. Health Sector Strategic & Investment Plan: Promoting people's health to enhance socio-economic development, 2010/11 -2014/15.
- Kampala, Uganda. 2010.
- Uganda Bureau of Statistics. Uganda demographic and health survey 2022. Kampala, Uganda. 2023.
- African Union. (2014). Malabo Declaration on accelerated agricultural growth and transformation for shared prosperity and improved livelihoods. Twentythird Ordinary Session of the AU Assembly in Malabo, Equatorial Guinea, 26-27 June 2014.
- Office of the Prime Minister [OPM]. (2020). Uganda Nutrition Action Plan (2020-2025): Leaving no one behind in scaling up nutrition actions. Kampala, Uganda.
- Wiemers M, Bachmeier M, Hanano A, Chéilleachair RN, Vaughan A, Foley C, et al. Global hunger index: How gender justice can advance climate resilience and zero hunger. Welthungerhilfe, Concern Worldwide, & IFHV; Bonn/Berlin/Dublin/Bochum. 2024.
- Uganda Bureau of Statistics. The national population and housing census 2024 -Final report. Kampala Uganda. 2024.
- Akumu G, Ogenrwoth B, Mugisha J, Muyonga JH. Dietary patterns in Uganda and their influencing factors: a critical review. African Journal of Food, Agriculture, Nutrition and Development. 2023;23(2):22328-53.
- Ogenrwoth B, Akumu G, Mugisha J, Muyonga JH. Nutritional status research in Uganda: A critical review and trend analysis. African Journal of Food, Agriculture, Nutrition and Development. 2022;22(8):21243-68.
- FAO, IFAD, United Nations Children's Fund, WFP, & WHO. The state of food security and nutrition in the World 2025 -Addressing high food price inflation for food security and nutrition. Rome, Italy. 2025.
- Butler LM, McMillan DE, eds. Tapping philanthropy for development: Lessons learned from a public-private partnership in rural Uganda. Sterling, VA: Kumarian Press; 2015.
- Ikendi S, Retallick MS. Strategic leadership and management of multistakeholder organizations. Journal of Agricultural Education. 2025;66(2):9.
- Ikendi S, Mwenyi RM, Retallick MS. Love for humanity and universal goodwill: reflections on philanthropy through theory of change and the United States land grant values in Uganda. 2025;8(9):322-336.
- Thurow R. Against the grain: How farmers around the globe are transforming agriculture to nourish the world International Journal of Agriculture and Nutrition https://www.agriculturejournal.net and heal the planet. St. Paul, MN: Midway Books; 2024.
- Butler ML, Acker GD. Epilogue: The partnership today and looking towards the future. In: Butler LM, McMillan DE, eds. Tapping philanthropy for development: Lessons learned from a public-private partnership in rural Uganda. Sterling, VA: Kumarian Press; 2015:255-268
- Acker DG, Musoke HK, Sseguya H. Capitalizing on impacts & CSRL's multiplier effects. Tapping philanthropy for development: Lessons learned from a public-private partnership in rural Uganda. Sterling, VA: Kumarian Press; 2015:223-254.
- Sseguya H, Mazur RE, Masinde D. Harnessing community capitals for livelihood enhancement: Experiences from a livelihood program in rural Uganda. Community Development. 2009;40(2):123-138.
- Sseguya H, Mazur RE, Wells B, Matsiko F. Quality of participation in community groups in Kamuli District, Uganda: Implications for policy and practice. Community Development. 2015;46(1):14-25.
- Masinde D, Butler ML, Mazur R. Getting started. In: Butler LM, McMillan DE, eds. Tapping philanthropy for development: Lessons learned from a public-private partnership in rural Uganda. Sterling, VA: Kumarian Press; 2015:57-81.
- Ames, Iowa: Iowa State University Digital Repository; 2021.
- Ames, Iowa: Iowa State University Digital Repository; 2023.
- Wokibula RA, Akitwine F, Mtama JG, Burras LC. Cation exchange capacity within and between pedons of the Kamuli catena, Busoga sub-region, Uganda [online presentation]. Presented at: ASA Annual Meeting; 2024 Nov 10-13;
- Ikendi S, Owusu F, Masinde D, Oberhauser A, Bain C. Assessment of agronomy, agroforestry, orchards, grain storage, and postharvest education programs on empowerment of farmers in rural Uganda. Journal of Agricultural Education. 2024;65(1):99-125.
- Kwikiiriza, S. Evaluation of horticultural practices for tropical squash production and marketing among smallholder youth farmers in Kamuli, Uganda [Master's thesis] Iowa State University]. Ames, Iowa: Iowa State University Digital Repository; 2022.
- Tusiime SM, Nonnecke GR, Jensen HH. Tomato seed value chain analysis and seed conditioning among seed companies in Uganda. International Food and Agribusiness Management Review. 2020;23(4):501514.
- Tusiime SM, Nonnecke GR, Masinde DM, Jensen HH. Evaluation of horticultural practices for sustainable tomato production in Eastern Uganda. HortScience. 2019;54(11):1934-1940.
- Ikendi S, Retallick MS, Nonnecke GR. Implementing global service-learning through school gardens. The Agricultural Education Magazine. 2023;95(6):25-28.
- Bbosa D, Brumm TJ, Bern CJ, Rosentrater KA, Raman DR. Effect of blending amaranth grain with maize kernels on maize weevil control during storage. Transactions of the ASABE. 2020;63(2):401-406.
- Bbosa D, Brumm TJ, Bern CJ, Rosentrater KA, Raman DR. Evaluation of hermetic maize storage in 208-liter (55 gallon) steel barrels for smallholder farmers. Transactions of the ASABE. 2017;60(3):981-987.
- Brumm TJ, Bern CJ, Webber DF. Hermetic storage of maize grain in repurposed food oil containers to control maize weevils. Journal of Stored Products and Postharvest Research. 2021;12(2):42-46.
- Mayanja IK, Kigozi J, Kawongolo JB, Brumm TJ. Design, fabrication and testing of a pedal operated maize grain cleaner. Journal of Advances in Food Science & Technology. 2018;5(3):105-11.
- Tumutegyereize P, Oluk I, Kigozi J, Mayanja I, Buyinza T, Mbeiza M. Assessing the effect of access on the use of improved seed cleaning technologies: Challenges and opportunities among farmers in the Kamuli District, Uganda. International Journal of Postharvest Technology and Innovation. 2022;8(23):243-256.
- Ikendi S, Owusu F, Masinde D, Oberhauser A, Bain C. Livestock extension education: A livelihoods revitalization strategy in rural Uganda. Journal of Agricultural Education. 2025;66(1):50.
- Masinde D, McMillan ED, Rothschild M, Nonnecke G. Leaving the door open to emerging needs and opportunities. In: Butler LM, McMillan DE, eds. Tapping philanthropy for development: Lessons learned from a public-private partnership in rural Uganda. Sterling, VA: Kumarian Press; 2015:145-164.
- Byaruhanga LA, Masinde DM, Nonnecke GR, Lutwama D, Kimiywe J, Nyangaresi DM. Effect of school garden food production on nutrient adequacy of school meals for children attending Namasagali primary school in rural Kamuli district, Uganda. International Journal of Food Science and Nutrition. 2017;2(4):114118.
- Ikendi S. Developing school-based agriculture education through school gardens [poster presentation]. In: National AAAE Conference; 2022 May 16-19;
- Ikendi S, Retallick MS, Nonnecke GR, Kugonza DR. Influence of school garden learning approach on academic development of global service-learners. Journal of Agricultural Education. 2023;64(4):159-179.
- Nonnecke G, McMillan DE, Kugonza D, Masinde D. Leaving the doors open to new beneficiaries. In: Butler LM, McMillan DE, eds. Tapping philanthropy for development: Lessons learned from a public-private partnership in rural Uganda. Sterling, VA: Kumarian Press; 2015:165-189.
- Nyarko, D. A., and Masambuka-Kanchewa, F. Exploring factors influencing Ugandan youths' engagement in agricultural careers: A case study of Kamuli district in Uganda [Poster proceedings, pp. 3840]. In: Association for International Agricultural and Extension Education Annual Conference; 2025, April 14-17; Inverness, Scotland.
- Ikendi S, Owusu F, Masinde D, Oberhauser A, Bain C. Nutrition education centers: A community-based approach to management of malnutrition. Journal of Agriculture, Food Systems, and Community Development. 2023;13(1):9-15.
- Winham DM, Masinde D, Byaruhanga L, Nonnecke G, Rothschild M. Improving accessibility and quality of nutrition and health care in Kamuli district, Uganda. The FASEB Journal. 2016;30(674.27).
- Ikendi, S, Owusu, F, Masinde, D. Fostering behavioral change in maternal practices through nutrition and infant feeding education programs in rural Uganda. International Journal of Obstetrics and Gynecological Nursing. 2025;7(10): Part B.
- Ikendi S, Masinde D, Owusu F. Toward sustainable community health through participatory water and public health education programs in Southeastern Uganda. International Journal of Health Sciences and Research. 2025;15(1):9. 284-304.
- Nabwiire L, Shaw A, Nonnecke G, Talbert J, Muyanja C, Boylston T, et al. Compliance with food safety standards by beef vendors at butcheries in Kamuli district, Uganda. African Journal of Food Science. 2023;17(9):192-206.
- Ssabika G, Buyinza T, Brumm T, Byakika S, Mukisa IM. Microbiological safety and nutritional adequacy of composite porridge flour used in a selected school feeding program in Kamuli District, Uganda. European Journal of Agriculture and Food Sciences. 2024;6(2):60-66.
- Ames, Iowa: Iowa State University Digital Repository; 2019.
- Martin T. Individual capacities (human capital) of the Tusubila crafts group [master's thesis]. Ames, Iowa: Iowa State University Digital Repository; 2018.
- Ong KI, Sakamoto JL, Jimba M. Positive deviance leading and coping with social change. In The Palgrave handbook of global social change 2023(pp. 1-12). Cham: Springer International Publishing.
- Ajzen, I., & Schmidt, P. Changing behavior using the theory of planned behavior. In M. S. Hagger, L., Cameron, K. Hamilton, N. Hankonen, and T. Lintunen (Eds.), (2020). The handbook of behavior change (pp. 1731). Cambridge University Press. 2020.
- Ikendi S, Owusu F, Masinde D, Oberhauser A, Bain C. Does participation in livelihood education programs impact household food security? A comparative study in rural Uganda. Journal of Agriculture, Food Systems, and Community Development. 2023;13(1):235-265.
- Ikendi S, Owusu F, Masinde D, Bain C, Oberhauser A. Food insecurity coping strategies among households with average dietary diversity and caloric intake scores in rural Uganda. Journal of Agriculture, Food Systems, and Community Development. 2025;14(4):245-278.
- Sseguya H, Mazur RE, Flora CB. Social capital dimensions in household food security interventions: Implications for rural Uganda. Agriculture and Human Values. 2018;35(1):117-129.
- FAO, IFAD, and WFP. The State of Food Insecurity in the World 2013. The multiple dimensions of food security. Rome, FAO. 2013.
- Anyanwu O, Ghosh S, Kershaw M, Cherinet A, Kennedy E. Dietary outcomes, nutritional status, and household water, sanitation, and hygiene (WASH) practices. Current Developments in Nutrition. 2022;6(4):nzac020.
- Blüher M. An overview of obesity-related complications: The epidemiological evidence linking body weight and other markers of obesity to adverse health outcomes. Diabetes, Obesity and Metabolism. 2025;27:3-19.
- Bakaloudi DR, Jeyakumar DT, Jayawardena R, Chourdakis M. The impact of COVID-19 lockdown on snacking habits, fast-food and alcohol consumption: A systematic review of the evidence. Clinical Nutrition. 2022;41(12):3038-45.
- Bradley, M., Ikendi, S., Rongerude, J., & Haddad, M. A. (2023b, May 15-18). Food as lived experience: A photovoice with high school students In: AAAE Conference; 2023 May 15-18; Raleigh, NC. pp. 516-519.
- Naghavi M, Ong KL, Aali A, Ababneh HS, Abate YH, Abbafati C, Abbasgholizadeh R, Abbasian M, AbbasiKangevari M, Abbastabar H, Abd ElHafeez S. Global burden of 288 causes of death and life expectancy decomposition in 204 countries and territories and 811 subnational locations, 1990-2021: a systematic analysis for the Global Burden of Disease Study 2021. The Lancet. 2024;403(10440):2100-32.
- Huber M, Knottnerus JA, Green L, Van Der Horst H, Jadad AR, Kromhout D, et al. How should we define health?. BMJ 2011;343:d4163
- Lele U, Masters WA, Kinabo J, Meenakshi JV, Ramaswami B, Tagwireyi J, Goswami S. Measuring food and nutrition security: An independent technical assessment and user's guide for existing indicators. Rome: Food Security Information Network, Measuring Food and Nutrition Security Technical Working Group. 2016;177.
- WHO Multicenter Growth Reference Study Group, & de Onis, M. WHO Child Growth Standards based on length/height, weight, and age. Acta Paediatrica. 2006;95:76-85.
- World Health Organization. Physical status: The use of and interpretation of anthropometry, WHO/FAO Expert Committee Technical Report Series 854. Geneva: 1995:161-212.
- Lee R., and Nieman D. Nutritional assessment. St. Louis, MO: Mosby-Year Book, Inc.; 1996.
- Van Tonder E, Mace L, Steenkamp L, TydemanEdwards R, Gerber K, Friskin D. Mid-upper arm circumference (MUAC) as a feasible tool in detecting adult malnutrition. South African Journal of Clinical Nutrition. 2019;32(4):93-98.
- Menard, S. Coefficients of determination for multiple logistic regression analysis. The American Statistician. 2000;54(1):17-24.
- Lincetto O, Mothebesoane-Anoh S, Gomez P, Munjanja S. Antenatal care. In J Lawn and K Kerber, editors, Opportunities for Africa's newborns: Practical data, policy and programmatic support for newborn care in Africa. 2006; p. 51-62. WHO, Geneva.
- Kalinaki H, Martianto D, Riyadi H. Food security and its determinants among rural households: A case study in Buwenge, Eastern Uganda. BIO Web of Conferences. 2025;171:03003.
- Nsabagwa M, Mwije A, Nimusiima A, Odongo RI, Ogwang BA, Wasswa P, et al. Examining the ability of communities to cope with food insecurity due to climate change. Sustainability. 2021;13(19):11047.
- Tugume P, Mustafa AS, Walusansa A, Ojelel S, Nyachwo EB, Muhumuza E, et al. Unravelling taboos and cultural beliefs associated with hidden hunger among pregnant and breast-feeding women in Buyende district Eastern Uganda. Journal of Ethnobiology and Ethnomedicine. 2024;20(1):46.
- Fink G, Sudfeld CR, Danaei G, Ezzati M, Fawzi WW. Scaling-up access to family planning may improve linear growth and child development in low and middle income countries. PLoS One. 2014;9(7):e102391.
- Atim E, Atukwase A, Kabahenda M. Complementary feeding and food handling practices among caregivers in a semi-urban setting in Northern Uganda. African Health Sciences. 2024;24(3):322-32.
- Kansiime E., Kabahenda MK, and Bonsi EA. Improving caregivers' infant and young child-feeding practices using a three-group food guide: A randomized intervention study in central Uganda. African Journal of Food, Agriculture, Nutrition and Development. 2021;21(4):1783417853.
- Nakakawa F, Mugisha J, Kaaya AN, Tumwesigye NM, Hennessey M. Nutrition education effects on food and nutrition security for women living with HIV/AIDS in Uganda. Food Policy. 2024;128:102715.
- Malual JD, Mazur RE. Social capital and food security in post-conflict rural Lira District, northern Uganda. Disasters. 2022;46(1):80-94.
- Uganda Bureau of Statistics (UBOS) and ICF. Uganda Demographic and Health Survey 2016. Kampala, Uganda: UBOS, and Rockville, Maryland, USA: UBOS and ICF. 2018.
- Benjamin-Chung J, Mertens A, Colford Jr JM, Hubbard AE, van der Laan MJ, Coyle J, et al. Early-childhood linear growth faltering in low-and middle-income countries. Nature. 2023;621(7979):550-7.
- Mbabazi J, Pesu H, Mutumba R, Bromley K, Ritz C, Filteau S, et al. Correlates of early child development among children with stunting: A cross-sectional study in Uganda. Maternal & child nutrition. 2024;20(2):e13619.
- Fauziah N, Aviani JK, Agrianfanny YN, Fatimah SN. Intestinal parasitic infection and nutritional status in children under five years old: a systematic review. Tropical medicine and infectious disease. 2022;7(11):371.
- Glover-Amengor M, Agbemafle I, Hagan LL, Mboom FP, Gamor G, Larbi A, et al. Nutritional status of children 0-59 months in selected intervention communities in northern Ghana from the africa RISING project in 2012. Archives of Public Health. 2016;74(1):12.
- Moshi CC, Sebastian PJ, Mushumbusi DG, Azizi KA, Meghji WP, Kitunda ME, et al. Determinants of underweight among children aged 0-23 months in Tanzania. Food Science & Nutrition. 2022;4:1167-74.
- Dassie GA, Chala Fantaye T, Charkos TG, Sento Erba M, Balcha Tolosa F. Factors influencing concurrent wasting, stunting, and underweight among children under five who suffered from severe acute malnutrition in low-and middle-income countries: a systematic review. Frontiers in Nutrition. 2024;11:1452963.
- Nadeem M, Anwar M, Adil S, Syed W, Al-Rawi MB, Iqbal A. The association between water, sanitation, hygiene, and child underweight in Punjab, Pakistan: an application of population attributable fraction. Journal of Multidisciplinary Healthcare. 2024;2475-87.
- Mweetwa MN, Haritunians T, Dube S, Chandwe K, Amadi B, Zyambo K, et al. Genetic variation in environmental enteropathy and stunting in Zambian children: A pilot genome wide association study using the H3Africa chip. Plos one. 2023 Sep 27;18(9):e0291311.
- Wu H, Ma C, Yang L, Xi B. Association of parental height with offspring stunting in 14 low-and middleincome countries. Frontiers in Nutrition. 2021;8:650976.
- Maniragaba VN, Atuhaire LK, Rutayisire PC. Undernutrition among the children below five years of age in Uganda: a spatial analysis approach. BMC Public Health. 2023;23(1):390.
- Yue T, Zhang Q, Li G, Qin H. Global burden of nutritional deficiencies among children under 5 years of age from 2010 to 2019. Nutrients. 2022;14(13):2685.
- Headey DD, Ruel MT. Economic shocks predict increases in child wasting prevalence. Nature Communications. 2022;13(1):2157.
- Cavalcanti DM, de Sales LD, da Silva AF, Basterra EL, Pena D, Monti C, et al. Evaluating the impact of two decades of USAID interventions and projecting the effects of defunding on mortality up to 2030: a retrospective impact evaluation and forecasting analysis. The Lancet. 2025;406(10500): 283-294.
- Thurstans S, Opondo C, Seal A, Wells JC, Khara T, Dolan C, et al. Understanding sex differences in childhood undernutrition: a narrative review. Nutrients. 2022;14(5):948.
- Cohen RJ, Brown KH, Dewey KG, Canahuati J, Rivera LL. Effects of age of introduction of complementary foods on infant breast milk intake, total energy intake, and growth: a randomised intervention study in Honduras. The Lancet. 1994;344(8918):288-93.
- Mertens A, Benjamin-Chung J, Colford Jr JM, Hubbard AE, van der Laan MJ, Coyle J, et al. Child wasting and concurrent stunting in low-and middle-income countries. Nature. 2023;621(7979):558-67.
- Black RE, Victora CG, Walker SP, Bhutta ZA, Christian P, De Onis M, et al. Maternal and child undernutrition and overweight in low-income and middle-income countries. The Lancet, 2013:382(9890), 427-451.
- D'Souza R, Horyn I, Pavalagantharajah S, Zaffar N, Jacob CE. Maternal body mass index and pregnancy outcomes: a systematic review and metaanalysis. American Journal of Obstetrics & Gynecology MFM. 2019;1(4):100041.
- Shroff MR, Griffiths PL, Suchindran C, Nagalla B, Vazir S, Bentley ME. Does maternal autonomy influence feeding practices and infant growth in rural India?. Social science & medicine. 2011;73(3):447-55.
- Chen S, Richardson S, Kong Y, Ma N, Zhao A, Song Y, et al. Association between parental education and simultaneous malnutrition among parents and children International Journal of Agriculture and Nutrition https://www.agriculturejournal.net in 45 low-and middle-income countries. JAMA Network Open. 2023;6(1):e2251727-.
- Kajjura RB, Veldman FJ, Kassier SM. Effect of nutrition education on knowledge, complementary feeding, and hygiene practices of mothers with moderate acutely malnourished children in Uganda. Food and nutrition bulletin. 2019;40(2):221-30.
- Mardani RA, Wu WR, Hajri Z, Thoyibah Z, Yolanda H, Huang HC. Effect of a Nutritional education program on children's undernutrition in Indonesia: A randomized controlled trial. Journal of Pediatric Health Care. 2024;38(4):552-63.
- Shimali F, Mangheni N, Kabahenda M. Nutrition education competencies of agricultural extension workers in Uganda. The Journal of Agricultural Education and Extension. 2021;27(4):535-52.
- Achola KA, Kajjo D, Santos N, Butrick E, Otare C, Mubiri P, et al. Implementing the WHO Safe Childbirth Checklist modified for preterm birth: lessons learned and experiences from Kenya and Uganda. BMC Health Services Research. 2022;22(1):294.
- Amouzou A, Barros AJ, Requejo J, Faye C, Akseer N, Bendavid E, et al. The 2025 report of the Lancet Countdown to 2030 for women's, children's, and adolescents' health: tracking progress on health and nutrition. The Lancet. 2025;405(10488):1505-54.
- Ghosh R, Otieno P, Butrick E, Santos N, Waiswa P, Walker D, et al. Effect of a quality improvement intervention for management of preterm births on outcomes of all births in Kenya and Uganda: A secondary analysis from a facility-based cluster randomized trial. Journal of Global Health. 2022;12:04073.
- Taher TM. Maternal mortality: What is the situation and the determinants? Journal for Medical Sciences. 2024;3(1):7.40-44.
- Turyamureba M, Yawe B, Oryema JB. Health care delivery system in Uganda: a review. Tanzania Journal of Health Research. 2023;24(2):57-64.
- Walugembe DR, Plamondon K, Kaharuza F, Waiswa P, Wylie L, Wathen N, et al. Exploring variations in the implementation of a health system level policy intervention to improve maternal and child health outcomes in resource limited settings: A qualitative multiple case study from Uganda. PLOS Global Public Health. 2024;4(11):e0003290.
- Buyinza T, Ssengooba F, Mayega RW, Mutyoba NJ, Warugaba BS, Mutole G, et al. Perceived risk for hypertension and associated factors among adult persons living with HIV in Kamuli district, Uganda. medRxiv. 2024.
- Nabatanzi M, Harris JR, Namukanja P, Kabwama SN, Nabatanzi S, Nabunya P, et al. Improving maternal and neonatal outcomes among pregnant women who are HIV-positive or HIV-negative through the Saving Mothers Giving Life initiative in Uganda: An analysis of population-based mortality surveillance data. PLOS Global Public Health. 2024;4(2):e0002801.
- Namara-Lugolobi E, Namukwaya Z, Owor M, Ouma J, Namale-Matovu J, Nakabiito C, et al. Twenty years of Prevention of Mother to Child HIV Transmission: research to implementation at a national referral hospital in Uganda. African Health Sciences. 2022;22(2):22-33.
- Abubakar B, Dunga J, B Jibrin Y, Maina H, G Buma B, Maigari I. ICU Management of Tetanus [Internet]. ICU Management and Protocols. IntechOpen; 2022.
- WHO and FAO of the United Nation. What are healthy diets? Joint statement by the Food and Agriculture Organization of the United Nations and the World Health Organization. WHO;2024.
Cited by 3
From OpenAlex, OpenCitations and reference lists read by Scinovex
- Service-learners today, friends forever: Alumni communities of practice manifested through social media communication
Samuel Ikendi, Reagan M Mwenyi, Michael S Retallick, Donald R Kugonza · International Journal of Agriculture Extension and Social Development · 2025
In the current digital climate, social media platforms have become indispensable communication tools, enabling alumni to maintain meaningful connections with colleagues across geographical and temporal boundaries. Maintaining communication with alumni is an asset to both their primary educational institutions—affiliated alma maters and their host organizations. This study evaluates the role of social media communication—Facebook platform in our study, in creating and sustaining communities of practice among global service-learning alumni from Iowa State University of the United States and Make
- Food and nutrition security support groups: A safety net strategy for sustaining livelihoods program gains in Uganda ↗
Moureen Mbeiza, Caroline Nambafu, David Banige, Samuel Ikendi, Dorothy Masinde, C. Lee Burras et al. · Journal of Agriculture Food Systems and Community Development · 2026
Introduction In 2015, world leaders set the target to achieve zero hunger by 2030 through the launch and operationalization of the Sustainable Development Goals (United Nations, 2015). However, progress reports show that the world is still off track, with projections indicating persistent hunger and malnutrition (Food and Agriculture Organization [FAO] et al., 2024; 2025). These reports are synonymous with the…
❝ 0PDF - Nurturing the Next Generation of Youth in Agripreneurship Leadership Through School-Based Agricultural Education Programs in Uganda ↗
Samuel Ikendi, Martin Kagoye, Reagan Mulungi Mwenyi, Brenda Asasira Kakungulu, Lilian Akello, Miriam Namata · Journal of Agricultural Education · 2026
The global agrifood system faces challenges from population growth, climate change, resource constraints, and evolving value chains, requiring new generations of agribusiness leaders. This descriptive study uses an experiential learning framework to explore how Youth Entrepreneurship Programs (YEP) foster youth agripreneurship leadership development. It examines School-Based Agricultural Education initiatives in eastern Uganda through the Center for Sustainable Rural Livelihoods and…
❝ 0PDF