
Research article · 2025 · Full text
International Journal of Geography Geology and EnvironmentBathymetric survey of the bottom of Al-Khasa Dam Lake - northeast of Kirkuk, Iraq
Volume 7(10) · Pages 91–99 · DOI: 10.22271/27067483.2025.v7.i10b.433 ↗
Research areasGroundwater and Watershed AnalysisFlood Risk Assessment and ManagementWater management and technologies
Abstract
Author-writtenWater is the backbone of human, animal, and plant life, and its presence in certain quantities is a necessity required by economic and population growth. Ancient civilizations were concentrated in areas where water is present, such as springs and rivers.A problem that exists in many dams in Iraq, especially in the northern regions (Al-Mamoori et al., 2019) [2], has been studied by Iraqi researchers. This problem is that some of the water evaporates or seeps into the soil, affecting the amount of water remaining in the lake (Jassim & Goff, 2006) [8]. Al_khasa dam lake, located northeast of Kirkuk city, is an important water collection site in this region. The dam was built to store rainwater and control floods, as well as to provide water for agriculture and other uses. It aims to study and measure the depths of various water bodies, such as lakes, rivers, seas, and oceans. This type of survey provides a comprehensive understanding of the topography of the water body's bottom and helps create accurate three-dimensional topographic maps of submerged areas (Philip et al., 1992) [10]. The current study examines the bathymetry of a particular lake and surveys the lakebed within the lake at depths of 15-30 microns. It found that the depths in the southeastern part are greater than those in the western part of the lake. This which indicates that this area represents the main course of the river valley before the construction of the dam. Also, the close proximity of the isobath lines on the eastern side indicates the presence of a steep bank, while the plans on the western side represent a more gentle gradual slope. This geomorphological contrast reflects a difference in the rock composition and geological structure of the layers composing the two sides of the valley (Werdy, 1997). The northeastern bank shows characteristics that are less resistant to erosion and weathering factors, compared to the southwestern bank. Contrasting between the two banks of the lake.
Summary
Source-checkedPlain-language reading of the full paper, prepared with AI and checked against the text. Each point links to the authors' own words.
Why it matters
- Water is essential for the survival of humans, animals, and plants, and is a critical requirement for population and economic growth. View evidence ↗
- Many dams in northern Iraq face issues where water is lost through evaporation or soil seepage, which reduces the total water volume in the lakes. View evidence ↗
- The Al-Khasa dam lake, located northeast of Kirkuk, serves as a vital site for flood control, rainwater storage, and agricultural water supply. View evidence ↗
The question
- The study aims to use a bathymetric survey to perform a geometric analysis of the lakebed and determine the overall shape of the lake. View evidence ↗
What they did
- Researchers used a HONDEX EchoSounder to measure depths and a GPS to establish the coordinates for the survey paths. View evidence ↗
- The survey was conducted along seven identified paths to ensure nearly complete coverage of the dam lake. View evidence ↗
- Data analysis and mapping were performed using Grapher v8.0 for graphical figures and Global Mapper v13.0 for plotting locations. View evidence ↗
What they found
- Lake depths range from 5 to 35 meters, with the deepest areas located in the eastern part of the dam and a sharp gradient moving west. View evidence ↗
- The eastern side of the lake features a steep bank, whereas the western side has a more gentle, gradual slope. View evidence ↗
- In a 90-meter longitudinal section (A-A), the maximum water depth reaches 35 meters on the eastern side of the reservoir. View evidence ↗
- In the 50-meter third cross-section (C-C), the maximum depth of 28 meters occurs 20 meters from the northern bank. View evidence ↗
- The sixth cross-section (F-F) reaches a maximum depth of 30 meters, maintaining a pattern where the southern bank is shallower than the northern bank. View evidence ↗
What it means
- The authors conclude that the lake's size and levels are relatively consistent, and the depth on the eastern side is significant compared to the western side. View evidence ↗
- The authors recommend conducting a precise triangular thalweg survey using an Echo Sounder to better understand changes in the lake's capacity. View evidence ↗
Visual summary
3 visualsIllustrations explain the paper; charts are replotted from the paper's own table values.
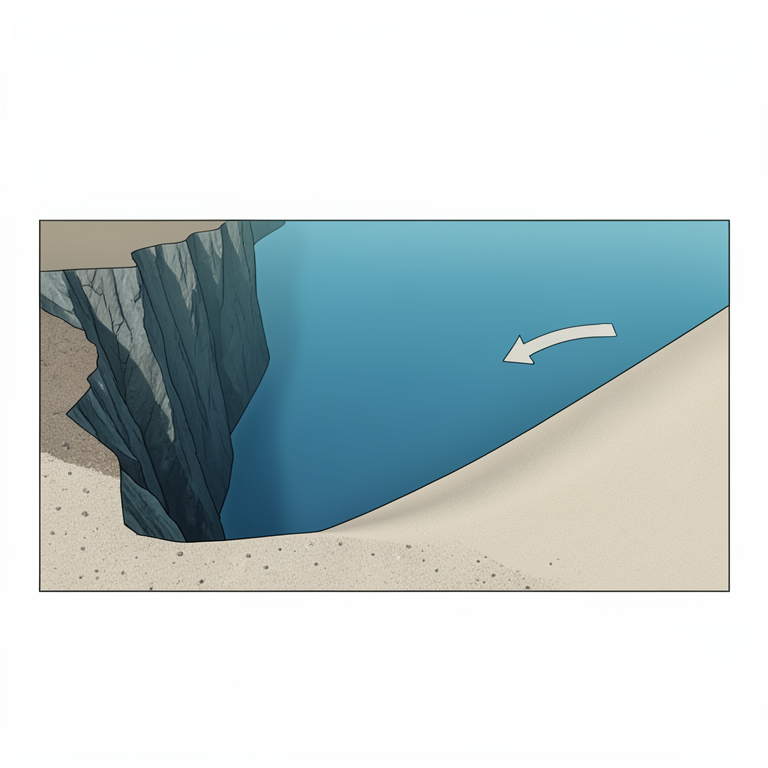
Lakebed Topography Contrast
AI-generated conceptual illustration (Al-Khasa Dam Lake bed). It explains the idea and does not show study data.
View source evidence ↗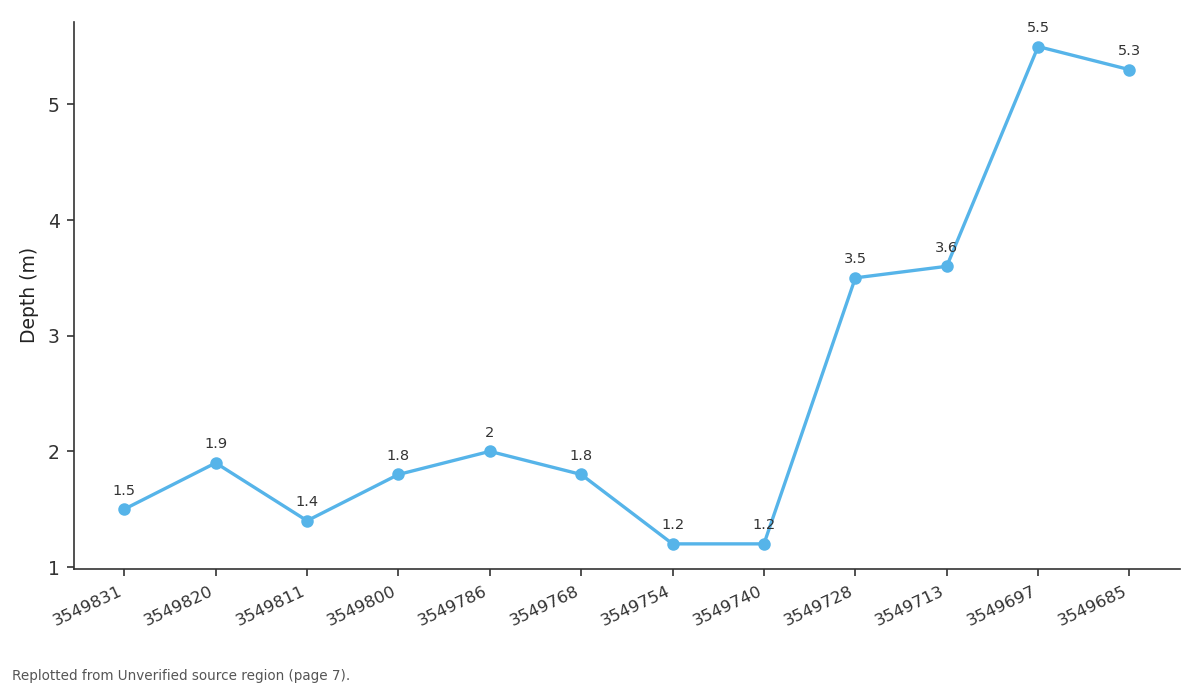
First track / Depth: 3549831 vs 3549820 vs 3549811 vs 3549800 vs 3549786
Replotted from a table (page 7) of the original paper. Every bar is the paper's own table value.
View source evidence ↗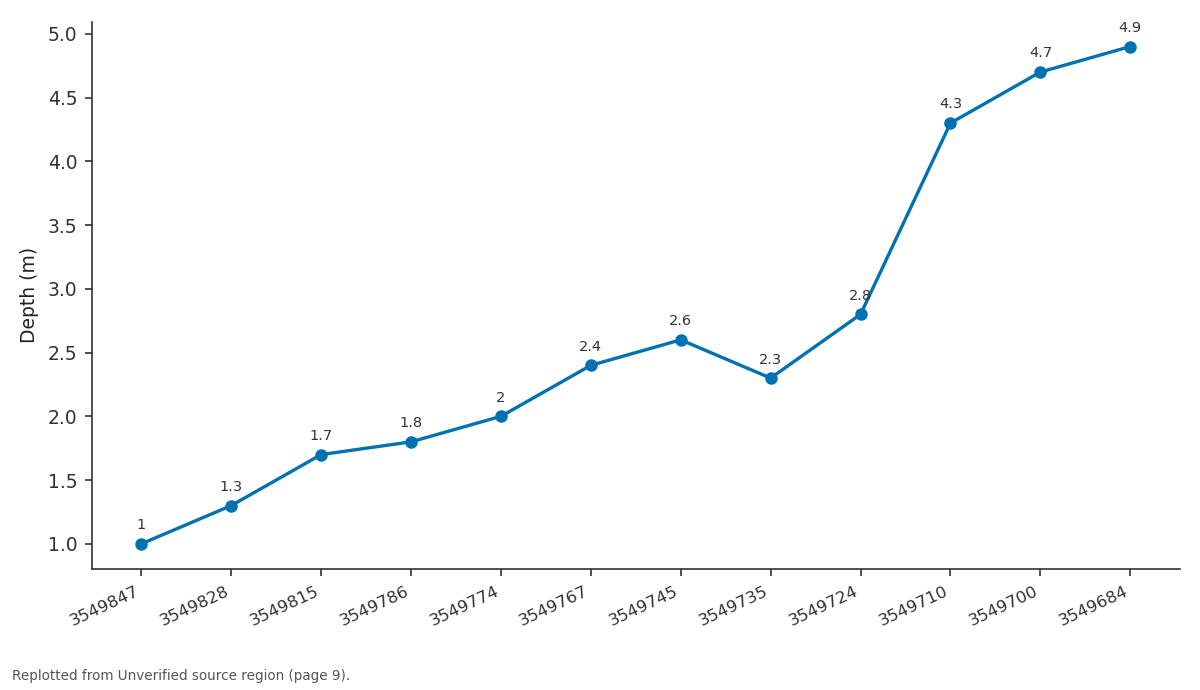
Seventh Track / Depth: 3549847 vs 3549828 vs 3549815 vs 3549786 vs 3549774
Replotted from a table (page 9) of the original paper. Every bar is the paper's own table value.
View source evidence ↗Figures & tables
From the original paper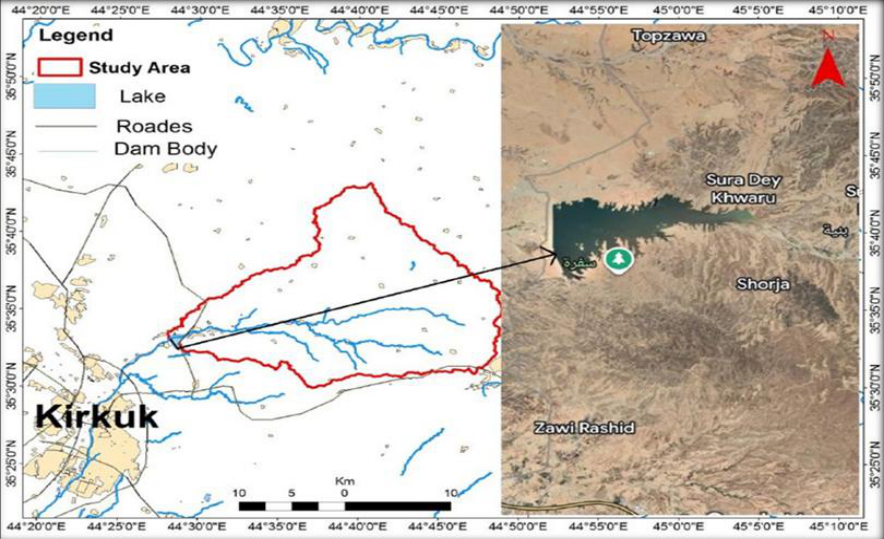 Figure 1
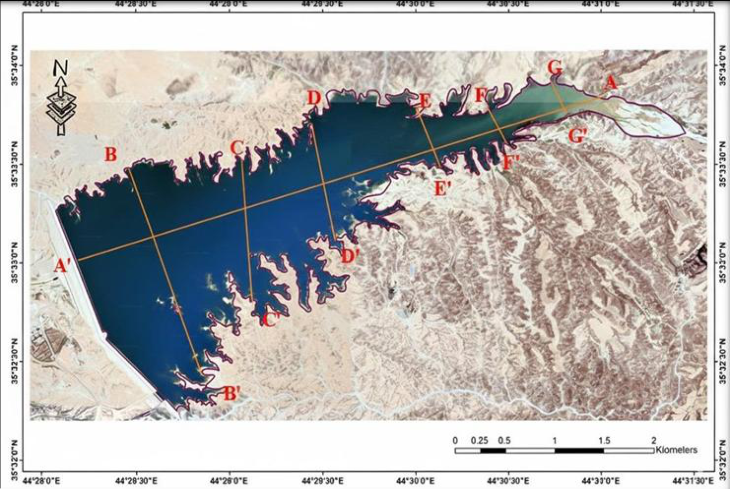 Figure 2
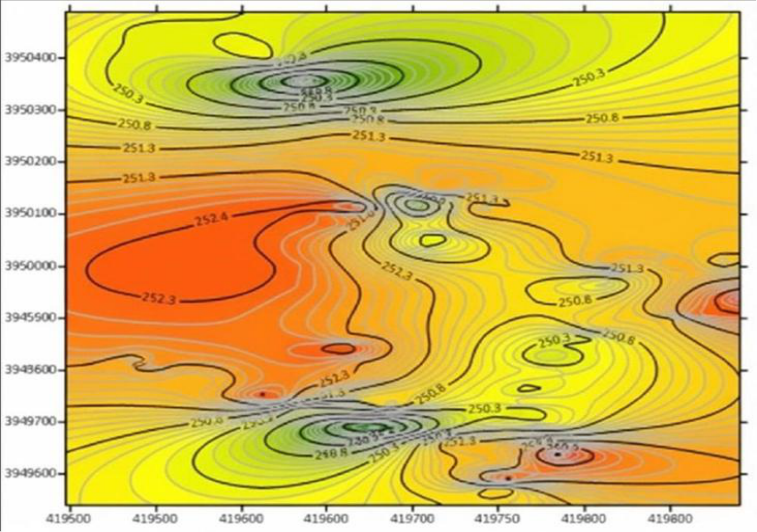 Figure 3
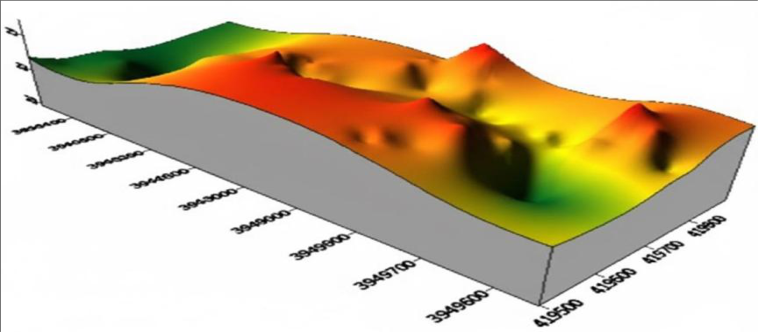 Figure 4
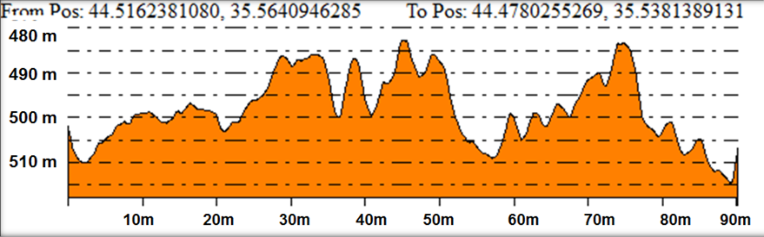 Figure 5
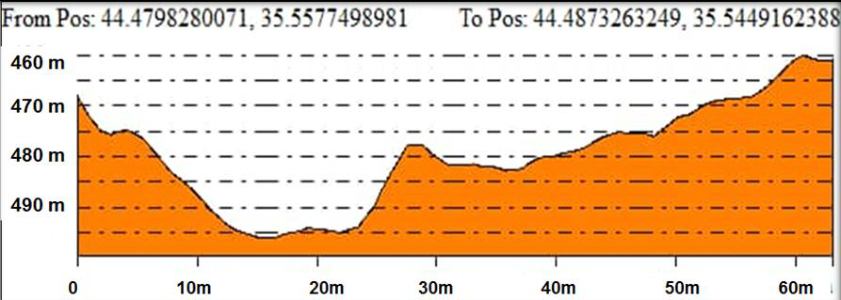 Figure 6
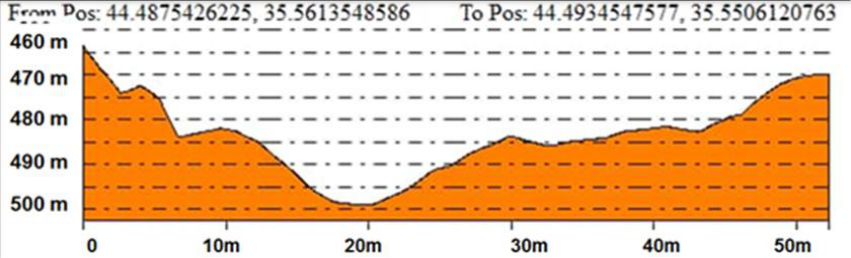 Figure 7
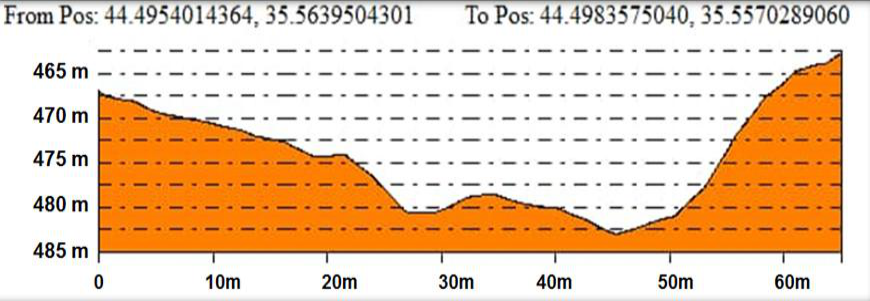 Figure 8
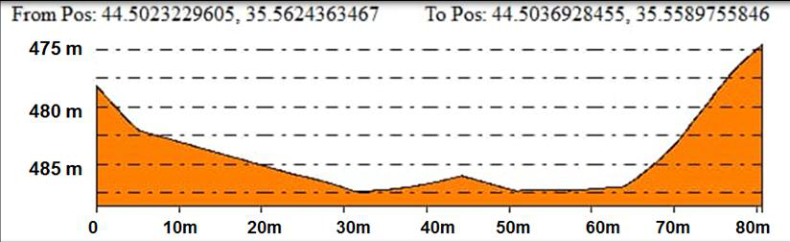 Figure 9
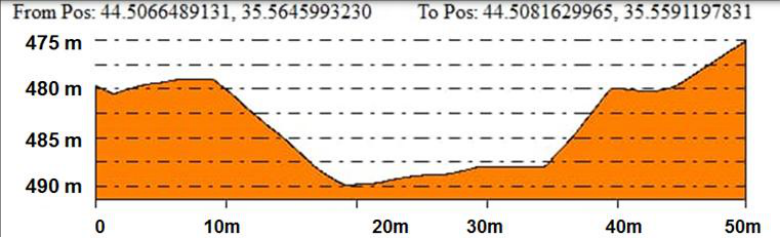 Figure 10
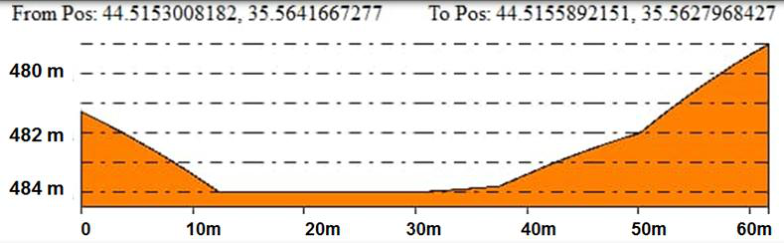 Figure 11
Introduction 1.1 Preface
Water is the backbone of human, animal, and plant life, and its presence in certain quantities is a necessity required by economic and population growth. Ancient civilizations were concentrated in areas where water is present, such as springs and rivers. A problem that exists in many dams in Iraq, especially in the northern regions (Al-Mamoori et al., 2019) [2] , has been studied by Iraqi researchers. This problem is that some of the water evaporates or seeps into the soil, affecting the amount of water remaining in the lake (Jassim & Goff, 2006) [8] . Al_khasa dam lake, located northeast of Kirkuk city, is an important water collection site in this region. The dam was built to store rainwater and control floods, as well as to provide water for agriculture and other uses. The aim of constructing the dam is to enhance the groundwater in the region and to improve the environment in this region in terms of attracting tourists and developing fish wealth and to secure drinking water for the northeastern part of the city of Kirkuk to cover the needs of (50) thousand people as well as to protect the city of Kirkuk from the dangers of floods and to add a storage annex to the reservoir of the Great Dam to release it when needed.
1-2 The aim of the study
The aim of the study is to conduct a geometric analysis of the lakebed to determine the shape of the lake using a bathymetric survey. This study is the first to calculate the lake's geometry.
Study Area and Methodology 2.1 Location of the study area for the Al_khasa lake dam
The study area is located northeast of Kirkuk Governorate, with coordinates of latitude (35°33′30″N) and longitude (44°28′30). It occupies an area of approximately 420 km². The study area is approximately (21) km from the center of Kirkuk city. The study area is bordered to the north and northeast by the northern Jamjamal Fold, to the northwest by the Shwan Sub-Basin, and to the west by the Khasah Dam (Al-Ghuburi, 2020) [1] .
Geology of the study area
Many geological formations are prominent within the study area, covering the region within a different topographic and geomorphological range. All of these formations belong to the Tertiary and Quaternary periods, which extend from the Miocene to the Pleistocene -Holocene. In general, the oldest rocks appear on the edges of the basin in which the study area is located, while modern sediments covered the middle of the basin.
Stratigraphy of the study area
The study area consists of several geological formations and the following is a description of these formations (Sissakian, V.k, 1992).
Injane Formation (Late Miocene)
The Injana Formation (Upper Fas) is part of the Tertiary geological age, and its stratigraphic location indicates an Upper Miocene age (Al-Naqib, 1959). It consists of mudstone, siltstone, and sandstone in the study area (Sissakian & Al-Jiburi, 2012) [12] . However, according to (Sissakian et al., 2017) [12] , the thickness of the formation is 398 meters. According to (Kassab and Jassim, 1980) [9] , the Injana Formation contains less information than the Muqaddadiya Formation. The Injana Formation comprises 0.94 square kilometers (0.223%) of the study area.
Muqdadiya Formation (Late Miocene-Pliocene)
The Muqdadiya Formation (Lower Bakhtiari) is considered to have formed during the Tertiary geological period. Using the stratigraphic location, deposits of pebbly sandstone, siltstone, and mudstone were found in the study area (Jassim et al. 1984) [7] (Al-Rawi et al. 1992) [4] . The thickness of the formation is 456 meters (Sissakian et al., 2017) [12] . The Muqdadiya Formation covers an area of 30.59 square kilometers (7.26%) of the study area.
Bai Hassan Formation (Pliocene-Pleistocene)
Using stratigraphic location, the Bai Hassan Formation (Upper Bakhtiari) was identified as belonging to the Pliocene-Pleistocene, a Tertiary geological epoch (Jassim et al. 1984) [7] and (Al-Rawi et al. 1992) [4] . The Bai Hassan Formation consists of sediments that include sandstone and mudstone found in the study area (Jassim et al. 1984 and (Al-Rawi et al. 1992) [7,4] . The thickness of the formation is (790) mm, and the study area comprises (354.74) square kilometers (84.46%) of the Bai Hassan Formation.
Quaternary (Middle Holocene)
This period is represented by the Quaternary sediments found in the research area. It is characterized by slope deposits containing fine clastic rock fragments, multiple deposits containing silty clay soils, and river terrace deposits with sandstone and mudstone. Quaternary sediments constitute 10% of the research area, equivalent to 12,272 square meters (Sissakian, 1992) [11] .
Tectonic and structural study area
According to the classification made by (Buday and Jassim 1987) [6] , in which the area was separated into a high folded zone and a foothill zone, the research is located within the unstable platform on which tectonics continues in the area. (Bolton, 1958) was the first to propose a foothill zone by virtue of (Doski and Ahmad, 2016).
Geomorphology of the Study Area
Rainfall is the sole source of water in the study area, falling annually during the winter and spring seasons. The area is characterized by a dendritic drainage system, named after the Greek word for "dendritic pattern" (dendron). The drainage pattern often tapers from the highlands toward the main river, or from the north and northeast to the western part of the study area. Weathering and erosion are also widespread in this area, significantly affecting the region. Sheet erosion affects almost all flat areas covered with various sediments. The degree of weathering varies depending on the rock types, and due to the diverse rock types present within the area, all degrees of weathering are present (Sissakian, 1992) [11] .
Topography of the Study Area
The study area contains several small valleys that flow into the main stream. Part of the surface water flows from the higher elevations in the north to the western part of the area, while the other part flows from the northeast of the study area to the western part, where the two sections of the valley meet at coordinates (3936202 East, 464719 North) near the dam.
Bathymetric survey of the lake bottom
Bathymetric surveying is one of the most important scientific techniques used in water sciences and hydrology. It aims to study and measure the depths of various water bodies, such as lakes, rivers, seas, and oceans. This type of survey provides a comprehensive understanding of the topography of the water body's bottom and helps create accurate three-dimensional topographic maps of submerged areas (Philip et al., 1992) [10] . The topographic sections were derived from the digital elevation model of the proposed reservoir at an elevation of (497-442) m above sea level, since the section at this level can give an image of the rest of the elevations in the same geographical location. The map shows an inhomogeneous distribution of elevations, which reflects the geomorphological complexity of the original water basin. While we find that the depths of the lake range between (5-35) m, and the deep areas are concentrated in the eastern part of the dam with a sharp gradient towards the west, which indicates that this area represents the main course of the river valley before the construction of the dam. Also, the close proximity of the isobath lines on the eastern side indicates the presence of a steep bank, while the plans on the western side represent a more gentle gradual slope. This geomorphological contrast reflects a difference in the rock composition and geological structure of the layers composing the two sides of the valley (Werdy, 1997). The northeastern bank shows characteristics that are less resistant to erosion and weathering factors, compared to the southwestern bank. Contrasting between the two banks of the lake. This process was conducted using a (HONDEX) (EchoSounder). A (GPS) was also used to determine the coordinates of the start and end points of each path. It was also used to determine additional coordinates, which were later used with other data, including depths, to draw crosssections and longitudinal sections and a contour map of the Al_Khasa dam lake. To conduct the survey of the reservoir bottom, a boat was used, traveling at a constant speed. Modern satellite imagery was also used to determine the paths to be followed during the survey. ( 7) paths were identified, the purpose of which was to cover the private dam lake almost completely. After the paths were identified, the survey was conducted. Several programs were used, including Grapher v8.0 for drawing only graphical figures, such as cumulative frequency curves, and Global Mapper v13.0 for plotting locations on the map. By identifying landmark points on the sides of the lake, Figure (1) shows various points and the names of survey lines. Cross and longitudinal sections were then drawn. The cross and longitudinal topographic sections of the reservoir bottom are very important in studying the geometric characteristics of the reservoir. The cross sections provide an idea of the reservoir's width and the variations in its depths relative to the banks. The longitudinal section, on the other hand, provides an idea of the variations in depth between the upstream and the dam.
Results and Discussion
The topographic sections indicate a fluctuation in the depth of the reservoir from one location to another, and that the depth on the northern bank is less than on the southern bank along the main part of the reservoir. This can be seen in Figure (2) and the three-dimensional figure (3), which were drawn based on bathometric survey data for the bottom of the lake reservoir. The slope of the river bed along this distance is evident in the first longitudinal section (A-A) in Figure (4). The length of the section is 90 meters, and the depth of the water at the deepest point reaches 35 meters on the eastern side of the reservoir. Then the depth begins to fluctuate between (5-30) meters at a distance of 50 meters from the eastern bank of the reservoir. Then the fluctuation decreases and is between (3-20) meters at a distance of (50-10) meters. Then the depth increases to 30 meters on the western bank. The fluctuation in depth at this section is due to the topography of the study area. As for the second section(B-B'), Figure (5), which is (1) km away from the dam body, and in the widest area of the lake's width, the length of the section reaches (60) m. It is noted that the depth is small at the edges, but it is deep on the northern bank, as it gradually increases to reach (35) m, which is the greatest depth at a distance of (15) m from the southern bank of the reservoir. The third cross-section (C-C), Figure (6), reaches a length of 50 m, and is similar to the cross-section (B-B'), but the northern bank is less deep than the southern bank, as the depth gradually increases to reach (28) m, which is the greatest depth at a distance of (20) m from the northern bank of the reservoir. As for the fifth cross-section (E-E) Figure (8), the length of the section reaches (80) m, and it continues to deepen in the middle compared to the edges of the lake reservoir, and the deepest point reaches (25) m, and also the southern bank is less deep than the northern bank of the lake. As for the sixth cross-section (F-F) Figure (9), which represents the narrow areas of the lake reservoir, the shape of the lake bottom continues to deepen in the middle of the section, while the edges are less deep, and the deepest point reaches (30) m, and in this section the southern bank is still less deep than the northern bank of the lake reservoir. While the seventh section (G-G) reflects Figure (10), the length of the section reaches (60) m, and here it is noted that the depths of the reservoir decrease to reach (16.5) m at the deepest point, in addition to the fact that the southern bank becomes less deep than the northern bank.
Conclusions and recommendations
Through a geometric study, it was concluded that the lake's size and levels are not significantly different, and the depth on the eastern side of the lake is essential for the western side. This is due to the water velocity, where fine sediments accumulate at the bottom of the lake on the eastern side. Through a study of the lake's basic geometric characteristics, it was determined that the lake is a special, branched, and elongated artificial dam lake with its own circulation. Through this study of its dam lake, and based on the information discussed and the indicators provided by these studies on the geology of the lake's water, the requirements were formulated, enabling us to gain confidence in the importance of the new relationships between the reservoir and the lake's superstructure. It is necessary to conduct a precise triangular thalweg survey using an Eco Sounder device, and we learned about the change in the lake's commercial capacity.
Acknowledgments
Praise be to God, and peace and blessings be upon the most honorable of prophets, his family, and all his companions. This research would not have been completed without the help of God Almighty, to whom I owe the greatest thanks and gratitude. First of all, I would like to express my thanks and gratitude to my esteemed professor, Professor Dr. Soran Nihad Sadiq, for suggesting the research topic and for his wise guidance throughout the research period. I also thank the head, professors, and staff of the Applied Geology Department. I also extend my sincere thanks to the Deanship of the College of Science for the facilities they provided me, which contributed to the completion of the research throughout the study period. Finally, a word of thanks to everyone who contributed to the success of this research. May God reward them on my behalf with all the best.
Appendices
Below is the data for the seven tracks surveyed by the lake bottom bathymetric survey.
Figures and tables from the paper
References
13 in the original paper- Al-Ghuburi MRG. Groundwater vulnerability and risk assessment of upstream Al-Khassa Dam Sub-basin, Kirkuk/NE Iraq [Master's thesis]. Kirkuk: College of Science, University of Kirkuk; 2020.
- Al-Mamoori SK, Abdulrahman SH, Ali NS. Sedimentation problems in dams in Iraq. Iraqi Journal of Civil Engineering. 2019;13(2):44-55.
- Al-Naqib KM. Geology of southern area of Kirkuk Liwa, Iraq. Tech. Publ., Iraqi Petroleum Company Ltd. 1959;50 p.
- Al-Rawi YT, Sayyab AS, Al-Jassim JA, Tamar-Agha M, Al-Sammarai AHI, Karim SA, Hagopian D. New names for some of the Middle Miocene-Pliocene formations of Iraq (Fatha, Injana, Mukdadiya, and Bai Hassan formations). Iraqi Geological Journal. 1992;25(1):1-7.
- Bolton C. Geological map, Kurdistan series, sheet 4 (Rania). Site Investigation Company. 1958;(276).
- Buday T, Jassim SZ. The regional geology of Iraq: Tectonism, magmatism and metamorphism. Vol. 2. Geological Survey and Mineral Investigation, Baghdad; 1987. 352 p.
- Jassim SZ, Karim SA, Basi MA, Al-Mubarak M, Munir J. Final report on the regional geological survey of Iraq. Vol. 3: Stratigraphy. GEOSURV Internal Report. 1984;(1447).
- Jassim SZ, Goff JC. Geology of Iraq. Ministry of the Czech Republic and Heritage Oil Company; 2006. 345 p.
- Kassab IIM, Jassim SZ. The Regional Geology of Iraq. Baghdad: General Directorate for Geological Survey and Mineral; 1980.
- Philip G, Eweida E, Al-Gamal S. Quantitative geomorphology of some watersheds in Wadi Qena in relation to basin hydrogeology. In: Proceedings of [unspecified publication]; 1992. p.159-164.
- Sissakian VK. The Geology of Kirkuk Quadrangle Sheet NI-38-2, scale 1:250000. Baghdad: GEOSURV; 1992.
- Sissakian VK, Al-Jibouri BS. Stratigraphy of the low folded zone. Iraqi Bulletin of Geology and Mining. 2012;(5):63-132.
- Werdi SN, Allah NS. Hydrological and sedimentary study of Lake Habbaniyah [Master's thesis]. Baghdad: University of Baghdad; 1997. 117 p.