
Research article · 2025 · Full text
International Journal of Geography Geology and EnvironmentSpatio-temporal analysis of forest cover in Dausa District, Rajasthan (2015-2024) using remote sensing and GIS Techniques
Volume 7(10) · Pages 62–66 · DOI: 10.22271/27067483.2025.v7.i10a.432 ↗
Research areasGroundwater and Watershed AnalysisRemote Sensing in AgricultureSoil and Land Suitability Analysis
Abstract
Author-writtenThe study examines forest-cover dynamics in Dausa District, Rajasthan, over a decade using Landsat‑8 surface reflectance data processed into annual NDVI composites. Its purpose is to develop cloud-free time-series data from 2015 to 2024, classify NDVI values into density‑based categories—very dense, dense, moderate, open and non‑forest—and map spatial-temporal changes in vegetation cover across the district. The authors downloaded and atmospherically corrected multi-temporal Landsat‑8 imagery within Google Earth Engine and applied NDVI calculations using near-infrared and red bands. Annual mean composites were then imported into ArcGIS to classify vegetation densities and assess changes. Results show that mean NDVI values ranged from sparse to dense vegetation, reflecting moderate greenness typical of semi-arid environments. Dense and moderately vegetated areas expanded slightly, while open and degraded scrub categories declined, yielding a net gain of approximately 60 km² of vegetated land between 2015 and 2024. Positive NDVI trends were observed in the southern uplands and eastern piedmont, associated with afforestation efforts and favourable rainfall, whereas negative trends occurred near urban fringes and mining clusters. The findings highlight how rainfall variability, geomorphology and human pressures jointly influence vegetation dynamics, demonstrating the value of remote sensing and GIS in guiding sustainable forest management.
Summary
Source-checkedPlain-language reading of the full paper, prepared with AI and checked against the text. Each point links to the authors' own words.
Why it matters
- Forests are critical ecosystems that maintain ecological stability and support both biodiversity and human livelihoods. View evidence ↗
- Western India, especially Rajasthan, faces challenges with low natural vegetation and high human-induced pressure. View evidence ↗
- In Dausa District, land cover has been altered by mining, infrastructure development, grazing, and agricultural encroachment. View evidence ↗
The question
- The study aims to analyze the spatial and temporal changes in forest cover in Dausa District between 2015 and 2024 using GIS and Landsat-derived NDVI. View evidence ↗
What they did
- The researchers used Landsat-8 OLI Collection-2 Level-2 Surface Reflectance data accessed through Google Earth Engine. View evidence ↗
- Vegetation was classified into five density categories based on NDVI values, ranging from non-forest (< 0.0) to very dense (> 0.70). View evidence ↗
- ArcGIS Pro 3.5 was used for the statistical processing and cartographic mapping of the annual NDVI composites. View evidence ↗
What they found
- The total forested area (combining dense, moderate, and open classes) showed a net gain of approximately 60 km² between 2015 and 2024. View evidence ↗
- Vegetation gains (NDVI change > +0.1) were primarily seen in the eastern piedmont and southern uplands due to rainfall and afforestation projects. View evidence ↗
- Vegetation loss (NDVI change < -0.05) occurred near Lalsot and Dausa, driven by urban expansion and mining. View evidence ↗
- There is a modest positive correlation between altitude and NDVI, meaning hill slopes generally have denser vegetation than the plains. View evidence ↗
What it means
- The authors conclude that Dausa has seen gradual ecological improvement over the last decade, despite remaining mostly non-forest or open-vegetation. View evidence ↗
- The authors recommend combining remote sensing monitoring with watershed planning and participatory afforestation to improve forest resilience. View evidence ↗
- The observed vegetation gains are spatially discontinuous and need further validation using ground observations and additional datasets. View evidence ↗
Visual summary
2 visualsIllustrations explain the paper; charts are replotted from the paper's own table values.
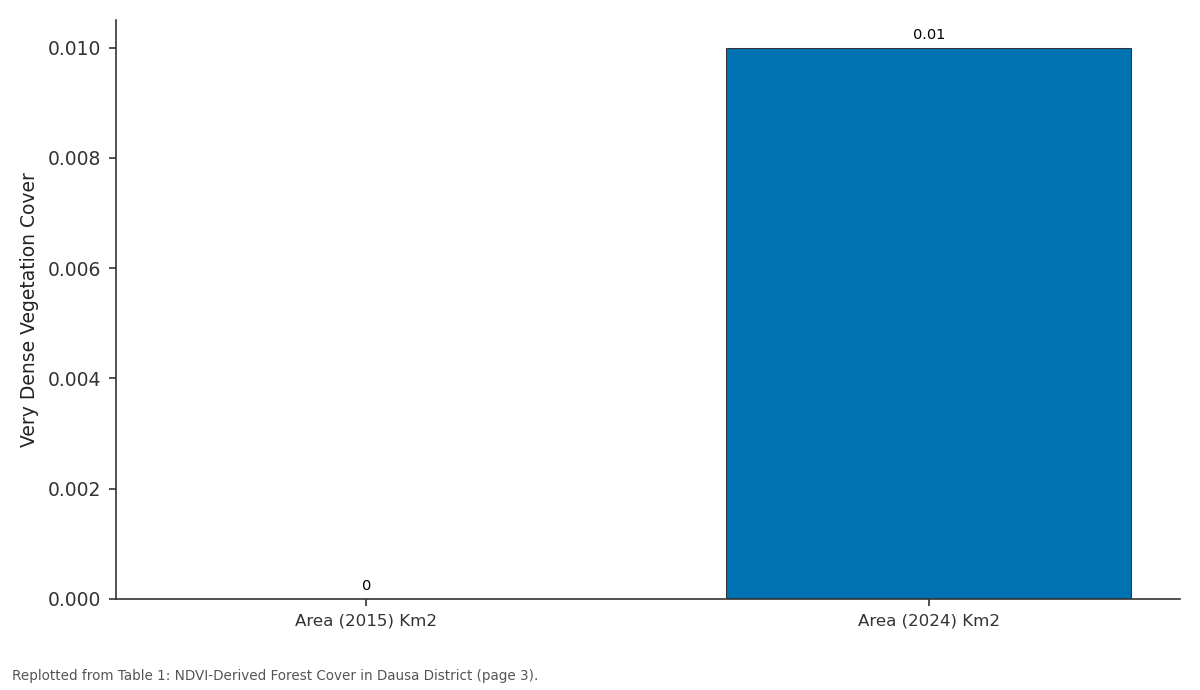
Very Dense Vegetation Cover: Area (2015) Km2 vs Area (2024) Km2
Replotted from Table 1 (page 3) of the original paper. Every bar is the paper's own table value.
View source evidence ↗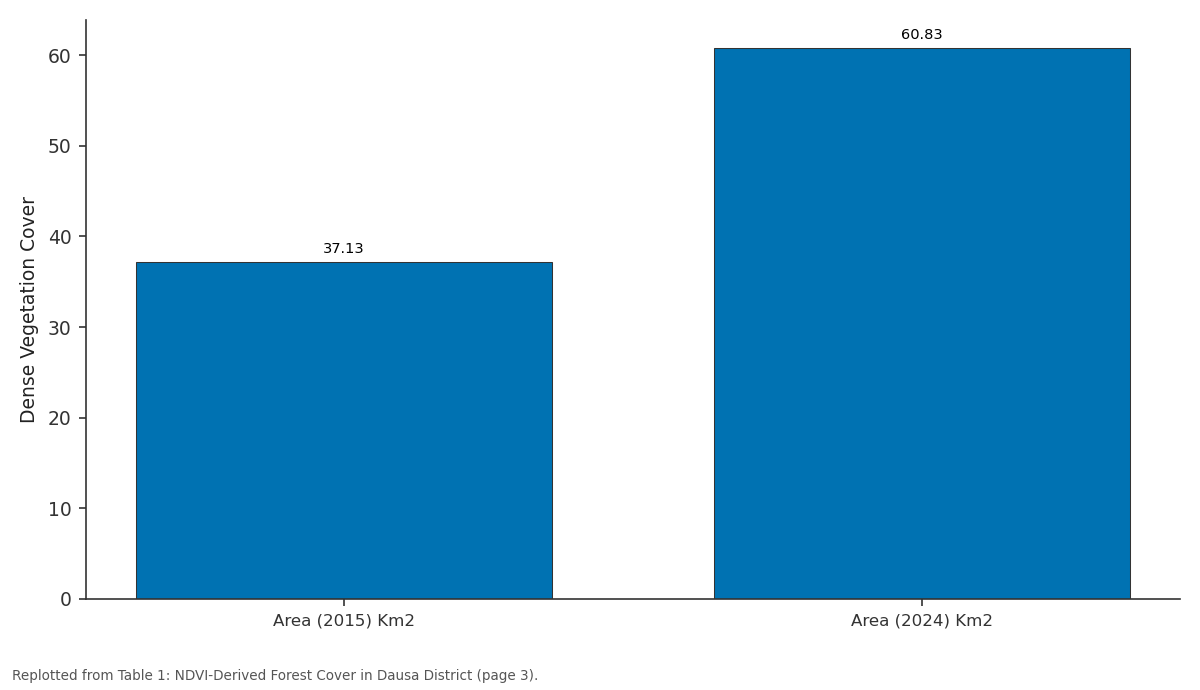
Dense Vegetation Cover: Area (2015) Km2 vs Area (2024) Km2
Replotted from Table 1 (page 3) of the original paper. Every bar is the paper's own table value.
View source evidence ↗Figures & tables
From the original paper Table 1
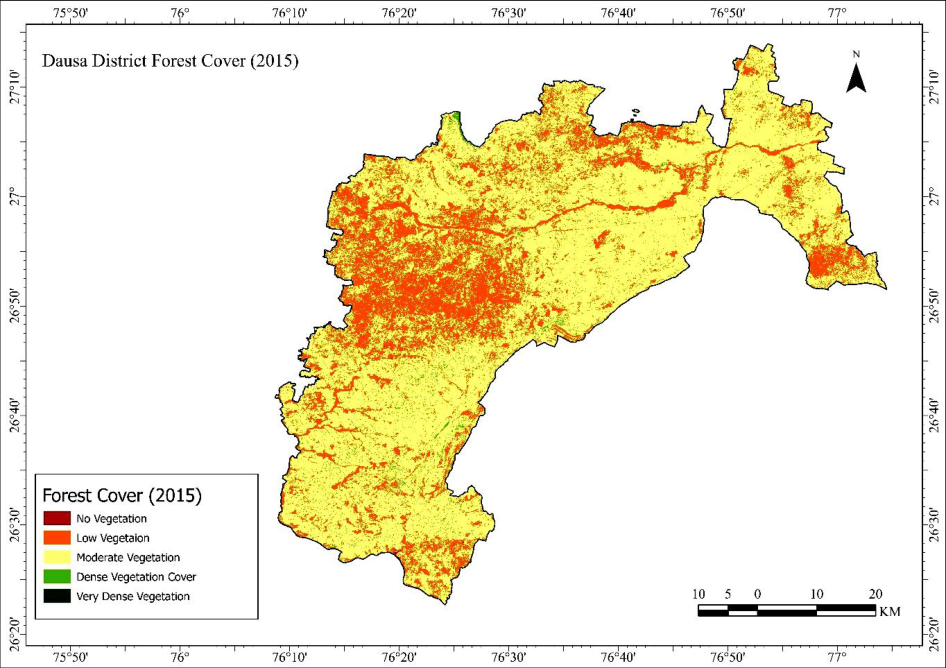 Figure 1
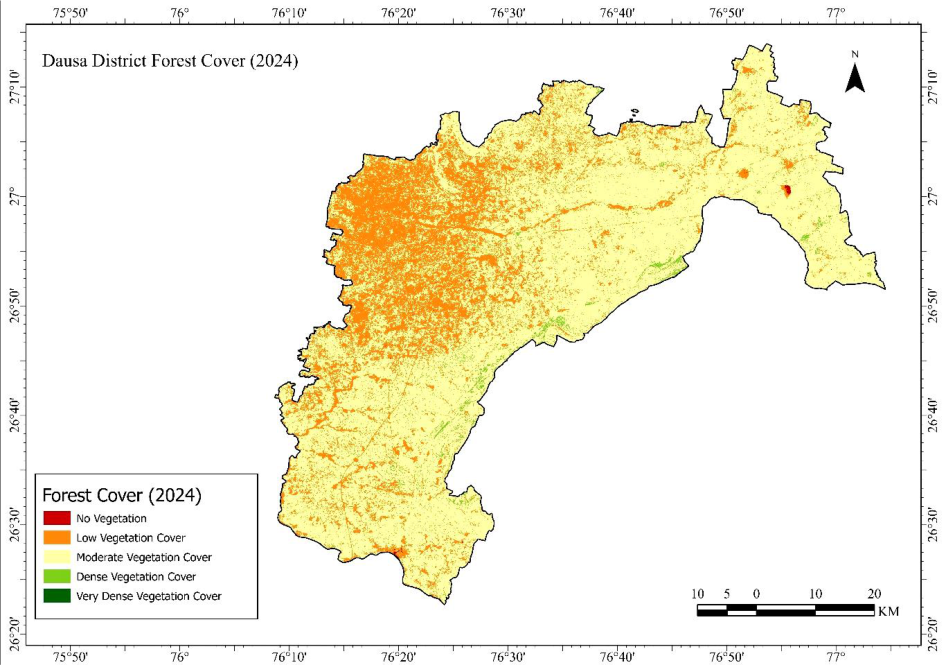 Figure 2
Introduction
Forests represent one of the most essential and dynamic ecosystems on the Earth's surface, playing a pivotal role in maintaining ecological stability, regulating hydrological and biogeochemical cycles, and supporting biodiversity and human livelihoods (Feng et al., 2024) [3] . They significantly influence regional and global climate systems through carbon sequestration, evapotranspiration, and albedo modulation (Vento et al., 2023) [13] . In developing nations such as India, forests also provide crucial ecosystem services-fuelwood, fodder, minor forest products, and soil protection-that directly bolster the rural economy (González De Andrés, 2019) [4] . However, rapid population growth, urban expansion, and unsustainable land-use practices have accelerated forest degradation and fragmentation, particularly in ecologically fragile regions (Prasad et al., 2001; Tiwari, 2008) [10,12] . Although India's forest cover has increased marginally over recent decades, it remains spatially uneven (Tiwari, 2008) [12] . The arid and semi-arid regions of western India, particularly Rajasthan, are characterized by low natural vegetation and significant anthropogenic pressure. Rajasthan comprises nearly 10 percent of India's geographical area but contains less than 5 percent of its total forest cover. In this context, continuous monitoring of forest dynamics is essential for evaluating environmental changes and formulating effective conservation strategies (Colantoni et al., 2020) [2] . Dausa District, situated in the northeastern region of Rajasthan, serves as a transitional ecological zone between the Aravalli uplands and the eastern plains. The district's forest resources are limited and fragmented, primarily located on undulating hillocks and degraded scrublands dominated by species such as Acacia nilotica, Prosopis juliflora, and Azadirachta indica. The district's land-cover composition has been significantly altered over the past few decades due to increasing agricultural encroachment, grazing pressure, mining activities, and infrastructural development (Saini & Mohd, 2025) [11] .
These changes have impacted vegetation density, surface runoff, and micro-climatic conditions, highlighting the necessity for precise spatio-temporal assessment. Remote Sensing (RS) and Geographic Information Systems (GIS) serve as robust methodologies for the detection, quantification, and mapping of environmental changes (Kandissounon et al., 2018) [6] . The utilization of multitemporal satellite imagery facilitates consistent monitoring of the Earth's surface, while vegetation indices, such as the Normalized Difference Vegetation Index (NDVI), are instrumental in capturing variations in photosynthetic activity and canopy health (Obrecht et al., 2023) [9] . The Landsat series, particularly Landsat 8 Operational Land Imager (OLI) and Landsat 9, provides radiometrically calibrated, high-resolution surface reflectance data, which is well-suited for decadal-scale monitoring at the district level. (Jia et al., 2014; Kumar & Roy, 2017) [5,7] . The integration of NDVI with spatial analysis techniques facilitates the identification of forest-cover transitions and the detection of subtle ecological trends (Masek et al., 2006) [8] . In this context, the current study endeavors to perform a spatio-temporal analysis of forest cover in Dausa District from 2015 to 2024, utilizing Landsat-derived NDVI composites within a GIS framework. The specific objectives are as follows: to generate cloud-free NDVI datasets for the period 2015 to 2024 using Landsat 8 surface reflectance imagery; to classify NDVI values into density-based forest categories (very dense, dense, moderate, open, and nonforest) and quantify their areal extent; and to analyze spatial and temporal patterns of vegetation change, identifying zones of forest gain and loss. This study aims to provide empirical evidence on vegetation dynamics in a semi-arid environment and to illustrate the application of geospatial technologies for local-level environmental assessment. The findings will aid in evaluating the effectiveness of afforestation programs, watershed management initiatives, and land-use policies, thereby offering a scientific basis for sustainable forest management in Dausa and comparable districts across Rajasthan.
Study Area
Dausa District lies in the north-eastern part of Rajasthan between 26°20′-27°00′ N and 76°00′-77°20′ E, covering about 3,404 km². Physiographically, it forms a transitional terrain between the Aravalli uplands and the eastern alluvial plains, marked by gently undulating plateaus and scattered hillocks. The district experiences a semi-arid climate with hot summers (up to 45 °C), mild winters, and an average annual rainfall of 600-700 mm, mostly during the southwest monsoon. With a population exceeding 1.6 million, the economy is primarily agrarian, while natural resources include limited dry deciduous forests, minor mineral deposits, and groundwater aquifers supporting irrigation and rural livelihoods.
Materials and Methods
This study employed a combination of Remote Sensing and Geographic Information System (GIS) techniques to quantify and interpret the spatial and temporal dynamics of forest cover in Dausa District from 2015 to 2024. Multitemporal satellite imagery was analyzed to derive the Normalized Difference Vegetation Index (NDVI), which served as a proxy indicator for vegetation density and health.
Data Sources
The analysis employed Landsat-8 Operational Land Imager (OLI) Collection-2 Level-2 Surface Reflectance data, accessed via the Google Earth Engine (GEE) platform (Abdelsamie et al., 2024; Zafar et al., 2025) [1,14] . Two datasets, from the years 2015 and 2024, encompassing the entire district, were downloaded. Each scene was selected with less than 10 percent cloud cover to ensure radiometric clarity and temporal consistency. Ancillary data, including administrative boundaries, drainage, and elevation layers, were obtained from the Survey of India and FAO-GAUL databases to facilitate spatial contextualization in ArcGIS.
NDVI Derivation and Image Processing
The NDVI was calculated using the standard equation:
Where the NIR and RED bands correspond to Band 5 (0.85-0.88 µm) and Band 4 (0.64-0.67 µm) of Landsat-8 OLI, respectively. All images were pre-processed for atmospheric correction using the radiometric scaling factors provided in the Landsat metadata (0.0000275 * SR + (-0.2)). Cloud and shadow pixels were masked through the QA_PIXEL bitmask. For each year, multiple scenes were composited to form a mean NDVI image, which minimizes the influence of residual cloud, haze, or phenological anomalies and provides a stable representation of annual vegetation conditions. These mean composites were clipped to the Dausa district boundary and exported in GeoTIFF format for further spatial analysis.
Spatial Analysis in ArcGIS
The annual NDVI composites were imported into ArcGIS Pro 3.5 for statistical and cartographic processing. NDVI values were classified into five forest-density categories: very dense (> 0.70), dense (0.5-0.70), moderate (0.3-0.5), open (0.0-0.3), and non-forest (< 0.0). The area under each class was calculated in square kilometres using raster attribute tables and zonal statistics. Temporal overlays (2015 vs 2024) were generated to delineate zones of forest gain and loss. Spatial visualization was performed using a standardized green-to-brown colour ramp, and map layouts were prepared following cartographic conventions for scale, legend, and north orientation.
Analytical Framework
The workflow integrated temporal NDVI quantification (2015-2024) with spatial overlay analysis to detect vegetation dynamics. The resulting dataset enabled statistical correlation of NDVI changes with physiographic and anthropogenic factors, providing a scientific foundation for evaluating forest cover trends in Dausa's semi-arid environment.
Results
Results
NDVI Dynamics (2015-2024)
The decadal NDVI analysis of Dausa District reveals perceptible yet spatially uneven changes in vegetation density over the period 2015-2024. The annual mean NDVI values ranged between -0.19 and 0.817 indicating a predominance of sparse to dense vegetation typical of semi-arid environments. The inter-annual trend exhibits minor fluctuations corresponding to rainfall variability, with relatively higher NDVI values recorded during the good monsoon years. Spatially, the southern and eastern hill tracts of Mahwa and Baswa blocks exhibited relatively dense vegetation, whereas the central and north-western plains around Dausa city and Lalsot showed lower NDVI values due to intensive cultivation, settlement expansion, and mining activity. The spatial continuity of forest patches remains fragmented, although scattered greening is evident along seasonal stream channels and reforested community lands.
NDVI-Based Forest Density Classification
The NDVI composites were categorized into five forestdensity categories: very dense (> 0.70), dense (0.5-0.70), moderate (0.3-0.5), open (0.0-0.3), and non-forest (< 0.0). Table 1 summarizes the areal distribution of these classes during 2015 and 2024. Overall, the NDVI-based assessment demonstrates that while Dausa remains predominantly under non-forest and open-vegetation cover, there has been gradual ecological improvement during the last decade. However, the gains are spatially discontinuous and require further validation through ground observations and integration with land-use and rainfall datasets.
| Forest Class | Area (2015) Km2 | Area (2024) Km2 | Change in Area Km2 |
|---|---|---|---|
| Very Dense Vegetation Cover | 0 | 0.01 | 0.01 |
| Dense Vegetation Cover | 37.13 | 60.83 | 23.7 |
| Moderate Vegetation Cover | 2472.75 | 2493.21 | 20.46 |
| Low Vegetation Cover | 905.29 | 860.22 | -45.07 |
| No Vegetation | 0.49 | 1.42 | 0.93 |
| Total | 3415.66 | 3415.69 | 0.03 |
Table text extracted from the original PDF; superscript letters are shown inline. The original table image is below.
View original table image
Discussion
The Overall, the discussion highlights that while Dausa exhibits a modest greening trend over the last decade, the gains remain spatially fragmented and ecologically fragile.
Continued anthropogenic pressure, erratic rainfall, and overdependence on marginal lands threaten long-term sustainability. The integration of remote-sensing-based vegetation monitoring with participatory afforestation and watershed planning can provide a comprehensive strategy for enhancing forest resilience in the district. The findings thus demonstrate the efficacy of NDVI-based geospatial analysis as a diagnostic and policy-support tool for regional environmental governance.
Figures and tables from the paper
References
14 in the original paper- Abdelsamie EA, Almadani SA, El-Sorogy AS, Maswada HF, Mustafa A-RA, Meroño De Larriva JE, et al. Current and potential land use/land cover (LULC) scenarios in dry lands using a CA-Markov simulation model and the classification and regression tree (CART) method: a cloud-based Google Earth Engine (GEE) approach. Sustainability. 2024;16(24):11130. https://doi.org/10.3390/su162411130
- Colantoni A, Egidi G, Quaranta G, D'Alessandro R, Turco R, Salvati L, Vinci S. Sustainable land management, wildfire risk and the role of grazing in Mediterranean urban-rural interfaces: a regional approach from Greece. Land. 2020;9(1):21. https://doi.org/10.3390/land9010021
- Feng Q, Zhang Y, Liu Z, Xia S, Yang H, Liu Y, Wu Z. Interdisciplinary perspectives on forest ecosystems and climate interplay: a review. Environmental Reviews. 2024;33:1-21. https://doi.org/10.1139/er-2024-0010
- González De Andrés E. Interactions between climate and nutrient cycles on forest response to global change: the role of mixed forests. Forests. 2019;10(8):609. https://doi.org/10.3390/f10080609
- Jia K, Wei X, Gu X, Yao Y, Xie X, Li B. Land cover classification using Landsat 8 Operational Land Imager data in Beijing, China. Geocarto International. 2014;29(8):941-951. https://doi.org/10.1080/10106049.2014.894586
- Kandissounon GA, Ahmad S, Kalra A. Integrating system dynamics and remote sensing to estimate future water usage and average surface runoff in Lagos, Nigeria. Civil Engineering Journal. 2018;4(2):378-389. https://doi.org/10.28991/cej-030998
- Kumar SS, Roy DP. Global operational Landsat-8 reflectance-based active fire detection algorithm. International Journal of Digital Earth. 2017;11(2):154178. https://doi.org/10.1080/17538947.2017.1391341
- Masek JG, Hall FG, Huemmrich KF, Vermote EF, Saleous NE, Gao F, Lim T-K, Wolfe R, Kutler J. A Landsat surface reflectance dataset for North America, 1990-2000. IEEE Geoscience and Remote Sensing Letters. 2006;3(1):68-72. https://doi.org/10.1109/lgrs.2005.857030
- Obrecht L, Göttsche F-M, Senn JA, Cermak J. Mapping changes in fractional vegetation cover on the Namib gravel plains with satellite-retrieved land surface emissivity data. Remote Sensing. 2023;16(1):159. https://doi.org/10.3390/rs16010159
- Prasad R, Maithel S, Mirza A. Renewable energy technologies for fuelwood conservation in the Indian Himalayan region. Sustainable Development. 2001;9(2):103-108. https://doi.org/10.1002/sd.160
- Saini M, Mohd S. Integrating GIS and AHP for optimal landfill site selection: a case study of Alwar City, India. Springer Science Business Media LLC. 2025. https://doi.org/10.21203/rs.3.rs-6424995/v1
- Tiwari P. Land use changes in Himalaya and their impacts on environment, society and economy: a study of the Lake Region in Kumaon Himalaya, India. Advances in Atmospheric Sciences. 2008;25(6):10291042. https://doi.org/10.1007/s00376-008-1029-x
- Vento B, Cuesta F, Cavieres L. Editorial: carbon sequestration and climate change in crops, natural vegetation, and wetland dynamics in the high Andes. Frontiers in Plant Science. 2023;14:1338577. https://doi.org/10.3389/fpls.2023.1338577
- Zafar SM, Khan JA, Mobeen A, Jaafar WSWM, Kemarau RA. Estimating the plausible projections of land use/land cover dynamics in Jhelum and Chenab River basins using satellite imageries and machine learning models in Google Earth Engine. Geocarto International. 2025;40(1):1-20. https://doi.org/10.1080/10106049.2025.2491640