
Research article · 2025 · Full text
International Journal of Agriculture and Food ScienceEffect of Non-Genetic Factors on Production Traits in Gir Cattle
Volume 7(10) · Pages 464–467 · DOI: 10.33545/2664844x.2025.v7.i10g.909 ↗
Research areasGenetic and phenotypic traits in livestock
Abstract
Author-writtenThe data on production performance of Gir maintained at “Shree Nashik Panchavati Panjarpole, Nashik (M.S) were utilized for present study. The least squares means of total lactational milk yield (kg), lactation length (days), dry period (days) and peak milk yield (kg) were estimated by considering the effects of period of calving, season of calving and lactation order as non-genetic factors. The overall least squares mean for total lactational milk yield, lactation length, dry period and PMY in Gir cattle were 1887.38 ± 16.68 kg, 266.14 ± 1.38 days, 108.15 ± 1.25 days and 9.14 ± 0.12 kg, respectively. The effect of period of calving was significant on all traits TLMY, LL, DP, PMY; the effect of season of calving was significant on TLMY, LL and DP, while it was non-significant on trait PMY; the effect of order of lactation was significant on traits LL, PMY and DP while it was non-significant on trait TLMY.9.
Summary
Source-checkedPlain-language reading of the full paper, prepared with AI and checked against the text. Each point links to the authors' own words.
Why it matters
- India has the world's largest cattle population, with animals primarily used for milk production and draught power. View evidence ↗
- Gir cattle are considered one of India's premier dairy breeds, originating from the Saurashtra region of Gujarat. View evidence ↗
- The productivity of native dairy herds is influenced by both their genetic potential and environmental factors like nutrition and management. View evidence ↗
The question
- The study aimed to estimate how non-genetic factors, specifically the period of calving, season of calving, and lactation order, affect total milk yield, lactation length, dry period, and peak milk yield in Gir cattle. View evidence ↗
What they did
- Data were collected over a 7-year period from 2018 to 2024 from Gir cows at the Shree Nashik Panchavati Panjarpole. View evidence ↗
- The analysis categorized data into three calving periods (P1, P2, P3), three calving seasons (Rainy, Winter, Summer), and seven lactation orders (L1 through L7). View evidence ↗
- The researchers used least-square analysis to estimate the effects of the non-genetic factors. View evidence ↗
What they found
- The overall average values for the herd were 1887.38 ± 16.68 kg for total milk yield, 266.14 ± 1.38 days for lactation length, 108.15 ± 1.25 days for the dry period, and 9.14 ± 0.12 kg for peak milk yield. View evidence ↗
- Total lactational milk yield was highest for cows calved in period P1 (1968.22 ± 35.18 kg) compared to P2 (1918.65 ± 24.15 kg) and P3 (1775.26 ± 15.35 kg). View evidence ↗
- Winter calving (S2) resulted in the highest total milk yield (1990.02 ± 19.31 kg), while rainy season (S1) calving was the lowest (1768.21 ± 26.03 kg). View evidence ↗
- Lactation length decreased across the study periods, with P1 being the longest (283.19 ± 2.92 days) and P3 the shortest (247.27 ± 1.27 days). View evidence ↗
- The longest lactation length occurred in winter (S2: 278.36 ± 1.60 days) and the shortest in summer (S3: 254.49 ± 1.95 days). View evidence ↗
- The dry period increased over time, reaching its maximum in period P3 (124.18 ± 1.15 days) and its minimum in P1 (93.34 ± 2.64 days). View evidence ↗
- The dry period was longest in the seventh lactation (L7: 121.28 ± 4.30 days) and shortest in the first lactation (L1: 101.79 ± 1.78 days). View evidence ↗
- Peak milk yield (PMY) was significantly higher in period P1 (9.74 ± 0.25 kg) than in P2 (9.37 ± 0.17 kg) or P3 (8.31 ± 0.11 kg). View evidence ↗
- Peak milk yield peaked during the third lactation (L3: 9.57 ± 0.17 kg) and was lowest in the seventh lactation (L7: 8.03 ± 0.41 kg). View evidence ↗
What it means
- The authors concluded that the period of calving significantly affects all measured traits, while the season of calving and lactation order have varying significant effects depending on the specific trait. View evidence ↗
Visual summary
2 visualsIllustrations explain the paper; charts are replotted from the paper's own table values.
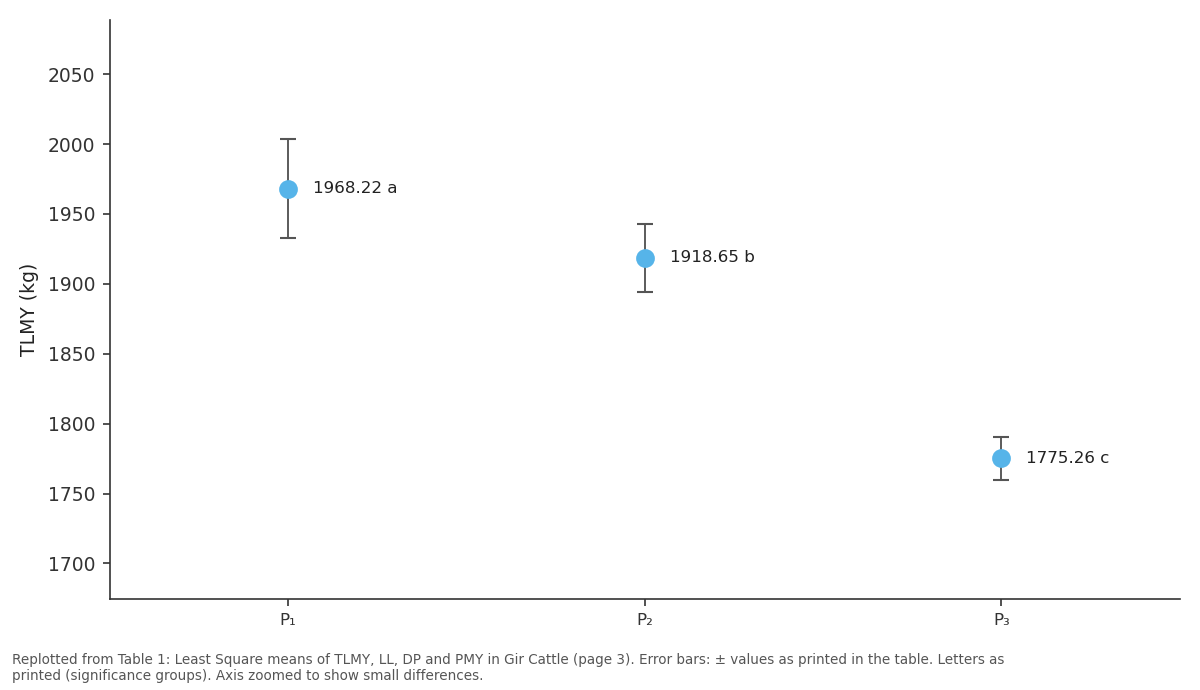
TLMY: P₁ vs P₂ vs P₃
Replotted from Table 1 (page 3) of the original paper. Every bar is the paper's own table value.
View source evidence ↗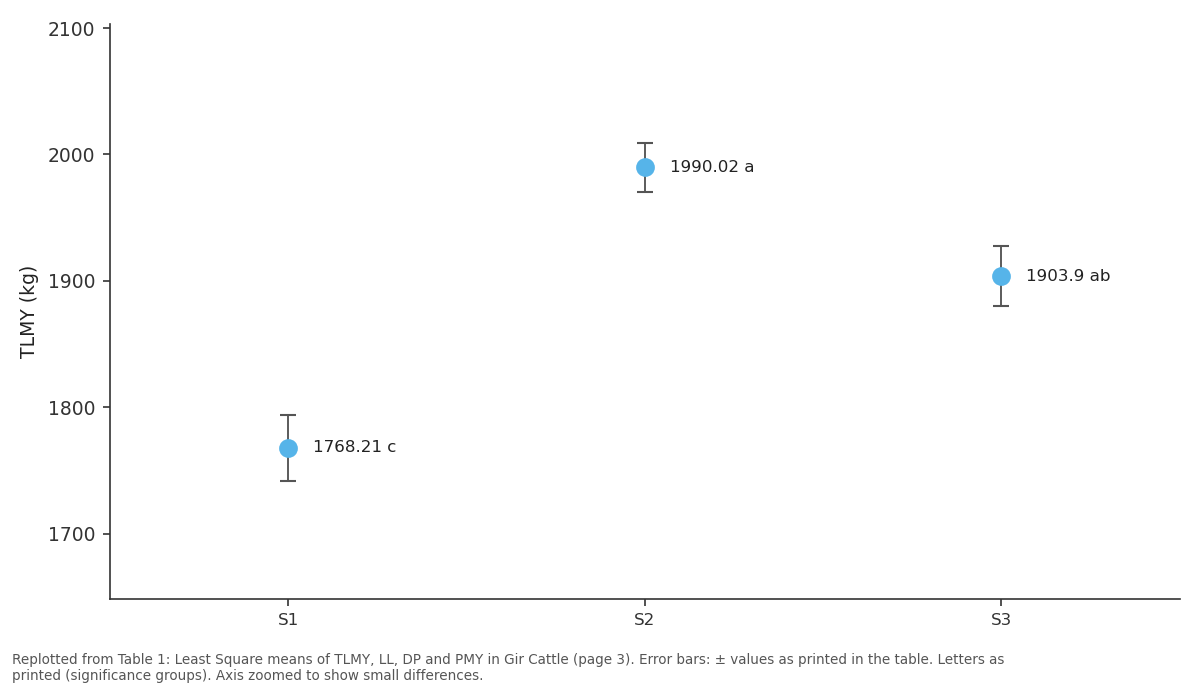
TLMY: S1 vs S2 vs S3
Replotted from Table 1 (page 3) of the original paper. Every bar is the paper's own table value.
View source evidence ↗Figures & tables
From the original paper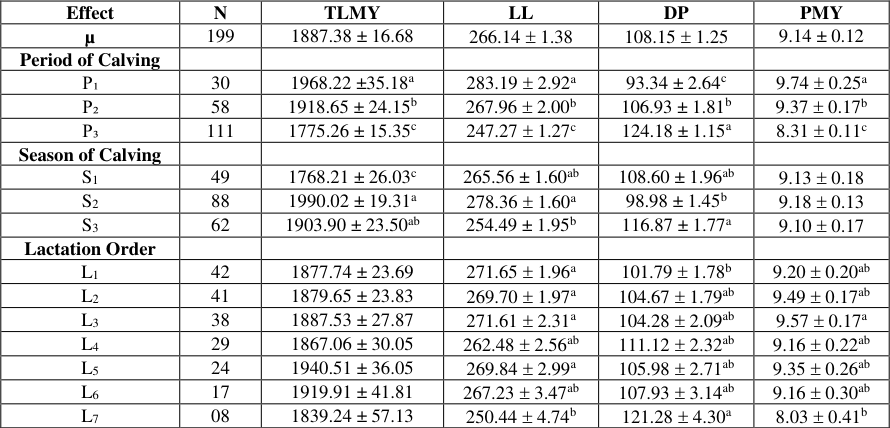 Table 1
Introduction
India ranks first globally in cattle population, where rearing practices primarily aim to fulfill two essential functions milk production and draught power. Economic limitations often compel farmers to maintain cattle capable of serving both purposes, providing milk as well as labour. Although a majority of native breeds are primarily used for draught purposes, breeds such as Gir, Red Sindhi, and Sahiwal are widely recognized for their exceptional milk-producing ability. The efficiency of indigenous dairy herds is governed by both productive and reproductive performance, which are affected by genetic potential along with environmental influences such as management practices, nutrition, and seasonal variations. Among these, Gir cattle hold a distinguished position as one of India's finest dairy breeds, native to the Gir forests and hilly regions of Saurashtra in Gujarat, with their distribution extending into adjoining areas of Maharashtra and Rajasthan. Locally, the breed is referred to by several names, including Bhodali, Desan, Gujarati, Kathiawari, and Sorthi. Gir cattle are easily identifiable by their characteristic convex forehead, long drooping ears, and smooth, glossy skin. In the Indian context, milk yield remains the key criterion for assessing breed suitability, and evaluation is based on attributes such as lactation duration, peak yield, and total lactation milk yield, which collectively indicate the animal's adaptability and productive potential under prevailing environmental and management conditions.
Materials and Methods
The data of Gir cows maintained at "Shree Nashik Panchavati Panjarpole" for a period from 2018 to 2024 (7 years) were collected for present investigation for following Traits: a) Productive traits: 1) Total lactation milk yield (kg) 2) Lactation length (days) 3) Dry period (days) 4) Peak milk yield (kg). To examine the production traits, the research data were classified into 3 periods of calving viz. P1 (2018-2019), P2(2020-2021), P3 (2022-2024); 3 seasons of calving, viz. S1 (Rainy) June-September, S2 (Winter) October-January and S3 (Summer) February-May; 7 order of lactation viz. L1 first lactation, L2 second lactation, L3 third lactation, L4 fourth lactation, L5 fifth lactation, L6 sixth lactation and L7 seventh lactation. The effects of non-genetic factors like period of calving, season of calving and parity were estimated by using least-square analysis as suggested by Harvey (1990) [6] .
The model was used with the assumption that different components being fitted into the model were as linear, independent and additive. The model used was as follows:
Model І
Model І
Yijkl = μ+ Si + Pj + Lk + eijkl
Where, Yijkl: Observation of l th parameters for i th season of calving, j th period of calving & k th lactation order µ: Overall mean Si: Effect of i th season of calving (i=1, 2, 3) Pj: Effect of j th period of calving (j=1, 2, 3) Lk: Effect of k th lactation order (k=1, 2, 3, 7)
Duncan's Multiple Range Test (DMRT)
Duncan's Multiple Range Test as modified by Kramer (1957) [12] was used to make pair wise comparison among the least square means with the use of inverse elements and root mean squares for error If the value:
>𝝈 2 e, Z(P, ne)
Where, Yi -Yj: Difference between two least squares means Cii: Corresponding i th diagonal elements of C matrix Cjj: Corresponding j th diagonal elements of C matrix Z (P, ne): Standardized range value in Duncan's table at the chosen level of probability for the error degrees of freedom P: Number of means involved in the comparison 𝜎 2 e: Root mean squares for error
Results and Discussion Overall least-squares means of production traits
The production traits of Gir cattle are shown in Table 1. The overall least-squares means for production traits were 1887.38 ± 16.68 kg for Total Lactational milk yield (TLMY), 266.14 1.38 days for Lactation length (LL), 9.14 ± 0.12 kg for peak milk yield (PMY) and 108.15 1.25 days for Dry period (DP), respectively. The findings for TLMY are in close agreement with Javed et al. (2000) [9] in Sahiwal (1779.04 ± 18.17 kg). Similar results were observed by Bairwa et al. (2022) [1] in Gir (273.83 5.01 days) for lactation length. Close agreement to the value reported by Krishna et al. (1991) [13] in HF x Deoni (10.48 ± 0.22 kg) and Chigale et al. (2016) [2] in Red Sindhi (9.13 ± 0.18 kg) for PMY. The result of present findings were in close agreement for DP reported by Jadhav (2011) [7] in Phule Triveni (100.84 ± 3.78 days) and Tawadar et al. (2021) [21] in Red Sindhi cattle.
| Effect | N | TLMY | LL | DP | PMY |
|---|---|---|---|---|---|
| µ | 199 | 1887.38 ± 16.68 | 266.14 1.38 | 108.15 1.25 | 9.14 ± 0.12 |
| Period of Calving | |||||
| P₁ | 30 | 1968.22 ±35.18a | 283.19 2.92a | 93.34 ± 2.64c | 9.74 0.25a |
| P₂ | 58 | 1918.65 ± 24.15b | 267.96 2.00b | 106.93 ± 1.81b | 9.37 0.17b |
| P₃ | 111 | 1775.26 ± 15.35c | 247.27 1.27c | 124.18 ± 1.15a | 8.31 0.11c |
| Season of Calving | |||||
| S1 | 49 | 1768.21 ± 26.03c | 265.56 ± 1.60ab | 108.60 ± 1.96ab | 9.13 0.18 |
| S2 | 88 | 1990.02 ± 19.31a | 278.36 1.60a | 98.98 ± 1.45b | 9.18 0.13 |
| S3 | 62 | 1903.90 ± 23.50ab | 254.49 ± 1.95b | 116.87 ± 1.77a | 9.10 0.17 |
| Lactation Order | |||||
| L1 | 42 | 1877.74 ± 23.69 | 271.65 1.96a | 101.79 1.78b | 9.20 0.20ab |
| L2 | 41 | 1879.65 ± 23.83 | 269.70 1.97a | 104.67 1.79ab | 9.49 0.17ab |
| L3 | 38 | 1887.53 ± 27.87 | 271.61 2.31a | 104.28 2.09ab | 9.57 0.17a |
| L4 | 29 | 1867.06 ± 30.05 | 262.48 2.56ab | 111.12 2.32ab | 9.16 0.22ab |
| L5 | 24 | 1940.51 ± 36.05 | 269.84 2.99a | 105.98 2.71ab | 9.35 0.26ab |
| L6 | 17 | 1919.91 ± 41.81 | 267.23 3.47ab | 107.93 3.14ab | 9.16 0.30ab |
| L7 | 08 | 1839.24 ± 57.13 | 250.44 4.74b | 121.28 4.30a | 8.03 0.41b |
Table text extracted from the original PDF; superscript letters are shown inline. The original table image is below.
View original table image
The influence of period of calving on total lactational milk yield was significant. These results were in agreement with the results by Kulkarni (2001) [14] in Red Sindhi cattle, Patond (2013) [18] in Gir triple cross cows and Jadhav et al. (2019) [8] in HF × Gir halfbreds. In Gir, the total lactational milk yield (kg) of cattle calved during period P1 (1968.22 ±35.18 kg) was substantially higher than those cows calved during P2 (1918.65 ± 24.15 kg) and P3 (1775.26 ± 15.35 kg).
The influence of season of calving on lactational milk yield was highly significant in Gir cow. These results were in agreement with Khade (2001) [11] in Gir crossbred cows, Nanavati and Singh (2004) [16] in Gir cattle, Garudkar (2011) [3] in Phule Triveni, Patond (2009) [17] in Jersey cattle. In the present study, total lactational milk yield was detected highest when cows calved during winter season S2 (1990.02 ± 19.31 kg) than those who calved during rainy season S1 (1768.21 ± 26.03 kg) and summer season S3 (1903.90 ± 23.50 kg). The variation due to lactation order in total lactational milk yield (kg) was non-significant in Gir cattle. Similar effects were reported by Radhika et al. (2012) [19] in crossbred cows and Kumar et al. (2020) in Sahiwal cows. In Gir cows, the higher total lactational milk yield (kg) was found during L5 (1940.51 ± 36.05 kg), followed by L6 (1919.91 ± 41.81 kg), L3 (1887.53 ± 27.87 kg), L2 (1879.65 ± 23.83 kg), L1 (1877.74 ± 23.69 kg), L4 (1867.06 ± 30.05 kg) and lowest in L7 (1839.24 ± 57.13 kg) lactation. In Gir cattle, no specific trend of total lactational milk yield was observed during different lactations.
Lactation length (LL)
The influence of the period of calving in lactation length was highly significant on Gir cattle. The significant effect of the period of calving on lactation length was noticed by Kulkarni (2001) [14] in Red Sindhi cows, Jadhav (2011) [7] in Phule Triveni. In Gir cow, lactation length (days) was higher in cows calved during period P1 (283.19 2.92 days) followed by P2 (267.96 2.00 days) and P3 (247.27 1.27 days). The variation due to the season of calving on lactation length was highly significant in Gir cattle. These results were similar to Javed et al. (2000) [9] in Sahiwal, Varade et al. (2002) [23] in Jersey crossbreds, and Thombare et al. (2013) [22] in HF x Deoni halfbreds. In Gir cattle, the highest lactation length was observed in cows calved during the winter S2 (278.36 1.60 days) season followed by rainy S1 (265.56 ± 1.60 days) and lowest in summer S3 (254.49 ± 1.95 days) season. The influence of the order of lactation on the lactation length was highly significant in Gir cattle. These results were similar found with Gawari (1999) and Kamble (2003) [4, 10] in Gir crossbred cows and Jadhav (2011) [6] in FG halfbreds. In Gir cattle, the highest lactation length was observed in L1 (271.65 1.96 days) lactation followed by L3 (271.61 2.31 days), L5 (269.84 2.99 days), L2 (269.70 1.97 days), L6 (267.23 3.47 days), L4 (262.48 2.56 days), and which was lowest in L7 (250.44 4.74 days) lactation.
Dry period (DP)
The influence of the period of calving in the dry period had a highly significant effect on Gir cattle. Similar results were noticed by Hadge et al. (2012) [5] in Jersey x Sahiwal crossbred cows, Nanavati and Singh (2004) [16] in Gir cattle. In Gir cattle, the highest dry period was found in P3 (124.18 ± 1.15 days) followed by P2 (106.93 ± 1.81) and lowest in P1 (93.34 ± 2.64). The influence of the season of calving in the dry period was highly significant in Gir cattle. These results were in agreement with Javed et al. (2000) [9] in Sahiwal cows and Jadhav (2011) [7] in IFG cows. In Gir cows, the longest dry period was observed in cows calved during summer S3 (116.87 ± 1.77 days) season followed by rainy S1 (108.60 ± 1.96 days) and shortest in those calved in winter S2 (98.98 ± 1.45 days) season. The influence of the order of lactation in the dry period was highly significant in Gir cattle. These results were similar to Talape (2010) [20] in Jersey cows and Jadhav (2011) [7] in FG cows. In Gir cattle, the highest dry period (days) was observed in cows during L7 (121.28 4.30 days) followed by L4 (111.12 2.32 days), L6 (107.93 3.14 days), L5 (105.98 2.71 days), L2 (104.67 1.79 days), L3 (104.28 2.09 days) and lowest in L1 (101.79 1.78 days) lactation.
Peak milk yield (PMY)
The variation due to period of calving in PMY was highly significant in Gir cattle. Similar results were reported by Patond (2009) [17] in Jersey cows, Kulkarni (2001) [14] in Red Sindhi. The PMY of cows calved during period P1 (9.74 0.25 kg) was significantly higher than those calved in P2 (9.37 0.17 kg) and P3 (8.31 0.11 kg). The variation due to the season of calving in PMY was nonsignificant in Gir cattle. Similar results were noticed by Patond (2009) [17] in Jersey and Garudkar (2011) [3] in Phule Triveni cattle. In Gir cattle, the highest PMY was observed in cows calved during the winter S2 (9.18 0.13 kg) season followed by S1 (9.13 0.18 kg) and lowest in S3 (9.10 0.17 kg). The difference due to order of lactation in PMY was significant in Gir cattle. Similar significant effect of the order of lactation on PMY was observed by Kulkarni (2001) [14] in Red Sindhi, Nanavati and Singh (2004) [16] Gir cattle. In Gir cattle, the highest PMY was observed during L3 (9.57 0.17 Kg) followed by L2 (9.49 0.17 kg), L5 (9.35 0.26 kg), L1 (9.20 0.20 kg), L4 (9.16 0.22 kg), L6 (9.16 0.30 kg) and lowest in L7 (8.03 0.41 kg) lactation.
Conclusion
The effect of period of calving was significant on all traits TLMY, LL, DP, PMY; the effect of season of calving was significant on TLMY, LL and DP, while it was nonsignificant on trait PMY; the effect of order of lactation was significant on traits LL, PMY and DP while it was nonsignificant on trait TLMY.
References
23 in the original paper- Bairwa M, Joshi RK, Bairwa AK. Non-genetic factors affecting production traits in Gir cattle. Pharma Innov J. 2022;11(7):858-860.
- Chigale PS. Effect of non-genetic factors on production performance of Red Sindhi cattle [MSc thesis]. Rahuri: Mahatma Phule Krishi Vidyapeeth; 2013.
- Garudkar SR. Peak yield and its relationship with persistency and lactation milk yield in Phule Triveni synthetic cows [MSc thesis]. Rahuri: Mahatma Phule Krishi Vidyapeeth; 2011.
- Gawari RG. Genetic studies on persistency of milk yield in triple crossbred cattle [MSc thesis]. Rahuri: Mahatma Phule Krishi Vidyapeeth; 1999.
- Hadge MR, Kuralkar SV, Ali SZ, Kharkar KP, Sawaimul AD. Genetic studies on productive traits of Sahiwal and Jersey × Sahiwal crossbred cows. Indian J Anim Res. 2012;46(1):92-94.
- Harvey WR. Least-squares analysis of data with unequal subclass numbers. ARS H-4. Washington, DC: USDA; 1990.
- Jadhav PD. Generation wise comparative reproduction and production performance of HF × Gir and Phule Triveni synthetic cows [MSc thesis]. Rahuri: Mahatma Phule Krishi Vidyapeeth; 2011.
- Jadhav SS, Deokar DK, Fulpagare YG, Bhoite UY, Mandakmale SD, Nimbalkar CV. Effect of genetic and non-genetic factors on first lactation production and reproduction traits in HF × Gir cattle. Int J Curr Microbiol App Sci. 2019;8(1):45-51.
- Javed K, Mohiuddin G, Abdullah M. Environmental factors affecting various productive traits in Sahiwal cattle. Pak Vet J. 2000;20(4):187-192.
- Kamble SS. Effect of different types of calving on reproduction and productive performance of crossbred cattle [MSc thesis]. Rahuri: Mahatma Phule Krishi Vidyapeeth; 2003.
- Rahuri: Mahatma Phule Krishi Vidyapeeth; 2001.
- Kramer CV. Extension of multiple range test to group correlated adjusted mean. Biometrics. 1957;13:13-20. International Journal of Agriculture and Food Science https://www.agriculturaljournals.com
- Krishna GVR, Reddy CE, Rao MR. Production performance of Deoni × Holstein Friesian cows. Indian J Dairy Sci. 1991;44(3):247-248.
- Kulkarni PP. Persistency of milk yield in Red Sindhi cattle [MSc thesis]. Rahuri: Mahatma Phule Krishi Vidyapeeth; 2001.
- Kumar S, Gupta ID, Sharma N, Revanasiddu D, Kumar A, Chauhan A, et al. Effect of season of parity and stages of lactation on productive performance of Sahiwal cattle. Indian J Anim Res. 2020;volume(issue missing).
- Nanavati S, Singh A. Non-genetic factors affecting production traits in Gir cattle. Indian J Dairy Sci. 2004;57(5):342-346.
- Patond MN. Persistency of milk yield in Jersey cattle [MSc thesis]. Rahuri: Mahatma Phule Krishi Vidyapeeth; 2009.
- Patond MN. Modelling of lactation curve in Gir triple cross cows [PhD thesis]. Rahuri: Mahatma Phule Krishi Vidyapeeth; 2013.
- Radhika G, Ajithkumar S, Rani A, Sathian CT, Anilkumar K, Usha AP, et al. Milk yield and composition of crossbred cows in the hilly Wayanad district of Kerala, India. Indian J Anim Sci. 2012;82(10):1251-1254.
- Talape SK. Studies on production performance and breeding efficiency of Jersey crossbreds maintained at Panjarpole, Ahmednagar [MSc thesis]. Rahuri: Mahatma Phule Krishi Vidyapeeth; 2010.
- Tawadar AC, Gaikwad US, Mote MG, Dhage SA. Effect of temperature humidity index on production performance of Red Sindhi cattle maintained at organised farm. Int J Acad Res Prog Educ Dev. 2021;16(2):184-187.
- Thombare BM, Bainwad DV, Wondifraw Z. Effect of non-genetic factors on milk production of Holstein Friesian × Deoni crossbred cows. Afr J Dairy Farming Milk Prod. 2013;1(4):79-84.
- Varade PK, Khire DW, Ali SZ, Kuralkar SV. Effect of genetic and non-genetic factors on productive and reproductive traits in Jersey crossbred cows. Indian J Anim Prod Mgmt. 2002;18(1-2):38-40.