
Research article · 2025 · Full text
International Journal of Agriculture and Food ScienceAssessing the Impact of Fertilizer Use, Irrigation, and Rainfall on Crop Productivity in India
Volume 7(10) · Pages 402–405 · DOI: 10.33545/2664844x.2025.v7.i10f.901 ↗
Research areasAgricultural Economics and Practices
Abstract
Author-writtenIndian agricultural sector is facing multiple challenges because of rising competition for land resources and water access and changing climate patterns. This study examines the impact of fertilizer consumption, irrigation, and annual rainfall on crop productivity in India. The study is based on secondary data from 1981 to 2023. Trend analysis indicates that crop productivity increased at an average annual rate of 2.09%, fertilizer use at 3.88%, and irrigation coverage at 1.46%. Rainfall showed a negligible and statistically insignificant increase of 0.11% per year. The Auto Regressive Distributed Lag model establishes a long-run cointegrating relationship between crop productivity and its determinants. The error correction term was found significant and suggests that short-run deviations adjust toward long-run equilibrium, thereby confirming the stability of the model. The application of fertilizers consistently enhances productivity, whereas irrigation efficiency represents a critical area for enhancement. The findings highlight the necessity of balanced fertilizer application, effective water management, and climate-resilient strategies to promote sustainable agricultural development and ensure long-term food security in India.
Summary
Source-checkedPlain-language reading of the full paper, prepared with AI and checked against the text. Each point links to the authors' own words.
Why it matters
- India's agricultural sector is vital to its economy, contributing 16-18% of the Gross Value Added (GVA) and employing nearly half of the workforce. View evidence ↗
- Indian soils are generally considered low in fertility due to significant deficiencies in nitrogen, phosphorus, potassium, and micronutrients like zinc, iron, and boron. View evidence ↗
- Crop productivity in India has faced increasing pressure over recent decades due to population growth and climate change. View evidence ↗
What they did
- The research used secondary data from 1981 to 2023, sourcing fertilizer consumption, crop productivity, and irrigation area from FAOSTAT, and rainfall data from the India Meteorological Department. View evidence ↗
- A log-linear regression model was employed to analyze the long-term trends of the variables between 1981 and 2023. View evidence ↗
- The Auto Regressive Distributed Lag (ARDL) model was used to examine the short-run and long-run relationships between crop productivity and its determinants. View evidence ↗
What they found
- Crop productivity increased at a statistically significant average annual rate of 2.09%. View evidence ↗
- Fertilizer consumption grew at a statistically significant average annual rate of 3.88%. View evidence ↗
- Irrigation coverage showed a continuous increase at an average annual rate of 1.46%. View evidence ↗
- Annual rainfall showed a negligible increase of 0.11%, which was not statistically significant. View evidence ↗
- The study confirmed a long-run cointegrating relationship between crop productivity and its determinants, as the F-statistic (5.86) exceeded the upper bound critical value (3.67). View evidence ↗
- In the short run, fertilizer use was found to be a consistent positive determinant of crop productivity (p = 0.007). View evidence ↗
- The error correction term (-0.055, p < 0.01) indicates that approximately 5.5% of short-run deviations from the long-run equilibrium are corrected each year. View evidence ↗
What it means
- The authors conclude that productivity can be improved through policies promoting balanced fertilizer use and by focusing on enhancing water-use efficiency rather than just expanding irrigated areas. View evidence ↗
Figures & tables
From the original paper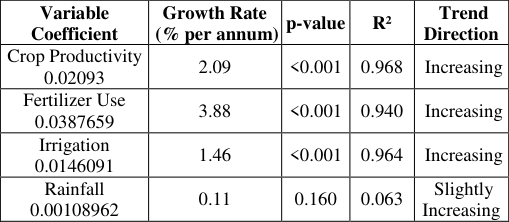 Table 1
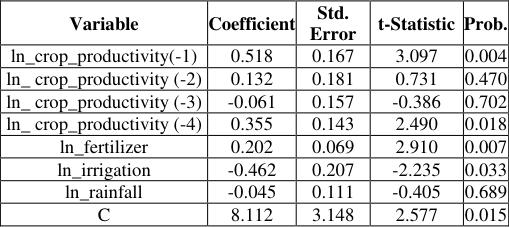 Table 2
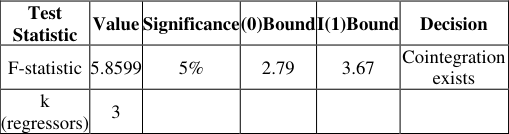 Table 3
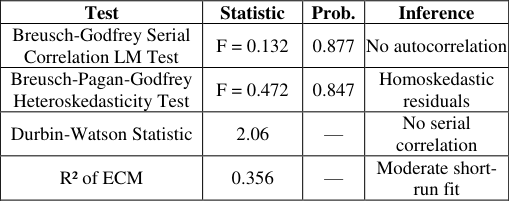 Table 6
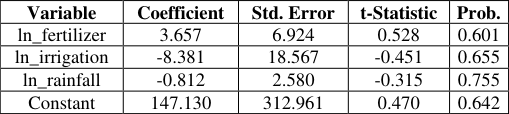 Table 4
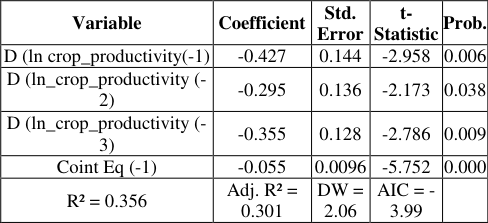 Table 5
Introduction
The agricultural sector in India holds significant importance. The agricultural sector generates 16-18% of GVA while employing nearly half of the total Indian workforce. It ensures food security, generates employment, and drives overall economic development. The agricultural sector shapes rural incomes and livelihoods, provides food and raw materials, and offers employment for a considerable portion of the population. India has been increasingly attaining self-sufficiency with impressive gains in agricultural production. But climate change and increasing population growth during the last several decades have made pressures on India's crop productivity. Some of the most important determinants of productivity are rainfall patterns, irrigation systems, and the use of fertilizers. To create sound policies for the agricultural sector, the government needs to understand the quantitative relationships between these determinants. Indian soils are typically regarded as low fertile soils because of significant deficiencies in micronutrients such as zinc, iron, and boron, as well as nitrogen, phosphorus and potassium. The low amount of soil organic carbon (SOC) in Indian soils is a major contributing factor to the decreased fertilizer use efficiency. (Srinivasarao, 2021) [14] . India ranks second globally and first in the South Asian Association for Regional Cooperation (SAARC) region in terms of total fertilizer consumption. This highlights India's intensive input-based farming system and significant contribution to the global fertilizer demand. According to Rao et al. (2018), balanced fertilizer application greatly increases cereal yields, especially in irrigated areas. Chaudhary (2021) [1,12] promoted precision nutrient management by highlighting the possible yield and environmental constraints associated with excessive fertilizer use. Patra et al. (2016) [11] investigated how fertilizer use affected agricultural output in Hooghly district of West Bengal. They found that there is no significant relationship between increased chemical fertilizer use and increases in agricultural yield and production. Irrigation is essential for increasing agricultural output as it guarantees a consistent supply of water and lessens reliance on erratic monsoon rains.
Irrigation also improves food security and stabilizes farmers' incomes by facilitating multiple cropping and promoting high-yield crops. Higher irrigation coverage reduces rainfall variability and produces more consistent yields (Singh and Sharma, 2019) [13] . Rainfall variability limits fertilizer efficiency, underlining the significance of supplemental irrigation (Kumar et al., 2020) [6] . Narayanamoorthy, Bhattarai, and Jothi (2018) studied the economic effects of drip irrigation in the production of vegetables in Tamil Nadu. They found that drip irrigation boosts crop yield by 52 percent while lowering the need for other inputs, like fertilizers, by 31 percent. According to a study by Jin, Yu, Jansen, and Muraoka (2012) [4] on the effect of irrigation on crop productivity in India found that irrigation has a significant and strong influence on agricultural productivity. Most farming in India still depends on monsoon rains and rainfall has a direct and substantial impact on agricultural output. While irregular or insufficient rainfall can result in droughts, crop failures, and decreased agricultural output, adequate and well-distributed rainfall promotes crop growth, boosts yields, and permits timely sowing and harvesting. As a result, agricultural production and food security are all significantly affected by rainfall patterns. According to Onyeji & Fischer (1993) [10] , climate change has resulted in lower consumer incomes, higher food prices, and decreased crop yields. Compared industrial and service sectors, agricultural sector is more economically and physically vulnerable to climate change (Gbetibouo and Hassan, 2005) [2] . This study also found that agricultural production is severely impacted by climate change. According to Nandhini et al. (2006), low rainfall and input scarcity in Tamil Nadu, India, are causing a decline in arable land for rice cultivation. According to Kapur et al. (2009) [5] , by the middle of the twenty-first century, rainfall could reduce crop yields by thirty percent. This study also observed that a decrease in arable land might put additional strain on India's agricultural output. These studies show that a variety of interrelated factors affect crop productivity, necessitating a thorough empirical investigation. Numerous studies examine agricultural inputs independently. A more comprehensive understanding of the relationships and relative contributions of fertilizer use, irrigation, and rainfall to crop productivity can be obtained by evaluating these factors together.
Objectives
to study the long-term trends in crop productivity, fertilizer use, irrigation and rainfall. to examine the short run and long run relationship between crop productivity and its major determinants.
Methodology Data Sources:
The study is based on secondary data over the period from 1981 to 2023. Data on fertilizer consumption (kg/ha), Crop productivity (kg/ha) and land area equipped for irrigation (ha) is obtained from FAOSTAT. Data on annual all-India Rainfall is collected from India Meteorological Department (IMD). Analytical Tools: The long-term trends in crop productivity, fertilizer consumption, irrigation, and rainfall during the period 1981-2023 were studied using a log-linear regression model. The short run and long run relationship between variables was examined using ARDL model. Average annual growth of crop productivity is 2.09% and was statistically significant at 1% level. This suggests steady productivity gains over the last four decades. Average annual growth of fertilizer consumption is 3.88%, and was statistically significant at 1% level. This reflects the inputintensive nature of Indian agriculture during the study period. Irrigation coverage increased at an average rate of 1.46% per annum. This indicates gradual but continuous improvements in water resource infrastructure. Rainfall exhibited a negligible and statistically insignificant increase of 0.11% per annum. This shows absence of a consistent long-term trend in rainfall.
Results and Discussion
Results and Discussion
Regression Analysis ARDL Model Estimation
The short run and long run relationship between variables was examined using ARDL model. The dependent variable was crop productivity and the independent variables were fertilizer, irrigation and rainfall. All the variables were expressed in natural logarithms. Unit root tests were done to confirm that the variables satisfy the conditions for ARDL model. The optimal lag structure (4, 0, 0, 0) was decided based on Akaike Information Criterion (AIC). As the computed F-statistic value (5.86) is larger than the upper bound critical value (3.67) at 5% significance level, we reject the null hypothesis of no relationship between levels. This proves the existence of a long-run cointegrating relationship between crop productivity and its determinants.
Long-Run Relationship
The long-run coefficients derived from the levels equation is given below The long run coefficients were not found significant. Fertilizer use has a positive long-run effect on crop productivity. This suggests that continuous application of fertilizer boosts farm productivity. Both rainfall and irrigation have negative long-run coefficients. This might be due to poor irrigation technology, soil salinization, or too much reliance on unpredictable rainfall patterns. The presence of cointegration indicates that despite short-run fluctuations, the variables move together towards a long-run equilibrium path.
Short-Run Dynamics and Error Correction Model (ECM):
The short-run dynamics were studied using the Error Correction Representation of ARDL model. The presence of a stable long-term relationship was confirmed by the highly significant (p < 0.01) and negative (-0.055) error correction term. A relatively slow but steady adjustment toward long-run equilibrium is indicated by the magnitude of the error correction term (-0.055). This suggests that about 5.5% of the short-run disequilibrium is corrected annually. The coefficients of lagged ΔLN_crop_productivity terms were negative and significant which indicates yield adjustments in response to previous fluctuations, demonstrating persistence and partial adjustment in agricultural productivity.
Diagnostic Tests
Diagnostic tests were conducted to validate the model
Conclusion
Understanding the impacts of fertilizers, irrigation, and rainfall on agricultural productivity helps policymakers to design focused interventions. The results of ARDL analysis have several policy implications with regard to agricultural development. The error correction term is significant which indicates that short run deviations adjust toward their long run equilibrium. This suggests the stability and validity of the estimated model for policy inferences. The empirical results of the ARDL model indicate that crop productivity is cointegrated with fertilizer, irrigation and rainfall in the long run. The results also reveal that fertilizer use is a consistent positive determinant of productivity. The results also points out that there is some scope for efficiency enhancement in irrigation practices to increase yield performance. Agricultural productivity can be greatly increased through the formulation of policies supporting balanced and economic fertilizer use. This requires interventions such as farmer trainings on nutrient management, enhanced access to soil testing services and targeted subsidies for ecofriendly or crop-specific fertilizers. Although irrigation contributes to increased crop productivity, the results suggest that there is a need for enhancing water-use efficiency rather than merely increasing irrigated area. Policymakers need to invest in modern irrigation systems like drip and sprinkler, encourage conjunctive use of surface water and groundwater and externalize the costs for adopting water saving technologies. Importance of rainfall in affecting crop yield emphasizes how agriculture is exposed to climatic change. This will require enhancing climate adaptation strategies, including the development of
Figures and tables from the paper
| Variable Coefficient | Growth Rate (% per annum) | p-value | R² | Trend Direction |
|---|---|---|---|---|
| Crop Productivity 0.02093 | 2.09 | <0.001 | 0.968 | Increasing |
| Fertilizer Use 0.0387659 | 3.88 | <0.001 | 0.940 | Increasing |
| Irrigation 0.0146091 | 1.46 | <0.001 | 0.964 | Increasing |
| Rainfall 0.00108962 | 0.11 | 0.160 | 0.063 | Slightly Increasing |
Table text extracted from the original PDF; superscript letters are shown inline. The original table image is below.
View original table image
| Test Statistic | Value | Significance | (0)Bound | I(1)Bound | Decision |
|---|---|---|---|---|---|
| F-statistic | 5.8599 | 5% | 2.79 | 3.67 | Cointegration exists |
| k (regressors) | 3 |
Table text extracted from the original PDF; superscript letters are shown inline. The original table image is below.
View original table image
| Test | Statistic | Prob. | Inference |
|---|---|---|---|
| Breusch-Godfrey Serial Correlation LM Test | F = 0.132 | 0.877 | No autocorrelation |
| Breusch-Pagan-Godfrey Heteroskedasticity Test | F = 0.472 | 0.847 | Homoskedastic residuals |
| Durbin-Watson Statistic | 2.06 | — | No serial correlation |
| R² of ECM | 0.356 | — | Moderate short- run fit |
Table text extracted from the original PDF; superscript letters are shown inline. The original table image is below.
View original table image
References
14 in the original paper- Chaudhary P. Sustainable nutrient management in Indian agriculture. J Soil Water Conserv. 2021;19(4):301-310.
- Gbetibouo GA, Hassan RM. Measuring the economic impact of climate change on major South African field crops: a Ricardian approach. Glob Planet Change. 2005;47:143-152.
- India Meteorological Department (IMD). Annual Rainfall Statistics of India. Pune, India; 2023.
- Jin S, Yu W, Jansen HGP, Muraoka R. The impact of irrigation on agricultural productivity: evidence from India. 2012. https://doi.org/10.22004/AG.ECON.126868
- Kapur D, Khosla R, Mehta PB. Climate change: India's options. Econ Polit Wkly. 2009;36(31):34-42.
- Kumar S, Patel R, Mehta D. Rainfall variability and fertilizer efficiency in India. J Agrometeorol. 2020;22(1):45-56.
- Ministry of Agriculture & Farmers' Welfare, Government of India. Agricultural Statistics at a Glance. New Delhi; 2023.
- Nandhini US, Alagumani T, Shibi S. Economic analysis of agriculture in southern parts of coastal India. Agric Trop Subtrop. 2006;39(4):279-284.
- Narayanamoorthy A, Bhattarai M, Jothi P. An assessment of the economic impact of drip irrigation in vegetable production in India. Agric Econ Res Rev. 2018;31(1):105-112.
- Onyeji SC, Fischer G. An economic analysis of potential impacts of climate change in Egypt. IIASA Working Paper. 1993;93(12). Laxenburg.
- Patra S, Mishra P, Mahapatra SC, Mithun SK. Modelling impacts of chemical fertilizer on agricultural production: a case study on Hooghly district, West Bengal, India. Model Earth Syst Environ. 2016;2(4):111.
- Rao K, Singh P, Kumar R. Impact of fertilizer use on cereal crop yields in India. Indian J Agric Econ. 2018;73(2):123-138.
- Singh A, Sharma V. Irrigation and crop productivity: evidence from Indian states. Agric Water Manag. 2019;211:1-10.
- Srinivasarao CH. Programmes and policies for improving fertilizer use efficiency in agriculture. Indian J Fertil. 2021;17(3):226-254.
Cited by 1
From OpenAlex, OpenCitations and reference lists read by Scinovex
- Assessing the Comparative Impact of Climate Variability and Irrigation Infrastructure on Rice and Wheat Yield: Evidence from Haryana ↗
Jagjeet Singh, Anish Kumar, Pullaiah Cheepi · AgroEnvironmental Sustainability · 2026
This study analyses the impact of irrigation infrastructure and climate variability on rice and wheat yields across 22 districts of Haryana using a panel dataset from 2014-15 to 2022-23, collected from the Department of Economic and Statistical Affairs, Government of Haryana; additionally, data on climate variables such as rainfall, temperature, and relative humidity were collected from the NASA Power Data…
❝ 0PDF