
Research article · 2025 · Full text
International Journal of Geography Geology and EnvironmentAssessment of forest cover in Hoshiarpur tehsil: A study based on remote sensing techniques
Volume 7(10) · Pages 55–58 · DOI: 10.22271/27067483.2025.v7.i10a.429 ↗
Research areasRemote Sensing in Agriculture
Abstract
Author-writtenForests known as Lungs of planet Earth remain under pressure due to rapid deforestation across the globe. The quantification of forest land change lags behind even after its ecological importance. The present study makes an effort to detect, discuss, and define the transformation in forest cover in Hoshiarpur Tehsil of Hoshiarpur District, located in Punjab, State of India. There is a vast difference in Forest cover among the States of India, and Punjab is one of the least forested states of the Country. Hoshiarpur District, due to its location in foothills of Shiwalik Range of Himalaya, contains most forest cover of the State. Among the four Tehsils of the district, Hoshiarpur being the largest is selected for research to examine and analyze the Forest cover change between the period of 1990 to 2025. Landsat imagery with 30 meter resolution is explored to detect existing variation between two periods. The images are preprocessed, and False Colour Composition (FCC) is created for the better detection of Vegetation cover in supervised classification. To exemplify the preceding notion, the band combination of band 5, band 4, and band 3 is exploited to generate FCC that represent the vegetation in multiple shades of red colour for better detection and observation.
Summary
Source-checkedPlain-language reading of the full paper, prepared with AI and checked against the text. Each point links to the authors' own words.
Why it matters
- Forests are ecologically critical as the 'Lungs of planet Earth' but are currently facing global pressure from rapid deforestation. View evidence ↗
- Forest cover varies significantly across Indian states, with Punjab being among the least forested. View evidence ↗
- Hoshiarpur District holds the majority of Punjab's forest cover because it is located in the Shiwalik Range foothills of the Himalayas. View evidence ↗
The question
- The study aims to examine and analyze changes in forest cover within the Hoshiarpur Tehsil from 1990 to 2025. View evidence ↗
What they did
- The research analyzed a total area of 111,801 hectares within the Hoshiarpur Tehsil. View evidence ↗
- The study used USGS Surface Reflectance images from Landsat 5 (TM) for 1990 and Landsat 8 (OLI) for 2025. View evidence ↗
- A 'Random Forest' classifier in Google Earth Engine (GEE) was used for supervised classification of forested and non-forested areas. View evidence ↗
What they found
- Forest area in Hoshiarpur Tehsil decreased from 37,155 hectares in 1990 to 27,674 hectares in 2025. View evidence ↗
- The percentage of the tehsil's geographical area covered by forest dropped from 33.23% in 1990 to 24.75% in 2025. View evidence ↗
- During the study period, 13,503 hectares of forest were converted to non-forest land, while only 4,022 hectares of new forest were added. View evidence ↗
- Agricultural development in lower flood-prone areas, facilitated by check dams, led to tree cutting and rapid forest decline. View evidence ↗
- Most land located below 300 meters above sea level has been converted into agricultural land. View evidence ↗
What it means
- The authors conclude that the sharp decline in forest cover in Hoshiarpur Tehsil is worrisome and primarily linked to the conversion of gentle slope areas into agriculture. View evidence ↗
- The authors state that the 30x30 meter resolution of Landsat images may be unsuitable for small area studies due to the potential for pixel merging between forest and non-forest areas. View evidence ↗
Visual summary
2 visualsIllustrations explain the paper; charts are replotted from the paper's own table values.
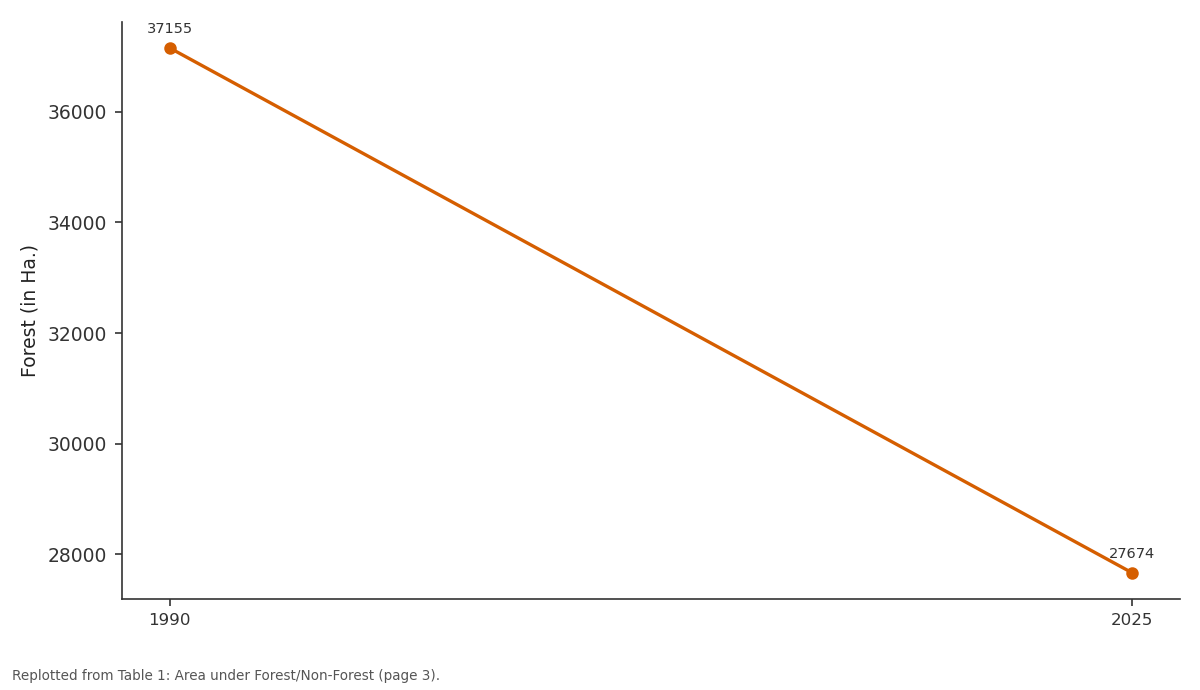
Forest (in Ha.): 1990 vs 2025
Replotted from Table 1 (page 3) of the original paper. Every bar is the paper's own table value.
View source evidence ↗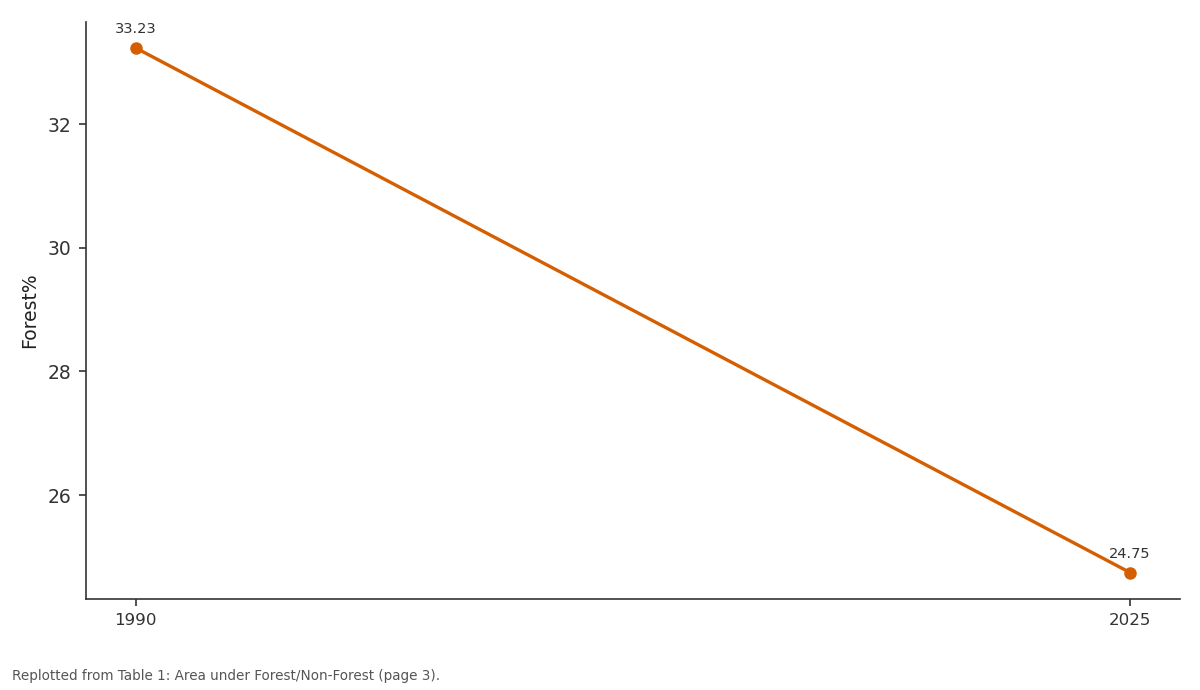
Forest%: 1990 vs 2025
Replotted from Table 1 (page 3) of the original paper. Every bar is the paper's own table value.
View source evidence ↗Figures & tables
From the original paper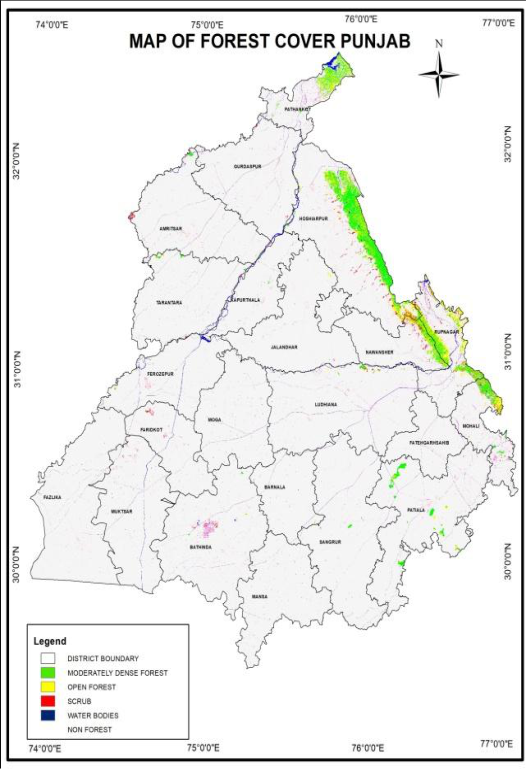 Figure 1
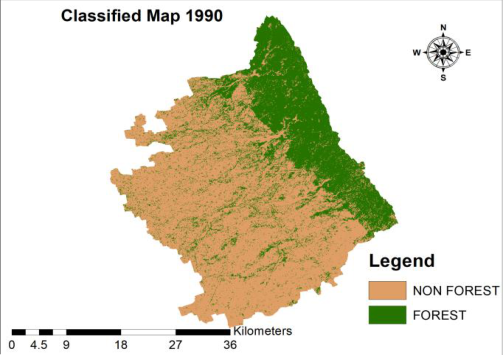 Figure 2
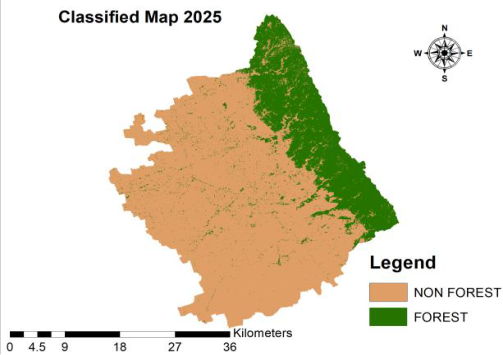 Figure 3
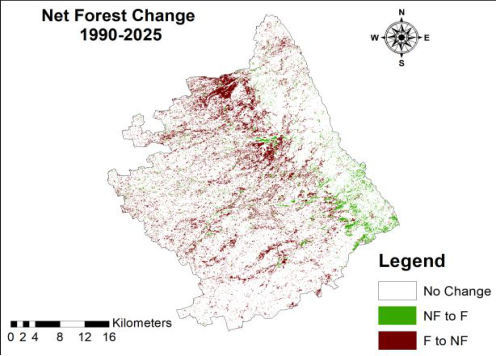 Figure 4
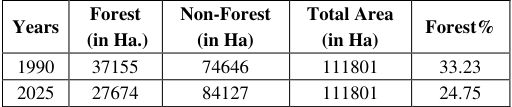 Table 1
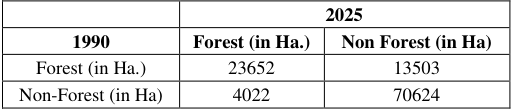 Table 2
 Table 3
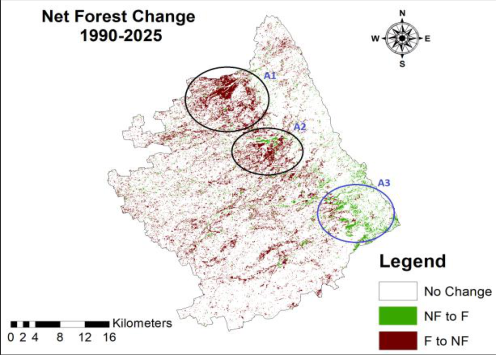 Figure 5
Introduction
Forest Cover change is driven by the combination of demographic, natural, social, economic, biophysical, and political processes (Steven Vanonckelen and Anton Van Rompaey). Net Forest Change (variation between afforestation and deforestation) was estimated 5.2 million hectare per year in 2000-2010, 7.8 million hectare per year in 1990-2000, and 4.7 million hectare per year in 2010-2020 (FAO. 2024) [5] . The expansion of agriculture, increasing requirement of timber and wildfires are some major causes of deforestation. Due to lack of data repositories on worldwide forest cover change, the satellite-based earth observation has its importance in Time and Space because it provides visible information to analyze world against forest dynamics (Hansen, Matthew C., et al. 2010) [3] . The U.S. Landsat mission launched on July 23, 1972, carrying Remote Sensing observation instruments, delivers scientifically important images of Earth surface (NASA). A number of image processing software are available to extract valuable information out of these satellite images. Notable among these are Google Earth Engine (GEE) and ArcGIS. Therefore, the Landsat data is used to analyze long term changes in forest cover of study area (1990-2025) through Google Earth Engine (GEE) and ArcGIS.
Study Area
The present Study Area is Hoshiarpur tehsil of Hoshiarpur District of Punjab. Having an area of 50362 KM
Research Methodology
The study is primarily based on the images of Landsat 5(TM) and Landsat 8 (OLI). Surface Reflectance (SR) images are taken from USGS. Landsat 5 image is exploited to the analysis of year 1990 and Landsat 8 for year 2025. First, all images are filtered for Cloud cover with 'maskL457sr' and 'maskL8sr' functions to remove cloudy pixels and cloud shadows. Second, annual Median Composition is taken. Third, False Colour Composite (FCC) is taken by different band combination that is assigned to all channels (Red, Blue, and Green). As depicted, the FCC images are quite useful in the detection of Vegetation. Fourth, a Supervised Classification is employed through collecting samples of Forested and Non-Forested areas. Finally, 'Random Forest' classifier is used in GEE to train and test data.
Discussion and Results
Punjab as located in North-Western side of the country is part of vast Indo-Gangetic plains. With fertile alluvial soil capacity, state has well-developed agriculture sector, for instance, 98% of its agricultural area is under irrigation. So, the receding forest is a final outcome of the preceding effect. Most of the forest cover in state is concentrated in Shiwalik foothills (Figure 1) because the undulating terrain of these areas is not suitable for agriculture. Dry Deciduous is a major forest type found in the State. As reported by Forest Survey of India, there is a decline of-0.45% forest cover in the state from 2021 to 2023. The attribute tables of Forest and Non-Forest areas are prepared from classified images to analyze forest area in Hoshiarpur Tehsil since 1990 to 2025. The change matrix is also prepared to assess net forest change between two time periods. The study demonstrates that the area under Forest in 1990 was 37155 Hectare that declined to 27674 Hectare in 2025. Forest cover occupied 33.23% of the Geographical area of the tehsil in 1990 which reduced to 24.75% in 2025.One can witness a net loss of 9481 Hectare forest area between two time periods. There are a number of seasonal streams in the study area which are called 'Choe' in local dialect. During Monsoon season these Choe overflow and cause siltation and flooding in downstream areas. The whole belt of this undulating foothill topography, which have fragile soil and seasonal streams, is known as Kandi Belt-'an island of poverty amidst the ocean of development' covering about 9% geographical area of Punjab (Karam Singh, et al. 2018) [1] . The Government in order to improve the situation of the area launched 'Kandi Watershed and Area Development Project'appraised by World Bank in 1978 which became effective in 1980 (Karam Singh, et al. 2018) [1] . The construction of Check Dams began in the area to control floods and to improve irrigation facilities. The most notable among these Check Dams in the study area is Dholbaha Dam. Other notables Dams are Janauri Dam, Damsal Dam, Chohal Dam, Saleran Dam, Nara Dam, and Patiari Dam. The construction of these Dams improved irrigation and helped to organise agriculture in lower Watershed areas.
The construction of Dholbaha Dam, which was completed in 1987, signified great improvement in agriculture and settlements downstream area. The progressive agriculture development in lower flood prone areas however leads to tree cutting and rapid decline in forest cover (figure 5,A1). The downstream areas of Janauri and Damsal Dam too witnessed such kind of second decline (figure 5,A2). In addition, most of the area below 300 m height from sea level is now converted into agriculture land.
Conclusion
The importance of forests is immense for the World. These are vital for various types of life on planet. Forests provide clean air, food, support biodiversity, and absorb Carbon dioxide. But intense human activities, for example, agriculture expansion, urbanisation, mining and forest fires cause rapid decline in forest cover area across world. The given time span (1990 to 2020) observes an estimated loss of 420 million hectares forest covers across the globe. The aforementioned pattern secures a suitable space in the present study. Sharp decline in forest cover in Hoshirpur Tehsil is a worrisome situation. Most of the decline is associated with gentle slope area which is suitable for agriculture. In contrast, forest cover in hilly part of the tehsil spreads day by day that appears less affected by human activities. Government of Punjab also launched 'The Green Punjab Mission (GPM)' in order to increase tree cover in state by tree plantation drive.
Limitations of the study
The study is based on Landsat Images. These have a resolution of 30x30 meters that seems less suitable for small area study because ample chances of a merger between neighbouring pixels of Forest with Non-Forest can occur.
Figures and tables from the paper
| — | 2025 | — |
|---|---|---|
| 1990 | Forest (in Ha.) | Non Forest (in Ha) |
| Forest (in Ha.) | 23652 | 13503 |
| Non-Forest (in Ha) | 4022 | 70624 |
Table text extracted from the original PDF; superscript letters are shown inline. The original table image is below.
View original table image
References
6 in the original paper- Singh JS, Kushwaha SPS. Forest biodiversity and its conservation in India. Int For Rev. 2008;10(2):292-304. Available from: http://www.jstor.org/stable/43740343.
- Vanonckelen S, Van Rompaey A. Spatiotemporal analysis of the controlling factors of forest cover change in the Romanian Carpathian Mountains. Mount Res Dev. 2015;35(4):338-50. Available from: http://www.jstor.org/stable/mounresedeve.35.4.338.
- Hansen MC, et al. Quantification of global gross forest cover loss. Proc Natl Acad Sci U S A. 2010;107(19):8650-55. Available from: http://www.jstor.org/stable/25681471.
- NASA. Landsat Satellites Timeline. Available from: https://landsat.gsfc.nasa.gov/satellites/timeline/#:~:text =On%20July%2023%2C%201972%2C%20the,stunnin g%20images%20of%20the%20Earth.
- FAO. The State of the World's Forests 2024-Forestsector innovations towards a more sustainable future. Rome: FAO; 2024. Available from: https://doi.org/10.4060/cd1211en.
- Singh K, et al. Kandi Watershed Development Project: A critical evaluation. Econ Polit Wkly. 1993;28(52):A122-28. Available from: http://www.jstor.org/stable/4400589.