
Research article · 2025 · Full text
International Journal of Biology SciencesStudies on certain physico-chemical parameters of Visapur Dam, Maharashtra, India
Volume 7(10) · Pages 53–55 · DOI: 10.33545/26649926.2025.v7.i10a.498 ↗
Research areasFish Biology and Ecology StudiesWater Quality and Pollution Assessment
Abstract
Author-writtenStudies were conducted at the Visapur Dam (Ahilyanagar, Maharashtra) for a period of two years. Certain physico-chemical parameters as pH, temperature, TDS, salinity, hardness, turbidity, chloride, total alkalinity, and dissolved oxygen were measured. The effect of water parameters on the flora and fauna are discussed. Such studies are important to understand the importance of water environmental parameters on aquatic habitats as dams.
Summary
Source-checkedPlain-language reading of the full paper, prepared with AI and checked against the text. Each point links to the authors' own words.
Why it matters
- Monitoring environmental parameters is essential for understanding and maintaining the overall health, productivity, and balance of an ecosystem. View evidence ↗
- The suitability of water for aquatic life is determined by physical and chemical parameters, including pH, temperature, salinity, and dissolved oxygen. View evidence ↗
- Shifts in water parameters can serve as indicators of pollution or contamination originating from domestic, agricultural, or industrial sources. View evidence ↗
What they did
- The research was conducted at the Visapur dam, located near Shrigonda, Ahmednagar. View evidence ↗
- Three monitoring stations were selected based on accessibility, pollution status, and human interference, and were monitored from October 2022 to September 2024. View evidence ↗
- The measured parameters included dissolved oxygen, total alkalinity, chloride, turbidity, hardness, salinity, TDS, temperature, and pH. View evidence ↗
- Water parameters were monitored using standard kits from Aquasol and Hanna, as well as multiparameter meters from Eutech and Hanna. View evidence ↗
What they found
- The pH of the water fluctuated between 6.97 and 8.27, ranging from slightly acidic to alkaline. View evidence ↗
- Water temperature varied between 22.3°C and 33.0°C, reflecting seasonal changes. View evidence ↗
- Turbidity levels were moderate, with values ranging from 11.4 to 16.2 NTU. View evidence ↗
- TDS varied between 95.7 and 156.7 mg/L, while salinity ranged from 67.5 to 111.2 mg/L. View evidence ↗
- Total hardness ranged from 183.3 to 320 mg/L, and total alkalinity fluctuated between 102.7 and 187.7 mg/L. View evidence ↗
- Dissolved oxygen levels, which are critical for aquatic life, ranged from 4.6 to 6.4 mg/L. View evidence ↗
- Chloride concentrations in the water ranged from 21.1 to 32.8 mg/L. View evidence ↗
- All measured physico-chemical parameters of the Visapur dam were found to be within the permissible limits set by regulatory authorities. View evidence ↗
What it means
- The authors conclude that the Visapur dam is non-polluted and suitable for industrial, agricultural, and domestic use. View evidence ↗
- The study emphasizes the need for the future conservation and protection of these habitats. View evidence ↗
Visual summary
2 visualsIllustrations explain the paper; charts are replotted from the paper's own table values.
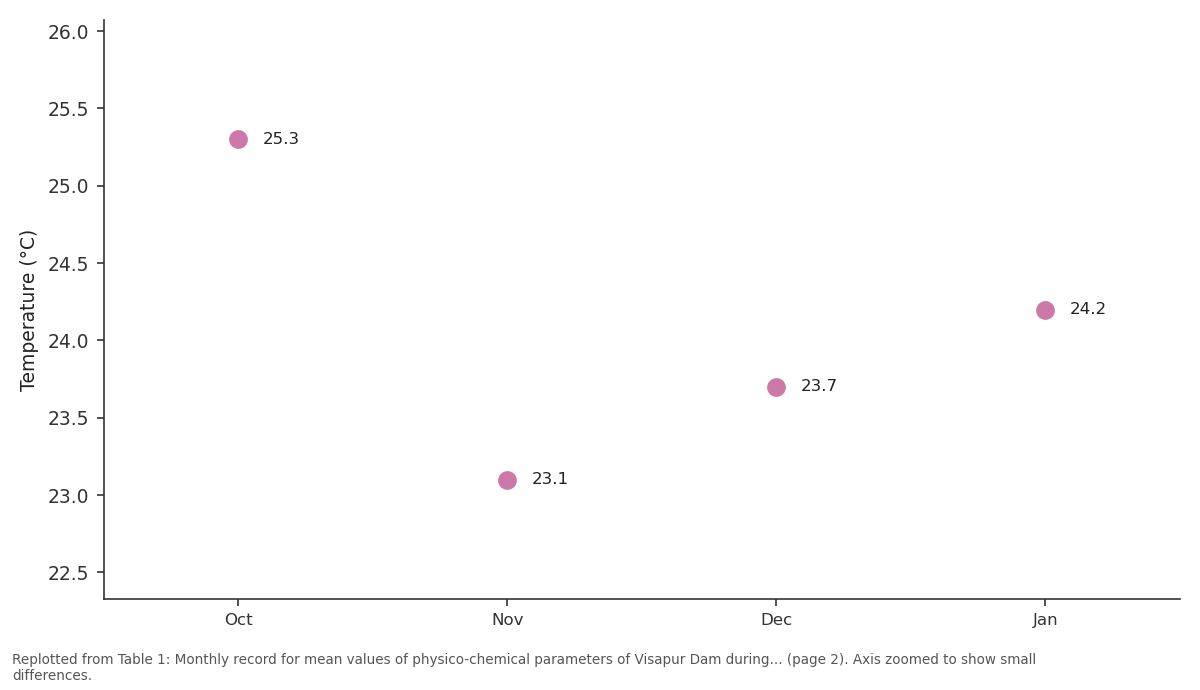
Temperature (°C): Oct vs Nov vs Dec vs Jan
Replotted from Table 1 (page 2) of the original paper. Every bar is the paper's own table value.
View source evidence ↗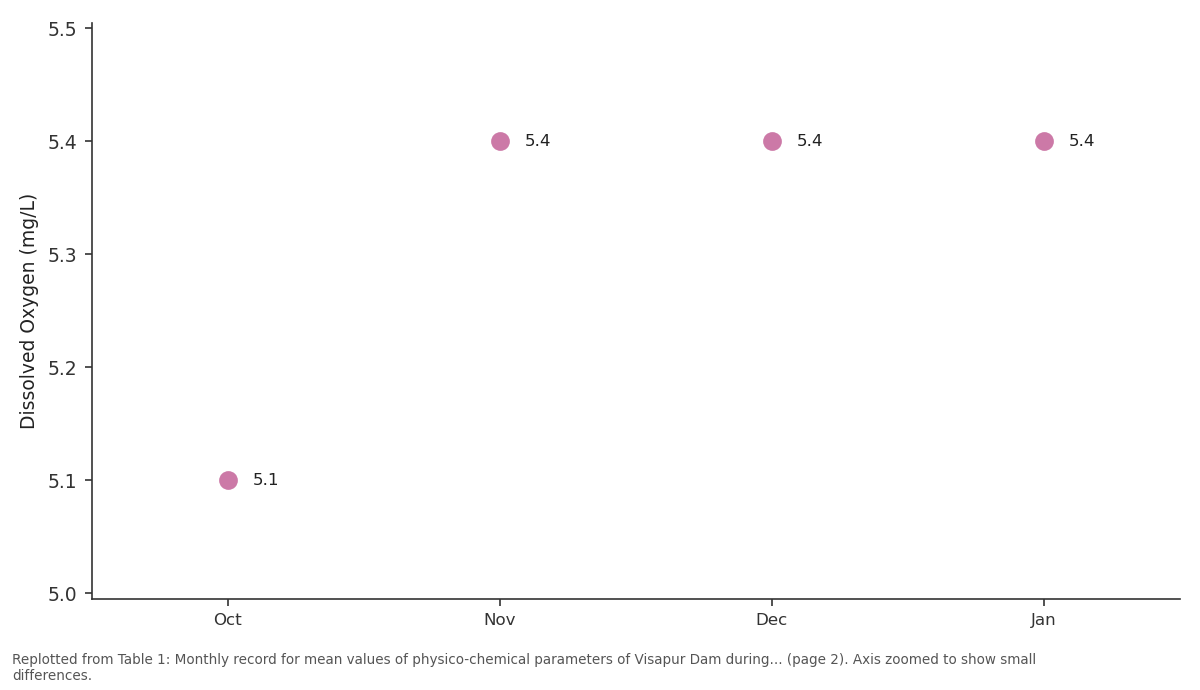
Dissolved Oxygen (mg/L): Oct vs Nov vs Dec vs Jan
Replotted from Table 1 (page 2) of the original paper. Every bar is the paper's own table value.
View source evidence ↗Figures & tables
From the original paper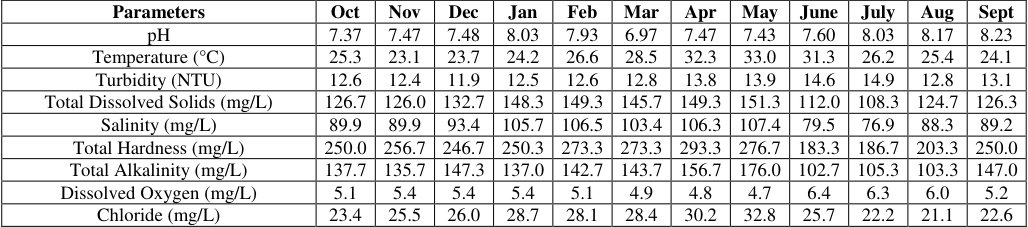 Table 1
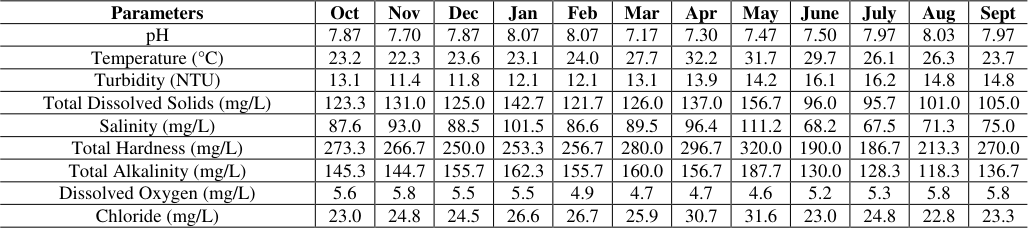 Table 2
Introduction
Studying the environmental parameters of an ecosystem is important because it helps us understand and maintain the health, productivity, and balance of that ecosystem. Physical and chemical parameters, such as temperature, pH, dissolved oxygen, and salinity, determine the suitability of water for aquatic life. Each aquatic organism living in the water has specific environmental needs. It is important to study these parameters to ensure favourable conditions for the survival and growth of aquatic organisms. Such studies also help us understand the interactions among biotic and abiotic factors, ensuring the ecological stability of the ecosystem. Changes in any of the prevailing parameters may indicate contamination or pollution from industrial, agricultural, or domestic sources. In water bodies such as ponds, lakes, reservoirs, and culture systems such as fish or pearl culture, monitoring helps optimize growth and prevent diseases. Regular observation and monitoring help identify the early signs of ecosystem stress or imbalance, which can result in changes in species diversity and abundance. Finally, understanding environmental conditions helps protect local endangered species and restore damaged habitats. Thus, environmental studies have important implications for biodiversity, ecology, aquaculture, and other allied fields. Physical and chemical properties of water body are important as they in turn result in formation of food chains and webs. Occurrence of zooplankton is affected by the complex interaction of various physical, chemical, geographical, biological and ecological parameters (Vanjare and Pai, 2013) [12] . Each of these factors individually contributes to the formation of zooplankton assemblages as well as their seasonal occurrence. However, the ultimate effect is the result of the interplay and interaction among all these environmental factors (Hulyal and Kaliwal, 2008) [7] . Ecological work on freshwater zooplankton for the first time was done in a small tank in Calcutta, West Bengal, followed by many studies in India and Maharashtra (Battish, 1992; Ranga Reddy, 2001; Slathia and Dutta, 2013) [1,10,11] . Phytoplankton and bacteria are dependent on chemicals and fertilizers for their growth. Zooplankton the feed on these smaller organisms, which in turn are eaten by fishes and other major organisms. Especially in aquaculture this becomes extremely important. All carps in their larval and juvenile stages feed exclusively on zooplankton which becomes an important constituent of energy for the. The current study over a period of 2 years (2022-24) at a manmade reservoir in Ahilyanagar district tries to understand the changes in physical and chemical conditions. This water body has been studied for its zooplankton, sponges, fish and avian fauna (Bhalsing and Pokale, 2023; 2025; 2025) [2][3][4] .
Materials and Methods
The study was conducted at the Visapur dam, near Shrigonda, Ahmednagar (18.8035565°N 74.5827484°E). The Visapur dam is an earthfill dam on the Hanga River in Ahmednagar. Three stations were selected based on human interference, pollution status, and accessibility. The selected stations were monitored for selected environmental parameters for two years from October 2022 to September 2024. Environmental parameters of water, such as pH, temperature, TDS, salinity, hardness, turbidity, chloride, total alkalinity, and dissolved oxygen, were measured at all three stations. Standard multiparameter meters (Eutech, Hanna) and kits (Aquasol, Hanna) were used to monitor environmental parameters. Readings were taken on-site and noted immediately. Environmental data and correlation studies were analyzed from the study area using software such as PAST software and Microsoft Excel.
Results and Discussion
The environmental parameters were studied over a period of two years from September 2022-August 2024. Water parameters as, pH, Temperature, Salinity, TDS, Conductivity, turbidity, hardness, alkalinity, chloride and Dissolved Oxygen were studied for the said period. The results indicate an improvement in the condition of water in both water bodies. The study also highlights the necessity for future protection and conservation of such habitats. The water quality parameters exhibited significant variations over the two-year study period. pH levels fluctuated between slightly acidic to alkaline, with a range of 6.97 to 8.27. Water temperature showed considerable variation, ranging from 22.3°C to 33.0°C, indicating seasonal fluctuations. Turbidity levels remained relatively moderate, ranging from 11.4 to 16.2 NTU. Total Dissolved Solids (TDS) and salinity demonstrated notable changes, with TDS varying between 95.7 and 156.7 mg/L and salinity between 67.5 and 111.2 mg/L. Other important water quality indicators also showed variations during the study period. Total hardness ranged from 183.3 to 320 mg/L, while total alkalinity fluctuated between 102.7 and 187.7 mg/L. Dissolved oxygen levels, crucial for aquatic life, varied from 4.6 to 6.4 mg/L. Chloride concentrations showed a range of 21.1 to 32.8 mg/L. These fluctuations in water quality parameters suggest the influence of various environmental factors, potentially including seasonal changes, anthropogenic activities, or natural processes affecting the water body over the two-year period. The pH ranged from neutral to slightly alkaline, and were more or less similar in trend for both the years. Aquatic organisms as fish and zooplankton are affected by pH because most of their metabolic activities dependent on minute temperature changes. The temperature values are also in line with the subtropical conditions than occur in India. Maximum temperature was seen in the summer months, and lower in winter months. The water temperature significantly affects all metabolic and physiological activities, as well as life processes such as feeding, reproduction, movement, and distribution of aquatic organisms. Salinity values are lower for both the years and are important as they define the presence or absence of freshwater and/or brackish water species. Salinity was maximum in summer months than in rainy season.
Dissolved Oxygen values were also towards a higher side and indicates good water quality. DO was maximum in winter and rainy as compared to summer months. Lower values in summer might be due to the input of sewage and agricultural wastes, as biochemical decomposition of organic matter is higher then. The water chemistry changed over the both years in similar fashion, and the season changes (summer, winter, and monsoon) seem to have effect on the environmental parameters.
It was observed that all physico-chemical parameters of Visapur dam are within a range of the permissible limits stated by the regulatory authorities. The water parameters also coincide with most of the studies that have taken place in Maharashtra and India. It can be concluded water of
Acknowledgement
AcknowledgmentsAuthor (DGB) would like to thank the Chairman, Secretary and the Principal, Ahmednagar College, Ahilyanagar for their help and support.
Figures and tables from the paper
| Parameters | Oct | Nov | Dec | Jan | Feb | Mar | Apr | May | June | July | Aug | Sept |
|---|---|---|---|---|---|---|---|---|---|---|---|---|
| pH | 7.37 | 7.47 | 7.48 | 8.03 | 7.93 | 6.97 | 7.47 | 7.43 | 7.60 | 8.03 | 8.17 | 8.23 |
| Temperature (°C) | 25.3 | 23.1 | 23.7 | 24.2 | 26.6 | 28.5 | 32.3 | 33.0 | 31.3 | 26.2 | 25.4 | 24.1 |
| Turbidity (NTU) | 12.6 | 12.4 | 11.9 | 12.5 | 12.6 | 12.8 | 13.8 | 13.9 | 14.6 | 14.9 | 12.8 | 13.1 |
| Total Dissolved Solids (mg/L) | 126.7 | 126.0 | 132.7 | 148.3 | 149.3 | 145.7 | 149.3 | 151.3 | 112.0 | 108.3 | 124.7 | 126.3 |
| Salinity (mg/L) | 89.9 | 89.9 | 93.4 | 105.7 | 106.5 | 103.4 | 106.3 | 107.4 | 79.5 | 76.9 | 88.3 | 89.2 |
| Total Hardness (mg/L) | 250.0 | 256.7 | 246.7 | 250.3 | 273.3 | 273.3 | 293.3 | 276.7 | 183.3 | 186.7 | 203.3 | 250.0 |
| Total Alkalinity (mg/L) | 137.7 | 135.7 | 147.3 | 137.0 | 142.7 | 143.7 | 156.7 | 176.0 | 102.7 | 105.3 | 103.3 | 147.0 |
| Dissolved Oxygen (mg/L) | 5.1 | 5.4 | 5.4 | 5.4 | 5.1 | 4.9 | 4.8 | 4.7 | 6.4 | 6.3 | 6.0 | 5.2 |
| Chloride (mg/L) | 23.4 | 25.5 | 26.0 | 28.7 | 28.1 | 28.4 | 30.2 | 32.8 | 25.7 | 22.2 | 21.1 | 22.6 |
Table text extracted from the original PDF; superscript letters are shown inline. The original table image is below.
View original table image
| Parameters | Oct | Nov | Dec | Jan | Feb | Mar | Apr | May | June | July | Aug | Sept |
|---|---|---|---|---|---|---|---|---|---|---|---|---|
| pH | 7.87 | 7.70 | 7.87 | 8.07 | 8.07 | 7.17 | 7.30 | 7.47 | 7.50 | 7.97 | 8.03 | 7.97 |
| Temperature (°C) | 23.2 | 22.3 | 23.6 | 23.1 | 24.0 | 27.7 | 32.2 | 31.7 | 29.7 | 26.1 | 26.3 | 23.7 |
| Turbidity (NTU) | 13.1 | 11.4 | 11.8 | 12.1 | 12.1 | 13.1 | 13.9 | 14.2 | 16.1 | 16.2 | 14.8 | 14.8 |
| Total Dissolved Solids (mg/L) | 123.3 | 131.0 | 125.0 | 142.7 | 121.7 | 126.0 | 137.0 | 156.7 | 96.0 | 95.7 | 101.0 | 105.0 |
| Salinity (mg/L) | 87.6 | 93.0 | 88.5 | 101.5 | 86.6 | 89.5 | 96.4 | 111.2 | 68.2 | 67.5 | 71.3 | 75.0 |
| Total Hardness (mg/L) | 273.3 | 266.7 | 250.0 | 253.3 | 256.7 | 280.0 | 296.7 | 320.0 | 190.0 | 186.7 | 213.3 | 270.0 |
| Total Alkalinity (mg/L) | 145.3 | 144.7 | 155.7 | 162.3 | 155.7 | 160.0 | 156.7 | 187.7 | 130.0 | 128.3 | 118.3 | 136.7 |
| Dissolved Oxygen (mg/L) | 5.6 | 5.8 | 5.5 | 5.5 | 4.9 | 4.7 | 4.7 | 4.6 | 5.2 | 5.3 | 5.8 | 5.8 |
| Chloride (mg/L) | 23.0 | 24.8 | 24.5 | 26.6 | 26.7 | 25.9 | 30.7 | 31.6 | 23.0 | 24.8 | 22.8 | 23.3 |
Table text extracted from the original PDF; superscript letters are shown inline. The original table image is below.
View original table image
References
10 in the original paper- Battish SK. Freshwater Zooplankton of India. New Delhi: Oxford and IBH Publishing Co. Pvt. Ltd.; 1992, p. 233.
- Bhalsing DG, Pokale SN. Occurrence of some freshwater rotifers from Visapur Dam, Ahmednagar, Maharashtra, India. Uttar Pradesh J Zool. 2023;44(16):100-106.
- Dhanapathi MVSSS. Taxonomic notes on the rotifers from India (1889-2000); 2000.
- Harkal AD, Mokashe SS. First record of Hislopia malayensis Annandale, 1916 (Bryozoa: Gymnolaemata) from freshwaters of India. J Threat Taxa. 2018;10(10):12432-12433.
- Hulyal SB, Kaliwal BB. Water quality assessment of Almatti Reservoir of Bijapur (Karnataka State, India) with special reference to zooplankton. Environ Monit Assess. 2008;139(1):299-306.
- Pandarkar AK, Pawar BA, Shendge AN. Zooplankton diversity of Visapur Reservoir in Ahmednagar District, Maharashtra. J Exp Zool India. 2014;327-9.
- Manickam N, Bhavan PS, Santhanam P, Muralisankar T, Srinivasan V, Vijayadevan K, et al. Biodiversity of freshwater zooplankton and physico-chemical parameters of Barur Lake, Krishnagiri District, Tamil Nadu, India. Malaya J Biosci. 2015;2(1):1-12.
- Ranga Reddy Y. Zooplankton diversity: freshwater planktonic Copepoda with key to common Calanoid and Cyclopoid genera in India. In: Sharma BK, editor. Water quality assessment, biomonitoring and zooplankton diversity. 2001, p. 174-189.
- Slathia D, Dutta SPS. Hydrobiological study of subtropical Shiwalik Lake, Jammu, J&K, India. Int J Chem Environ Biol Sci. 2013;1(1):143-148.
- Vanjare A, Pai K. Ecology of freshwater Rotifera in a seasonal pond of the University of Pune (Maharashtra, India). Appl Ecol Environ Res. 2013;11(4):525-539.