
Research article · 2025 · Full text
International Journal of Agriculture and Food ScienceGrowth and Marketing Efficiency of Horticultural Crops in Kaparada, Gujarat
Volume 7(10) · Pages 173–176 · DOI: 10.33545/2664844x.2025.v7.i10c.869 ↗
Research areasAgricultural Economics and Practices
Abstract
Author-writtenThe study investigates the growth patterns and marketing efficiency of key horticultural crops in the Kaparada area of Valsad district, Gujarat. Over the past few decades, Gujarat has witnessed remarkable agricultural development, with horticulture emerging as a vital driver of the rural economy. This research focuses on understanding the performance of marketing channels for tomato and sweet potato in the Nana Pondha market of Kaparada region. Primary data were collected from producers, intermediaries, and retailers to analyze marketing costs, price spread, and efficiency across different channels. The findings reveal significant variation in marketing efficiency, with channel-I demonstrating the highest efficiency due to the absence of multiple intermediaries and reduced consumer price, while channel-III exhibited the lowest efficiency because of higher costs and wider price spread. The results highlight the importance of efficient market linkages in enhancing farmers’ income and reducing consumer burden. The study underscores the role of government initiatives, cooperative efforts, and improved market infrastructure in strengthening horticultural value chains. Policy recommendations emphasize the need for reducing intermediary layers, promoting direct farmer-consumer linkages, and encouraging collective marketing to ensure sustainable growth and equitable returns in the horticulture sector of Kaparada, Gujarat.
Summary
Source-checkedPlain-language reading of the full paper, prepared with AI and checked against the text. Each point links to the authors' own words.
Why it matters
- Horticulture has become a critical component of the rural economy in Gujarat due to significant agricultural development over recent decades. View evidence ↗
- The Kaparada region in the Valsad district is a major producer of horticultural crops, particularly sweet potato and tomato. View evidence ↗
- Existing research indicates that farmers' shares of consumer prices for perishable vegetables are often reduced by poor post-harvest infrastructure and too many intermediaries. View evidence ↗
The question
- The study aims to document cropping patterns, identify marketing channels, and measure the producer share and marketing efficiency for selected crops in Kaparada. View evidence ↗
What they did
- Researchers used a mixed-methods approach, collecting primary data through structured questionnaires from a stratified sample of retailers, wholesalers, commission agents, and farmers in the Nana Pondha market. View evidence ↗
- Secondary data regarding regional horticulture trends were sourced from published literature and government reports. View evidence ↗
- Marketing efficiency was calculated as the value of output divided by the marketing cost, alongside measurements of price spread, margins, and costs. View evidence ↗
What they found
- For tomato marketing, Channel-1 (Producer-Consumer) was the most efficient at 12.36%, while Channel-3 (Producer-Wholesaler-Retailer-Consumer) was the least efficient at 5.52%. View evidence ↗
- Tomato price spreads were lowest in Channel-1 (8.08%) and highest in Channel-3 (18.08%). View evidence ↗
- For sweet potato, the lowest marketing cost was found in Channel-1 (100 Rs/qt) and the highest in Channel-3 (178 Rs/qt). View evidence ↗
- Sweet potato price spreads ranged from a low of 4.16% in Channel-1 to a high of 7.18% in Channel-3. View evidence ↗
- Channel-1 was determined to be the most efficient marketing route for sweet potato due to the lack of intermediaries and lower consumer prices. View evidence ↗
What it means
- The authors conclude that improving marketing efficiency in Kaparada requires investment in market infrastructure, the promotion of collective marketing, and stronger direct market linkages. View evidence ↗
- The authors recommend supporting the creation of farmer cooperatives and FPOs, as well as investing in cold chain solutions and local aggregation centers. View evidence ↗
Visual summary
3 visualsIllustrations explain the paper; charts are replotted from the paper's own table values.
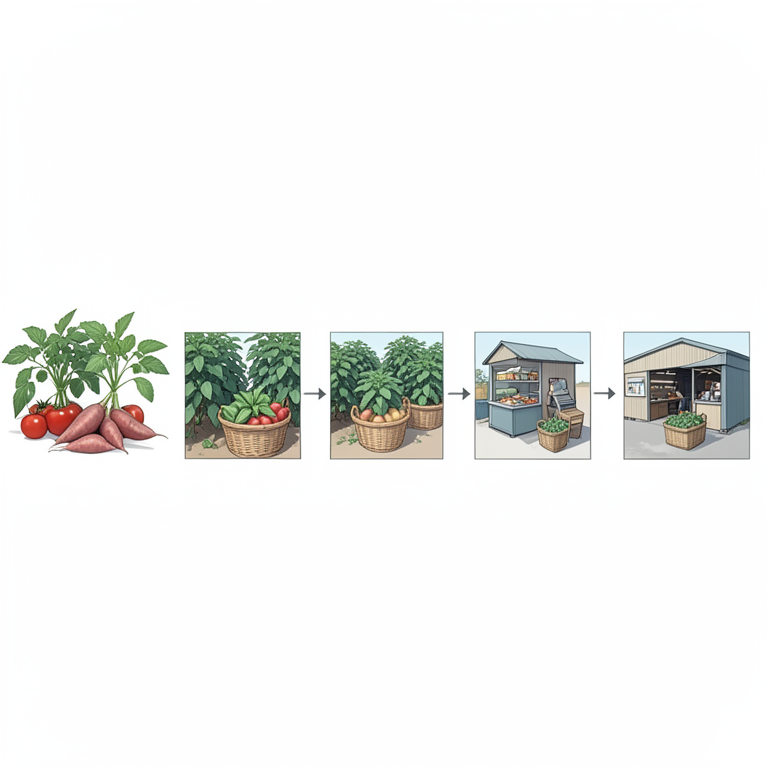
Comparison of Marketing Channels
AI-generated conceptual illustration (Tomato and sweet potato crops in a rural Gujarat farm setting). It explains the idea and does not show study data.
View source evidence ↗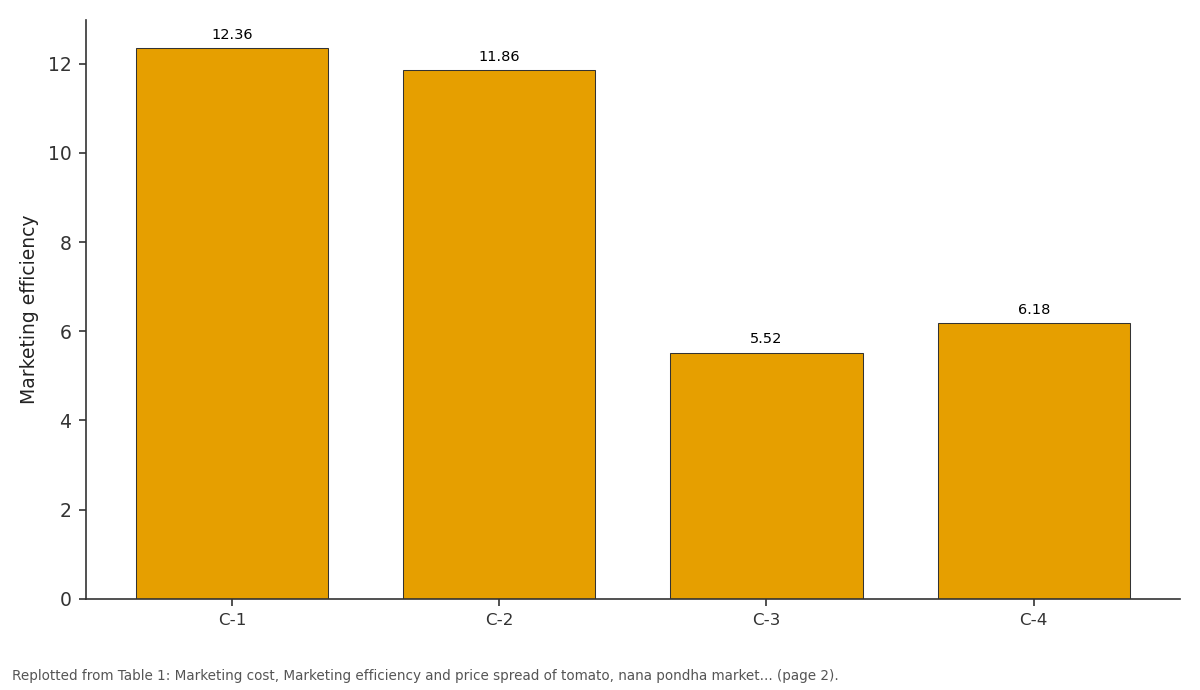
Marketing efficiency: C-1 vs C-2 vs C-3 vs C-4
Replotted from Table 1 (page 2) of the original paper. Every bar is the paper's own table value.
View source evidence ↗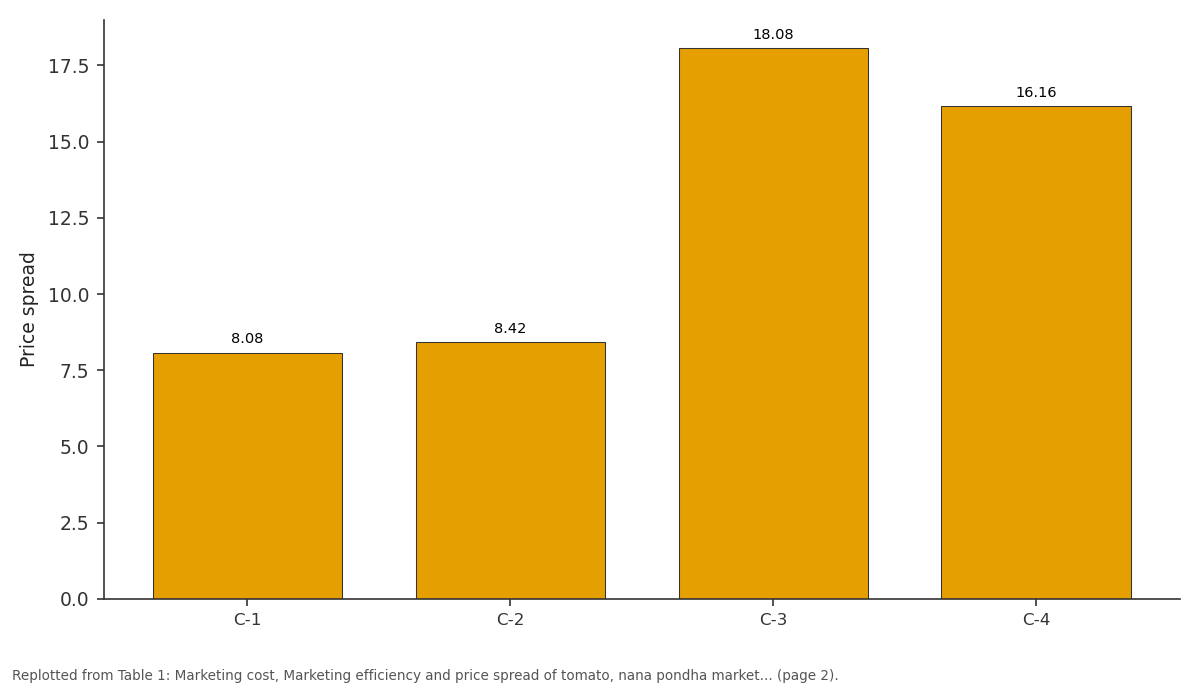
Price spread: C-1 vs C-2 vs C-3 vs C-4
Replotted from Table 1 (page 2) of the original paper. Every bar is the paper's own table value.
View source evidence ↗Figures & tables
From the original paper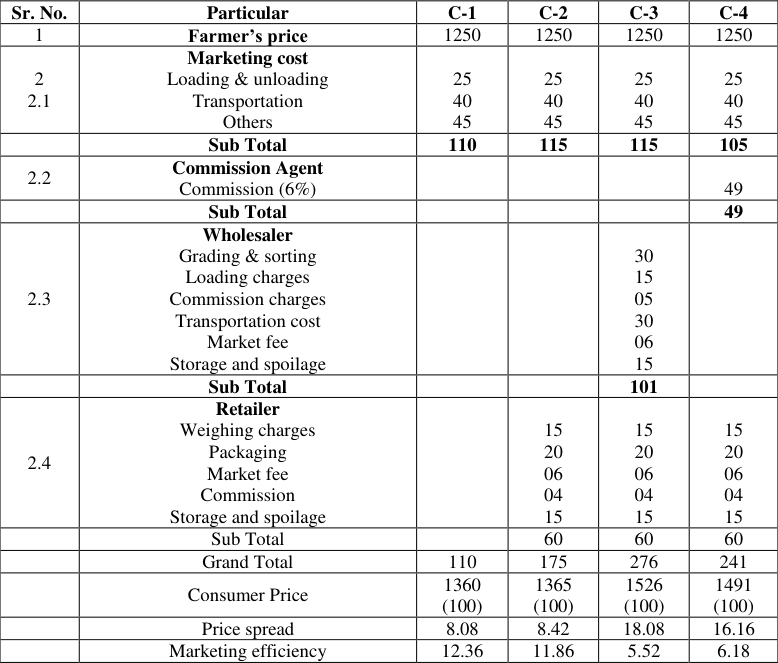 Table 1
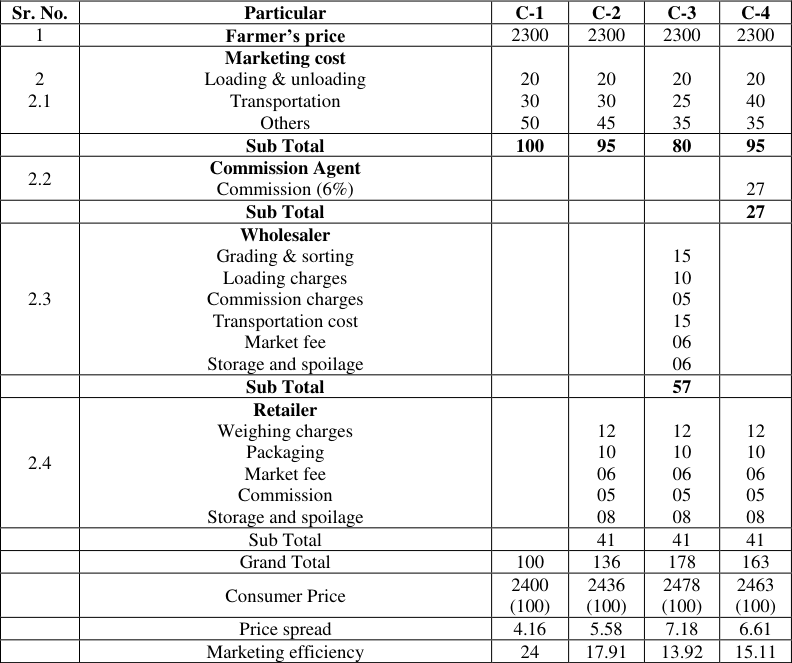 Table 2
Introduction
Horticulture has become a major driver of agricultural growth in India, and Gujarat has seen substantial expansion in area and production for several horticultural crops. Kaparada (Valsad district) is a significant horticultural producing region, especially for vegetables such as tomato and root crops like sweet potato. This paper examines the marketing channels, marketing costs, price spread, and marketing efficiency of selected horticultural crops in Kaparada. The objectives are to (1) document growth and cropping patterns, (2) identify key marketing channels, and (3) measure marketing efficiency and producer share across channels. Objectives 1. To document growth and cropping patterns in Kaparada. 2. To identify key marketing channels for target horticultural crops. 3. To analyze marketing costs, margins, price spread, and marketing efficiency. 4. To recommend policy and market interventions for improved efficiency.
Literature Review
Several recent studies have examined marketing efficiency and value chains for vegetables and other horticultural crops in India. Field-level assessments consistently show that producer share in the consumer rupee for perishable vegetables is often limited by multiple intermediaries and inadequate post-harvest infrastructure (Chand, 2020) [3] . Value-chain analyses highlight opportunities from reduced perishability, improved cold chains, and farmer organizations to capture greater value. Work specific to vegetable markets reports similar patterns of high marketing margins at wholesale and retail stages and documents methods to compute marketing efficiency (Acharya's method), used widely across Indian studies.
Methodology
The study used a mixed-methods approach. Primary data were collected via structured questionnaires from a stratified sample of farmers (tomato and sweet potato producers), wholesalers, commission agents, and retailers in the Kaparada/Nana Pondha market during the main marketing seasons. Secondary information on regional horticulture trends was gathered from government reports and published literature. Marketing channels were mapped from farmgate to consumer, and marketing cost, margin, price spread, producer's share, and marketing efficiency were calculated using standard formulas (marketing efficiency = value of output / marketing cost).
Results & Discussion
During the study only four channels were prevailing in Nana pondha market. These channels are discussed under sub heads.
1.) Channel-1 (Producer-Consumer)
In this channel commodity moved from producer to consumer directly. It was the shortest possible channel with two players in the chain. The price received by the farmers was more as compared to other channels because in this channel no intermediaries there as were involved. In this channel marketing efficiency was more due to direct transaction between producer and consumer.
2.) Channel-2 (Producer-Retailer-Consumers)
In this channel the commodity moved from producer to retailer and then it reaches to consumer. The price received by the farmers was less than the price received by the farmer in channel-1, due to the presence of intermediary. The marketing cost and margin were involved in this channel.
3.) Channel-3 (Producer-Wholesalers-retailer Consumers)
In this channel the commodity moved from producer to wholesaler and then retailer and then it reaches to consumer. The price received by the farmer is less than the price received by the farmer in channel-1 and channel-2, due to the presence of more number of intermediaries. In this channel, marketing cost and margin are high and marketing efficiency is poor.
Channel-4 (Producer-Commission Agent-Wholesaler-Retailer-Consumers)
In this channel the commodity moved from producer to commission agent and the retailer and then it reached to consumer. The price received by the farmer was less than the price received by the farmer in channel-1, channel-2, channel-3, due to presence of more intermediaries. In this channel, marketing cost and margin was very high and Marketing efficiency was very poor because of high price charged by the commission agent. The price spread was highest was observed in channel-3 with 18.08 per cent followed by channel-4 (16.16 per cent), channel-2 (8.42 per cent) and lowest in channel-1 (8.08 per cent). It means channel-3 is inefficient and most efficient channel was channel-1. Marketing efficiency has been worked out and presented in table 1. for tomato since the marketing cost and price spread in channel-3 was higher, the marketing efficiency was very low for channel-3. For channel-1 due to saving of marketing in absence of market intermediaries and relatively low consumer's price, the marketing efficiency was higher. It was highest for channel-1 with 12.36 per cent and lowest in channel-3 with 5.52 percent. Thus, channel-1 is more efficient than all other channel in case of marketing of tomato in nana pondha market. 2. for Sweet potato. Since the marketing cost and price spread in channel-3 was higher, the market efficiency was very low for channel-3. In channel-1, due to absence of market intermediaries and relatively low consumer's price, the marketing efficiency was found to be higher as compared to other channels (Table 2.). thus, channel -1 is more efficient than all other channels of marketing of sweet potato in nana pondha market.
| Sr. No. | Particular | C-1 | C-2 | C-3 | C-4 |
|---|---|---|---|---|---|
| 1 | Farmer’s price | 2300 | 2300 | 2300 | 2300 |
| 2 2.1 | Marketing cost Loading & unloading Transportation Others | 20 30 50 | 20 30 45 | 20 25 35 | 20 40 35 |
| Sub Total | 100 | 95 | 80 | 95 | |
| 2.2 | Commission Agent Commission (6%) | 27 | |||
| Sub Total | 27 | ||||
| 2.3 | Wholesaler Grading & sorting Loading charges Commission charges Transportation cost Market fee Storage and spoilage | 15 10 05 15 06 06 | |||
| Sub Total | 57 | ||||
| 2.4 | Retailer Weighing charges Packaging Market fee Commission Storage and spoilage | 12 10 06 05 08 | 12 10 06 05 08 | 12 10 06 05 08 | |
| Sub Total | 41 | 41 | 41 | ||
| Grand Total | 100 | 136 | 178 | 163 | |
| Consumer Price | 2400 (100) | 2436 (100) | 2478 (100) | 2463 (100) | |
| Price spread | 4.16 | 5.58 | 7.18 | 6.61 | |
| Marketing efficiency | 24 | 17.91 | 13.92 | 15.11 |
Table text extracted from the original PDF; superscript letters are shown inline. The original table image is below.
View original table image
| Sr. No. | Particular | C-1 | C-2 | C-3 | C-4 |
|---|---|---|---|---|---|
| 1 | Farmer’s price | 1250 | 1250 | 1250 | 1250 |
| 2 2.1 | Marketing cost Loading & unloading Transportation Others | 25 40 45 | 25 40 45 | 25 40 45 | 25 40 45 |
| Sub Total | 110 | 115 | 115 | 105 | |
| 2.2 | Commission Agent Commission (6%) | 49 | |||
| Sub Total | 49 | ||||
| 2.3 | Wholesaler Grading & sorting Loading charges Commission charges Transportation cost Market fee Storage and spoilage | 30 15 05 30 06 15 | |||
| Sub Total | 101 | ||||
| 2.4 | Retailer Weighing charges Packaging Market fee Commission Storage and spoilage | 15 20 06 04 15 | 15 20 06 04 15 | 15 20 06 04 15 | |
| Sub Total | 60 | 60 | 60 | ||
| Grand Total | 110 | 175 | 276 | 241 | |
| Consumer Price | 1360 (100) | 1365 (100) | 1526 (100) | 1491 (100) | |
| Price spread | 8.08 | 8.42 | 18.08 | 16.16 | |
| Marketing efficiency | 12.36 | 11.86 | 5.52 | 6.18 |
Table text extracted from the original PDF; superscript letters are shown inline. The original table image is below.
View original table image
Conclusion & Policy Implications
The study concludes that strengthening direct market linkages, promoting collective marketing, and investing in post-harvest and market infrastructure are critical for improving marketing efficiency in Kaparada. Policy and local-level actions that reduce unnecessary intermediaries and enable farmers to access market information and aggregation services will increase producer income and contribute to inclusive horticulture growth in Valsad.
Key policy recommendations 1. Support formation and capacity building of FPOs and farmer cooperatives in Kaparada. 2. Invest in local aggregation centres and low-cost cold chain solutions to reduce perishability losses. 3. Promote digital market information and price discovery tools for smallholders. 4. Encourage direct marketing platforms (farmers' markets, contract arrangements) to shorten the price spread.
References
5 in the original paper- Hassan B, Bhattacharjee M, Wani S. Value-chain analysis of horticultural crops: regional analysis in Indian horticultural scenario. Int J Agric Econ Ext Sci. 2021;31(8):1164-82.
- Chand K. Marketing of vegetables in developing economies: channels, margins, and efficiency. Int J Agric Sci. 2020;19(1):38-45.
- Recent market integration study on tomato markets demonstrating price integration and cointegration across markets in India. 2024. International Journal of Agriculture and Food Science https://www.agriculturaljournals.com
- Times of India. Mango accounts for 37% of horticulture area in Gujarat; Valsad highlighted for horticulture area. 2024.
- VAMNICOM. Expansion of horticulture value chain in India -regional report. 2022.