
Research article · 2025 · Full text
International Journal of Agriculture and Food ScienceSurvey and standardization of recipe for making Mohanthal based on market survey
Volume 7(9) · Pages 680–685 · DOI: 10.33545/2664844x.2025.v7.i9i.813 ↗
Research areasAgricultural Economics and PracticesFood Science and Nutritional Studies
Abstract
Author-writtenThis study focuses on the standardization of Mohanthal, a traditional Indian sweet popular in Gujarat and Rajasthan, through a systematic market survey and sensory-textural evaluation. A comprehensive survey was conducted across seven prominent sweet shops in Anand, Gujarat, to document traditional preparation practices including ingredient usage, roasting parameters, and syrup consistency. Samples collected from each shop (MM1-MM7) were evaluated for sensory quality using a nine-point hedonic scale and for texture profile using a Texture Analyzer (TA-XT Plus). The sensory panel assessed attributes such as color, appearance, flavour, texture, and overall acceptability. Among the samples, MM3 scored highest in overall acceptability and exhibited desirable textural qualities, such as lower hardness and chewiness, suggesting a soft, cohesive, and consumer-preferred structure. Texture Profile Analysis (TPA) revealed significant variations among the samples in parameters like hardness, cohesiveness, springiness, gumminess, and chewiness, which were closely tied to ingredient ratios and process conditions. The findings underscore the need to standardize processing variables to ensure consistent product quality. The study provides valuable insights for artisanal and commercial producers aiming to enhance Mohanthal's sensory and mechanical attributes while preserving its traditional identity.
Summary
Source-checkedPlain-language reading of the full paper, prepared with AI and checked against the text. Each point links to the authors' own words.
Why it matters
- Mohanthal is a traditional Indian sweet that is particularly popular in the regions of Rajasthan and Gujarat. View evidence ↗
- There is significant variation in Mohanthal quality between different shops, and products from local confectioners (Halwais) typically have a short shelf life of one to two weeks. View evidence ↗
The question
- The study aims to standardize the recipe and preparation process of Mohanthal using market surveys and evaluations of sensory and textural properties. View evidence ↗
What they did
- Researchers surveyed seven prominent sweet shops in Anand, Gujarat, to document ingredients, roasting parameters, and syrup consistency. View evidence ↗
- A semi-trained faculty panel used a 9-point hedonic scale to evaluate the sensory attributes of the samples. View evidence ↗
- Texture Profile Analysis (TPA) was performed using a TA-XT plus Texture Analyzer to measure mechanical properties. View evidence ↗
- Samples were shaped into 20 x 20 x 20 mm cubes, tempered at 30°C for one hour, and subjected to two 50% compressions. View evidence ↗
What they found
- Sample MM3 was the most preferred by the sensory panel, achieving the highest overall acceptability score of 8.30 ± 0.48. View evidence ↗
- Texture analysis showed that MM2 was the firmest sample (20.80 ± 0.24 N), while MM3 was the softest (17.87 ± 0.29 N). View evidence ↗
- MM3 exhibited the lowest gumminess (9.46 ± 0.17 N), whereas MM2 exhibited the highest (12.51 ± 0.18 N). View evidence ↗
- Chewiness was lowest in MM3 (5.83 ± 0.18 N) and highest in MM2 (8.18 ± 0.23 N), indicating that MM3 is easier to chew. View evidence ↗
What it means
- The authors conclude that MM3 is the optimal formulation because its lower hardness and chewiness result in a soft, cohesive body preferred by consumers. View evidence ↗
- The authors recommend standardizing the recipe based on these preferred traits to improve the market competitiveness and shelf stability of Mohanthal. View evidence ↗
Visual summary
2 visualsIllustrations explain the paper; charts are replotted from the paper's own table values.
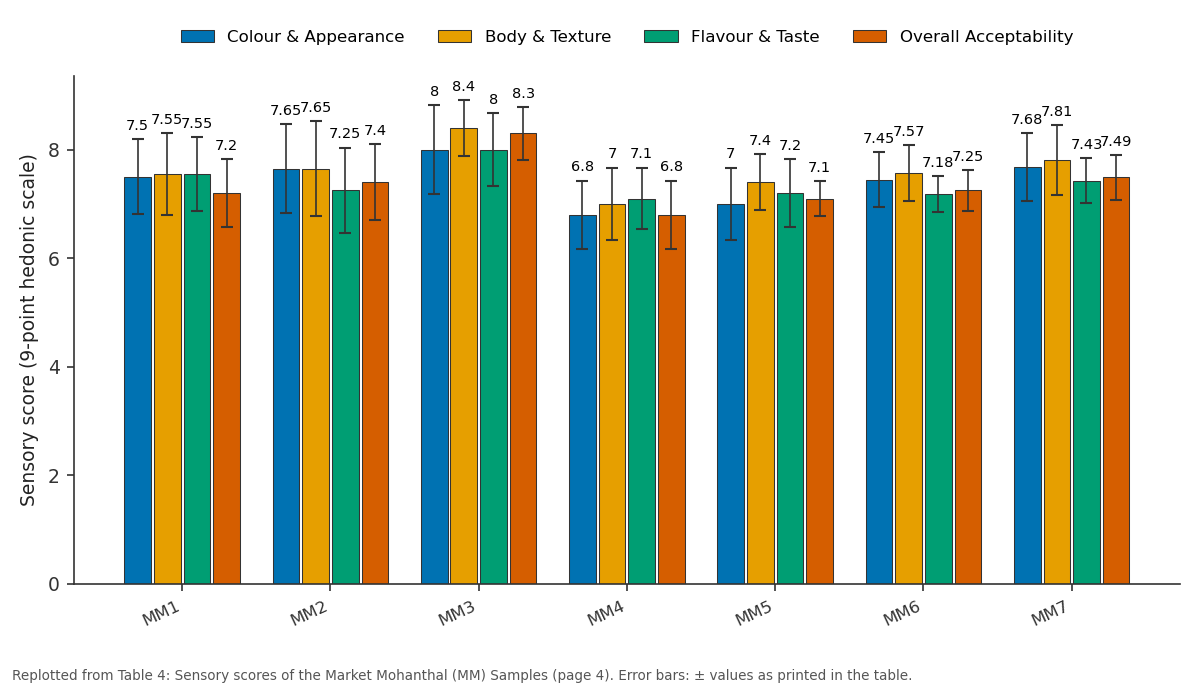
Colour & Appearance and Body & Texture and more: MM1 vs MM2 vs MM3 vs MM4 vs MM5
Replotted from Table 4 (page 4) of the original paper. Every bar is the paper's own table value.
View source evidence ↗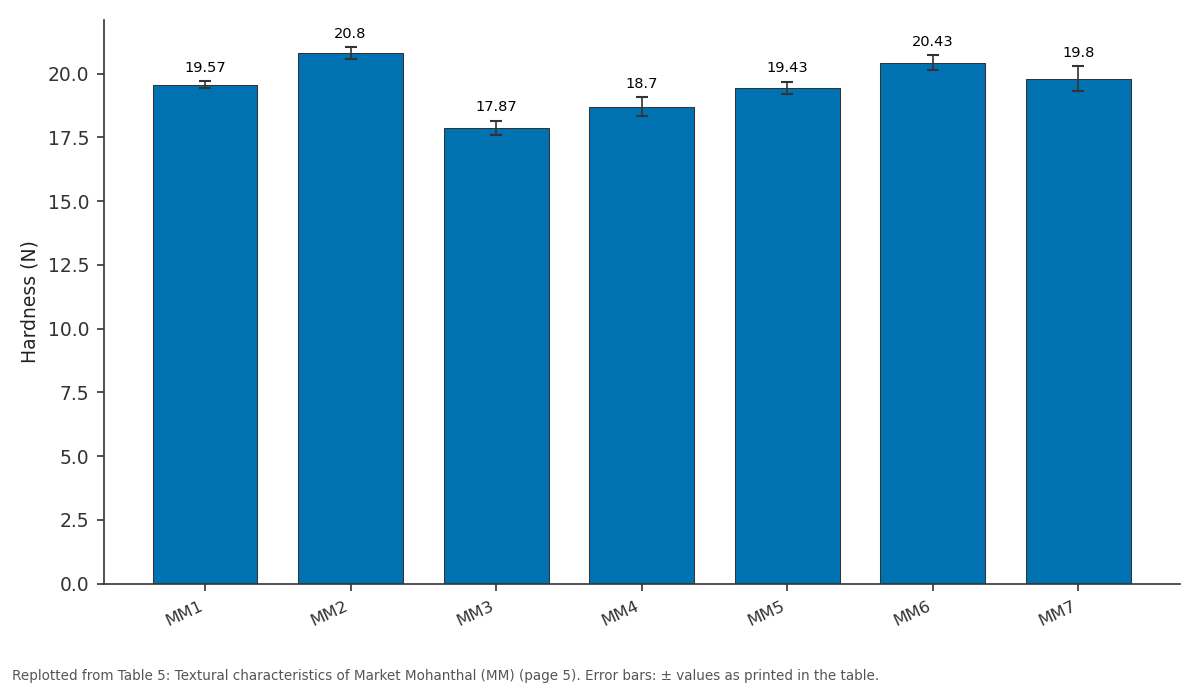
Hardness (N): MM1 vs MM2 vs MM3 vs MM4 vs MM5
Replotted from Table 5 (page 5) of the original paper. Every bar is the paper's own table value.
View source evidence ↗Figures & tables
From the original paper Table 1
 Table 2
 Table 3
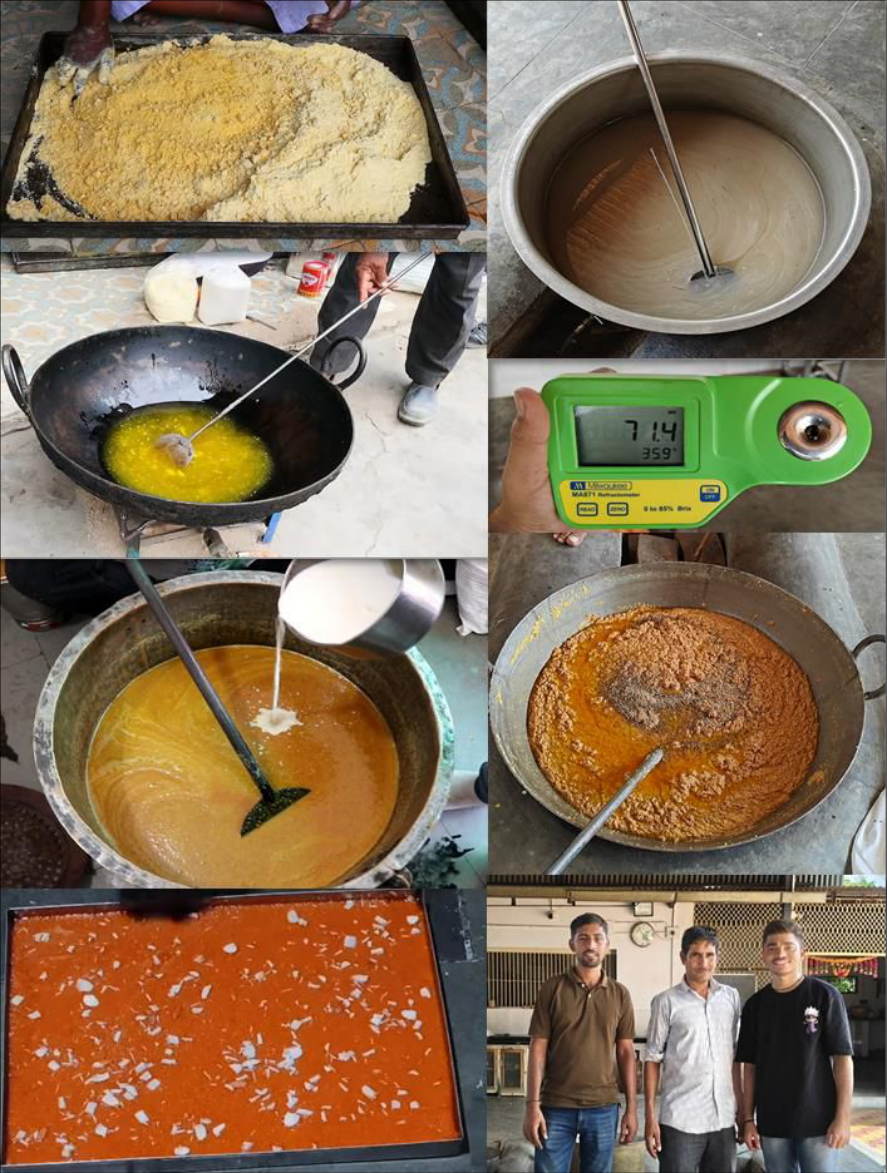 Figure 1
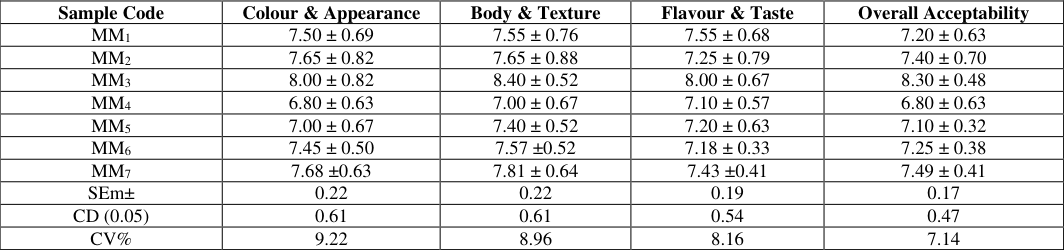 Table 4
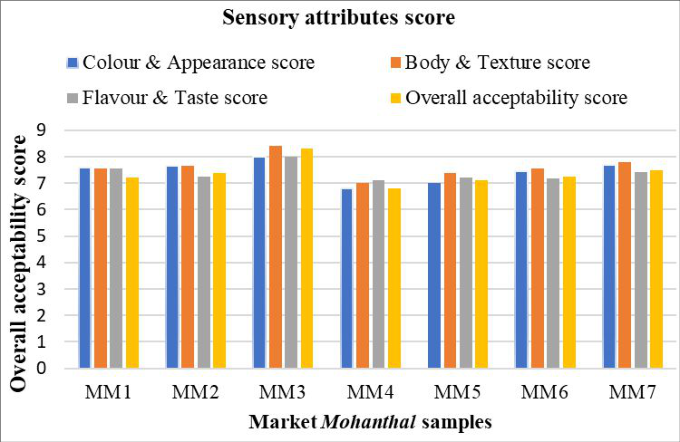 Figure 2
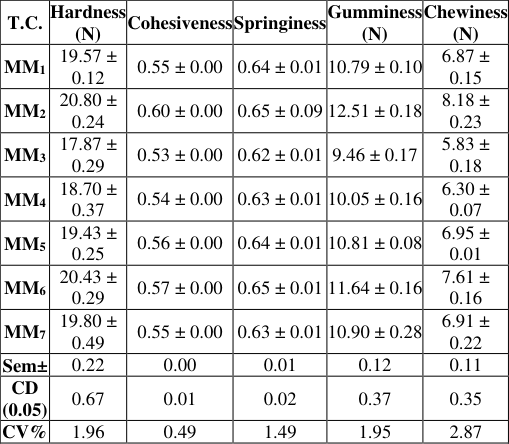 Table 5
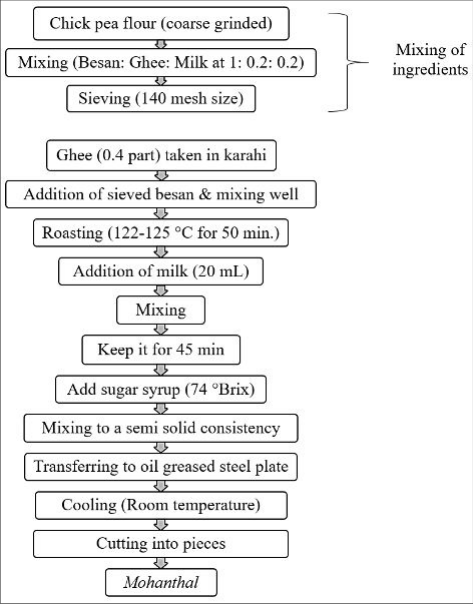 Figure 3
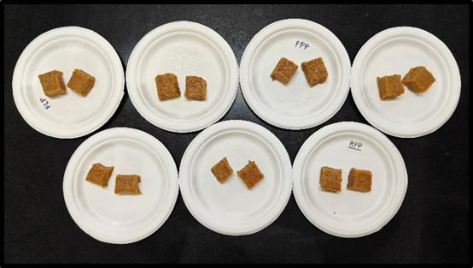 Figure 4
Introduction
Food is an integral part of human life. Many of the food items in a diet are included for health purpose and some due to good taste. In India, sweets possess an essential role in diet mostly due to good taste and considered not only for sharing happy moments but also used as traditional offerings to various deities in the country. They are an important part of different festivals and socio-cultural ceremonies. Some sweets are specifically prepared on a particular festival for example, Gujiya on Holi, Sattu on Shravani Teej, Rabdi and Malpua on Hariyali Amavasya etc. A wide variability among sweets depicts rich cultural heritage and food diversity spread among several districts in various states of India. Recipe of every sweet is different from, each other either through difference in ingredients or method of preparation. These variations are inculcated traditionally among local people (Jain, 2020) [6] . Traditional sweets are essentially made with three or four essential ingredients: oil, milk, cereal flours, wheat, and legumes, especially Bengal gram (Cicer arietinum). With the help of the aforementioned components, sweetmeat producers can offer a wide range of sweetmeats on the market thanks to their inherited talent and experience and their ability to make little, impactful adjustments to the processing environment. For instance, although the ingredients of goods like Laddu, Sohn papri, Mysore pak, Mohanthal, and Besan burfi all made with Bengal gram flour, or besan are similar, but their textures are very different. A number of these traditional dairy products unique to each region have been described, surveyed, and recorded. Mohanthal is a traditional sweet product popular in Gujarat and some parts of Rajasthan. Mohan refers to 'Lord Krishna' and Thal refers to 'thali or plate'. Mohanthal is The history of Mohanthal origin is obscure and only a few scattered literatures are available related to Mohanthal. Traditionally Mohanthal is prepared at house hold levels and also by Halwai's. It is observed on the basis of preliminary observations that the product Mohanthal is famous for its rich pleasant roasted flavour along with the rich ghee aroma. It is marketed in the form of small rectangular shaped pieces. The product showed wide variation from shop to shop. Mohanthal produced and marketed by local Halwai's has a limited shelf life of 1-2 weeks.
Materials and Methods
Materials and Methods
Materials
Bengal gram flour (Coarse grinded) and sugar was sourced from the local market in Anand, Gujarat, India. Amul pure ghee (special grade) was used as the fat component.
Market Survey for Mohanthal Making Process
Mohanthal is prepared in many households in Gujarat. It is also being sold in various sweet shop outlets in towns and cities. Based on survey work, and through various sources and media, well known manufacturers of Mohanthal were identified for the study. Visit local Mohanthal manufacturer located at Anand city and nearby, observe their production processes and collection of data as per prepared questionnaire. the following parameters will be considered during the survey. 1. Ingredients added in making Mohanthal 2. Roasting time 3. Roasting temperature 4. °Brix of syrup
Sensory evaluation
Sensory evaluation of the procured Mohanthal samples was carried out by semi-trained faculty of College of Food Processing Technology and Bio-Energy using 9-point hedonic scale and descriptive sensory evaluation technique. The judges were asked to evaluate and describe various product attributes viz. colour and appearance, flavour, body and texture, sweetness and overall acceptability.
Texture profile
Texture profile analysis of the samples of Mohanthal was carried out using Texture Analyzer, TA-XT plus Stable Micro System, England (Bourne, 1978) [2] . The instrumental test protocols maintained were: Option: return to start; Test mode: compression; Pre-test speed: 1 mm/s; Test speed: 5 mm/s; Post-test speed: 5 mm/s; Target mode: Distance; Distance: 10 mm; Time: 5 sec; Trigger type: Auto (Force); Trigger force: 5 g; Break Mode: Off; Advanced option: ON; Probe: P/75 plunger probe Mohanthal sample, gently patted into cubes of 20 x 20 x 20 mm and tempered at 30oC for about an hour, was kept positioned centrally over the platform of Texture Analyser and the computer was allowed to execute the program to run the test, then the sample was compressed (50% compression) by the plunger twice (resembling two bites) and the force exerted back by the sample onto the plunger was sensed by the machine generating a two peak forcetime curve. Different textural parameters like hardness (Newtons), cohesiveness (no units), springiness (no units), gumminess (Newtons), and chewiness (Newtons) were computed from the force-time graph as described.
Results and Discussion
Results and Discussion
Market survey for Mohanthal making process
The comprehensive market survey conducted across seven Mohanthal manufacturing shops in and around Anand city, Gujarat, provided detailed insights into the traditional and contemporary methods employed for Mohanthal making by these manufacturers. The details of surveyed shops, including Keval Rasoiya Service (Bhavarlal), Mahalakshmi sweet & Farshan Mart, Gopal Sweet & Farshan Mart, Kamal Sweet and Namkeen, Shreeji Sweets and Farshan, Milan Sweets, Gokul Farshan & Sweets, were selected to ensure a diverse representation of Mohanthal making practices. A wide array of parameters related to the Mohanthal making process includes types of flour used, flour to ghee to milk ratios, roasting time and temperature combinations, and Brix levels of the sugar syrup were captured. The market Mohanthal samples from the different shops were coded as MM 1 , MM 2 , MM 3 , MM 4 , MM 5 , MM 6 , and MM 7 during the survey. The various parameters surveyed on the basis of prepared questionnaire was mentioned in the below tables (Table 3.1, Table 3.2, Table 3.3).
Standardization of Mohanthal Making Process
The study examined the prevailing production practices of Mohanthal at the market level through structured observations and interviews with manufacturers using a prevalidated questionnaire. Based on the collected data, seven experimental samples (MM 1 to MM 7 ) were formulated in the Food Processing Technology (FPT) laboratory using key parameters identified from the survey (refer to Tables 3.1 and 3.2). These samples were prepared for comparative sensory evaluation and Texture Profile Analysis (TPA) with the objective of standardizing the formulation and preparation process of Mohanthal. The formulation with the highest overall acceptability score was identified as the optimized recipe. The standardization was based on triplicate sensory evaluations performed by a semi-trained panel using a nine-point hedonic scale. The panellists evaluated key attributes colour and appearance, body and texture, flavour and taste, and overall acceptability expressing preferences on a scale from "dislike extremely" to "like extremely". The results of the sensory evaluation are presented in Table 3.4, providing a clear basis for identifying the most acceptable formulation among the surveyed variants. The sensory evaluation of Market Mohanthal (MM) samples (MM 1 -MM 7 ) revealed notable variations across all sensory attributes, including colour and appearance, body and texture, flavour and taste, and overall acceptability score. Among the all samples, MM 3 achieved the highest sensory scores across all parameters, with an overall acceptability of 8.30 ± 0.48, indicating superior sensory quality. MM 7 also performed well, particularly in body and texture (7.81 ± 0.64) and overall acceptability (7.49 ± 0.41), suggesting favourable consumer appeal. In contrast, MM 4 received the lowest scores, particularly for colour and appearance (6.8 ± 0.63) and overall acceptability (6.8 ± 0.63), reflecting comparatively lower sensory performance. The other samples (MM 1 , MM 2 , MM 5 , MM 6 ) showed moderate acceptability, with scores ranging from 7.10 to 7.40 for overall acceptability. These findings suggest that while most samples met acceptable sensory standards, MM 3 stood out as the most preferred sample, likely due to its balanced and appealing sensory characteristics. and7.49 ± 0.41, respectively. Notably, MM 7 showed balanced scores across all parameters and was closer in preference to MM 3 . MM 1 and MM 5 had lower mean scores compared to MM 2 , MM 6 , and MM 7 , indicating average sensory performance. This variation in sensory perception may be attributed to differences in ingredient composition, processing techniques, or storage conditions among the market samples. Statistical analysis revealed significant differences among the samples, with the critical difference (CD) at 5% level being 0.6138, 0.6095, 0.5384, and 0.4696 for colour & appearance, body & texture, flavour & taste, and overall acceptability, respectively. The coefficient of variation (CV%) ranged from 7.13% to 9.21%, indicating acceptable consistency in sensory data. The standard error of mean (SEm ±) values was relatively low, ensuring reliability of the scores. Overall, MM 3 emerged as the most acceptable sample, suggesting a favourable formulation and preparation method, which could serve as a benchmark for quality improvement in other market variants of Mohanthal. So, based on the sensory evaluation data, MM 3 is considered the best sample due to its highest scores in body and texture, flavour and taste, and overall acceptability attributes. MM 7 is also representing a good score, particularly for colour and appearance attributes. However, the comprehensive performance of MM 3 across all evaluated sensory attributes like body and texture, flavour and taste and overall acceptability score as compare to MM 7 (Fig. 3.2) hence it suggests that the sample MM 3 observed the best quality Mohanthal among all other samples. From survey it was found that the process flowchart adopted by shop no. 3 (sample MM 3 ) for manufacturing of Mohanthal is depicted in Fig. 3.3.
Textural characteristics of Mohanthal
The Texture Profile Analysis (TPA) of Market Mohanthal (MM) samples (MM 1 to MM 7 ) revealed significant variation across all five key textural parameters: hardness, cohesiveness, springiness, gumminess, and chewiness. These differences reflect variations in formulations and processing techniques among different sources. Hardness values ranged from 17.87 ± 0.29 N (MM 3 ) to 20.80 ± 0.24 N (MM 2 ), with MM 2 being the firmest, likely due to reduced moisture or higher binding agent content. In contrast, the softer texture of MM 3 may be attributed to higher fat content, which generally reduces structural stiffness (Bourne, 2002) [3] . Cohesiveness varied between 0.53 ± 0.00 in MM 3 and 0.602 ± 0.00 in MM 2 , suggesting stronger internal bonding and better ingredient integration in MM 2 .
Higher cohesiveness is linked to improved structural uniformity and resistance to disintegration (Larmond, 1976; Szczesniak, 2002) [7,9] . Springiness ranged from 0.62 ± 0.01 in MM 3 to 0.65 ± 0.01 in MM 2 and MM6, indicating good elastic recovery in these samples. This property is typically influenced by the interactions among protein, moisture, and fibre content (Salvador & Fiszman, 2004) [8] . Gumminess, calculated as hardness × cohesiveness, was lowest in MM 3 (9.46 ± 0.17 N) and highest in MM 2 (12.51 ± 0.18 N), suggesting MM 2 had a denser texture that required more energy for disintegration. Chewiness, derived from gumminess × springiness, followed a similar trend, ranging from 5.83 ± 0.18 N (MM 3 ) to 8.18 ± 0.23 N (MM 2 ). This implies that MM 2 was firmer and required more mastication effort, while MM3 offered easier chewability potentially more suitable for sensitive consumers like children or the elderly (Borwankar, 1992; Chen & Rosenthal, 2015) [1,5] . Overall, MM 2 demonstrated the highest mechanical integrity across all parameters, whereas MM 3 presented a softer, more consumer-friendly texture.
Conclusion
The present study offers a comprehensive assessment of traditional Mohanthal preparation practices through a systematic market survey and empirical analysis of sensory and textural properties. The findings highlight substantial variations among manufacturers in terms of ingredient selection, roasting parameters, and processing techniques, all of which significantly influence the final product's quality. Among the evaluated samples, MM 3 emerged as the most preferred in sensory acceptability, attributed to its favorable textural attributes such as lower hardness, chewiness, and a soft yet cohesive body. Texture Profile Analysis (TPA) further confirmed the distinct mechanical behaviours across samples, reinforcing the need for standardized production protocols. The data-driven approach adopted in this study not only enabled identification of the most desirable formulation characteristics but also laid a foundation for consistent quality improvement in both artisanal and commercial Mohanthal production. Standardization of the recipe based on consumer-preferred sensory and textural traits can significantly enhance product appeal, shelf stability, and market competitiveness. Future work may include exploring
Acknowledgement
AcknowledgementThe authors acknowledge the Department of Food Processing Technology, Anand Agricultural University, Anand for providing the all facilities required for the experiment and the Mohanthal manufacturer for providing the information needed.
Figures and tables from the paper
| Samples Parameters | MM 1 | MM 2 | MM 3 | MM 4 | MM 5 | MM 6 | MM 7 |
|---|---|---|---|---|---|---|---|
| Ratio (Besan: Ghee: Milk) | 1:1:0.5 | 1:0.9:0.5 | 1:0.6:0.2 | 1:0.8:0.5 | 1:1:0.4 | 1:0.9:0.5 | 1:0.8:0.4 |
| Mixing Ratio (Besan: Ghee: Milk) | 1:0.2:0.2 | 1:0.2:0.2 | 1:0.2:0.2 | 1:0.2:0.2 | 1:0.25:0.25 | 1:0.25:0.2 | 1:0.3:0.2 |
| Roasting temperature (°C) | 125-130 | 130-132 | 122-125 | 131-135 | 125-128 | 122-127 | 135-138 |
| Roasting time (min.) | 40 | 42 | 50 | 39 | 41 | 45 | 48 |
| Holding time (min.) | 30 | 30 | 45 | 20 | 30 | 30 | 30 |
Table text extracted from the original PDF; superscript letters are shown inline. The original table image is below.
View original table image
| Samples Parameters | MM 1 | MM 2 | MM 3 | MM 4 | MM 5 | MM 6 | MM 7 |
|---|---|---|---|---|---|---|---|
| Ratio (Sugar: Water) | 4:1 | 3:1 | 2.25:1 | 2.5:1 | 2:1 | 3:1 | 2:1 |
| Cooing temperature for syrup (°C) | 110-113 | 115-117 | 108-110 | 101-110 | 113-119 | 105-110 | 115-123 |
| °Brix of sugar syrup (°Bx) | 75 | 79 | 74 | 74.8 | 78.3 | 75 | 74 |
Table text extracted from the original PDF; superscript letters are shown inline. The original table image is below.
View original table image
| Sample Code | Colour & Appearance | Body & Texture | Flavour & Taste | Overall Acceptability |
|---|---|---|---|---|
| MM1 | 7.50 ± 0.69 | 7.55 ± 0.76 | 7.55 ± 0.68 | 7.20 ± 0.63 |
| MM2 | 7.65 ± 0.82 | 7.65 ± 0.88 | 7.25 ± 0.79 | 7.40 ± 0.70 |
| MM3 | 8.00 ± 0.82 | 8.40 ± 0.52 | 8.00 ± 0.67 | 8.30 ± 0.48 |
| MM4 | 6.80 ± 0.63 | 7.00 ± 0.67 | 7.10 ± 0.57 | 6.80 ± 0.63 |
| MM5 | 7.00 ± 0.67 | 7.40 ± 0.52 | 7.20 ± 0.63 | 7.10 ± 0.32 |
| MM6 | 7.45 ± 0.50 | 7.57 ±0.52 | 7.18 ± 0.33 | 7.25 ± 0.38 |
| MM7 | 7.68 ±0.63 | 7.81 ± 0.64 | 7.43 ±0.41 | 7.49 ± 0.41 |
| SEm± | 0.22 | 0.22 | 0.19 | 0.17 |
| CD (0.05) | 0.61 | 0.61 | 0.54 | 0.47 |
| CV% | 9.22 | 8.96 | 8.16 | 7.14 |
Table text extracted from the original PDF; superscript letters are shown inline. The original table image is below.
View original table image
| T.C. | Hardness (N) | Cohesiveness | Springiness | Gumminess (N) | Chewiness (N) |
|---|---|---|---|---|---|
| MM1 | 19.57 ± 0.12 | 0.55 ± 0.00 | 0.64 ± 0.01 | 10.79 ± 0.10 | 6.87 ± 0.15 |
| MM2 | 20.80 ± 0.24 | 0.60 ± 0.00 | 0.65 ± 0.09 | 12.51 ± 0.18 | 8.18 ± 0.23 |
| MM3 | 17.87 ± 0.29 | 0.53 ± 0.00 | 0.62 ± 0.01 | 9.46 ± 0.17 | 5.83 ± 0.18 |
| MM4 | 18.70 ± 0.37 | 0.54 ± 0.00 | 0.63 ± 0.01 | 10.05 ± 0.16 | 6.30 ± 0.07 |
| MM5 | 19.43 ± 0.25 | 0.56 ± 0.00 | 0.64 ± 0.01 | 10.81 ± 0.08 | 6.95 ± 0.01 |
| MM6 | 20.43 ± 0.29 | 0.57 ± 0.00 | 0.65 ± 0.01 | 11.64 ± 0.16 | 7.61 ± 0.16 |
| MM7 | 19.80 ± 0.49 | 0.55 ± 0.00 | 0.63 ± 0.01 | 10.90 ± 0.28 | 6.91 ± 0.22 |
| Sem± | 0.22 | 0.00 | 0.01 | 0.12 | 0.11 |
| CD (0.05) | 0.67 | 0.01 | 0.02 | 0.37 | 0.35 |
| CV% | 1.96 | 0.49 | 1.49 | 1.95 | 2.87 |
Table text extracted from the original PDF; superscript letters are shown inline. The original table image is below.
View original table image
References
9 in the original paper- Borwankar RP. Food texture and rheology: A tutorial review. In: Kristensen HG, Franssen JC, editors. Rheology of foods. Springer; 1992. p. 1-16.
- Bourne MC. Texture profile analysis. Food Technol. 1978;32:62-6.
- Bourne MC. Food texture and viscosity: Concept and measurement. Academic Press; 2002.
- Chaudhary MB, Rao KJ, Sutariya H. Characterization of Mohanthal -A traditional sweet from Gujarat, India. Indian J Dairy Sci. 2020;73(3):267-271.
- Chen J, Rosenthal A, editors. Modifying food texture: Novel ingredients and processing techniques. Woodhead Publishing; 2015.
- Jain V. Sweets as traditional medicine in winter season: An ethnobotanical study in Udaipur city, India. Ethnobot Res Appl. 2020;20:1-17.
- Larmond E. Laboratory methods for sensory evaluation of food [Publication No. 1637]. Canada Department of Agriculture; 1976.
- Salvador A, Fiszman SM. Textural and sensory characteristics of whole and skimmed flavored set-type yogurt during long storage. J Dairy Sci. 2004;87(12):4033-4041.
- Szczesniak AS. Texture is a sensory property. Food Qual Prefer. 2002;13(4):215-225.