
Research article · 2025 · Full text
International Journal of Geography Geology and EnvironmentA decadal comparative study of India’s progress on the sustainable development goals, (2015-2025)
Volume 7(9) · Pages 59–64 · DOI: 10.22271/27067483.2025.v7.i9a.409 ↗
Research areasIndian Economic and Social DevelopmentIncome, Poverty, and InequalityAgricultural risk and resilience
Abstract
Author-writtenThis paper assesses and compares India's advancement in attaining the Sustainable Development Goals (SDGs) between 2015 and 2025, which marks the 10th anniversary of SDGs. The research paper employs secondary data from the Sustainable Development Report 2025 to examine the achievements, challenges, and regional variations in all the 17 Sustainable Development Goals (SDGs). The findings illustrate significant achievements such as decreasing poverty, achieving universal access to education and electricity, improving child and maternal health, and increasing financial inclusion. However, there are challenges in environmental preservation, gender equality, urban sustainability, and hunger eradication. Bihar, Jharkhand, and Uttar Pradesh are still trailing behind, while Kerala, Himachal Pradesh, and Tamil Nadu are currently leading. According to the study's findings, India needs to implement more robust state-specific regulatory frameworks for environmental protections, and inclusive growth plans in order to achieve the 2030 targets.
Summary
Source-checkedPlain-language reading of the full paper, prepared with AI and checked against the text. Each point links to the authors' own words.
Why it matters
- The UN's 2030 Agenda, established in 2015, consists of 17 Sustainable Development Goals (SDGs) and 169 targets aimed at global poverty reduction, environmental protection, and general prosperity. View evidence ↗
- India's large size and diversity present both significant socioeconomic and environmental disparities and opportunities to combine sustainable development with inclusive growth. View evidence ↗
The question
- The study aims to analytically compare India's progress toward the SDGs from 2015 to 2025, focusing on achievements, challenges, and variations between different states. View evidence ↗
What they did
- The research uses a descriptive and analytical design based entirely on secondary data, primarily from the Sustainable Development Report 2025. View evidence ↗
- To supplement national data, the authors used NITI Aayog SDG India Index Reports (2018-2023), the National Family Health Survey (NFHS-5), and various government ministry reports. View evidence ↗
What they found
- Extreme poverty in India dropped significantly from nearly 12% in 2015 (at the $2.15 per day line) to 1.1% nationally by 2025. View evidence ↗
- By 2025, health indicators improved, with the maternal mortality rate dropping to 80.5, under-five mortality reaching 27.7, and life expectancy increasing to 72 years. View evidence ↗
- Education access reached high levels by 2025, with a net primary enrolment of 99.9%, youth literacy at 97%, and secondary completion at 85.5%. View evidence ↗
- Gender equality shows mixed results by 2025: the female-to-male labor force participation ratio is 42.6% and family planning coverage is 77.5%, but women hold only 13.8% of parliamentary seats. View evidence ↗
- Water and sanitation access improved by 2025, with 93.3% having basic drinking water and 78.4% having sanitation services, although wastewater treatment is only 19.2%. View evidence ↗
- Energy access expanded by 2025, with 99.2% of households having electricity and 74.5% having access to clean cooking fuels. View evidence ↗
- Infrastructure improved by 2025 with 99% of rural households having all-weather roads and 55.9% internet penetration, but R&D spending is low at 0.6% of GDP. View evidence ↗
- Income inequality decreased by 2025, as indicated by a Gini index of 32.8 and a Palma ratio of 1.3. View evidence ↗
- Urban sustainability remains a challenge in 2025, with 41.4% of the urban population living in slums and PM2.5 air pollution levels at 47.3 µg/m³. View evidence ↗
- Marine protection is limited as of 2025, with only 4.2% of key marine sites protected and a low Ocean Health Index score of 32.3. View evidence ↗
- Land biodiversity protection by 2025 includes 6.3% of terrestrial and 8.3% of freshwater areas, while permanent deforestation has dropped to 0%. View evidence ↗
- Institutional challenges persist in 2025, with 75.8% of prisoners being undertrials and a Corruption Perception Index score of 38/100. View evidence ↗
What it means
- The authors conclude that India's development is uneven, with Kerala, Himachal Pradesh, and Tamil Nadu leading, while Bihar, Jharkhand, and Uttar Pradesh lag behind. View evidence ↗
- To meet 2030 targets, the authors recommend multifaceted strategies, starting with increased efforts to address hunger and nutrition. View evidence ↗
Visual summary
1 visualsIllustrations explain the paper; they do not show study data.
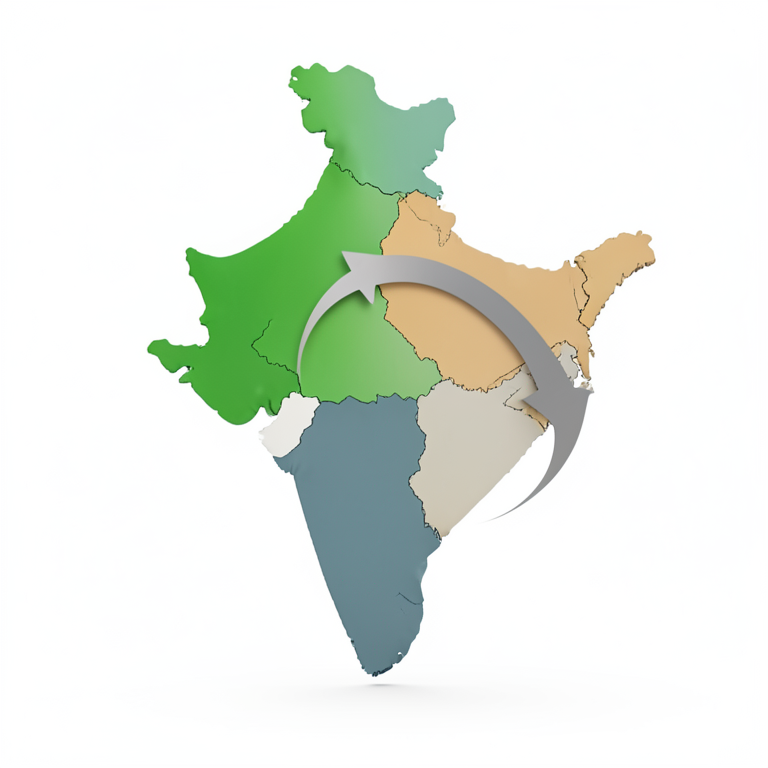
Regional Disparity in SDG Progress
AI-generated conceptual illustration (A map of India). It explains the idea and does not show study data.
View source evidence ↗Figures & tables
From the original paper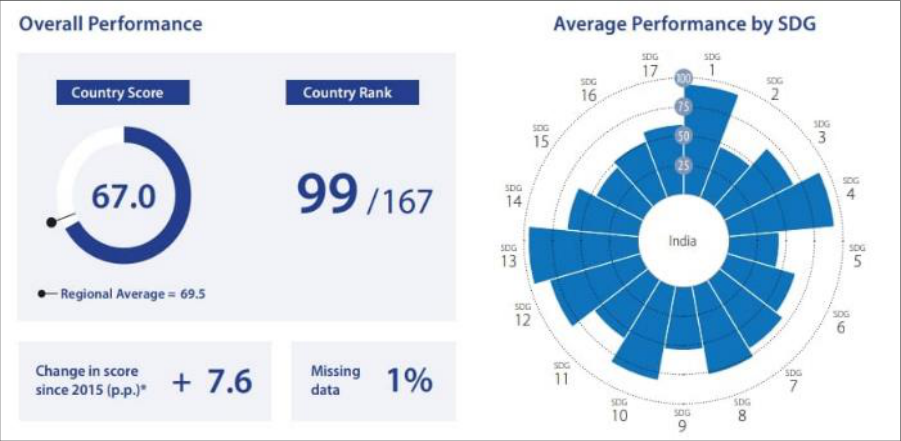 Figure 1
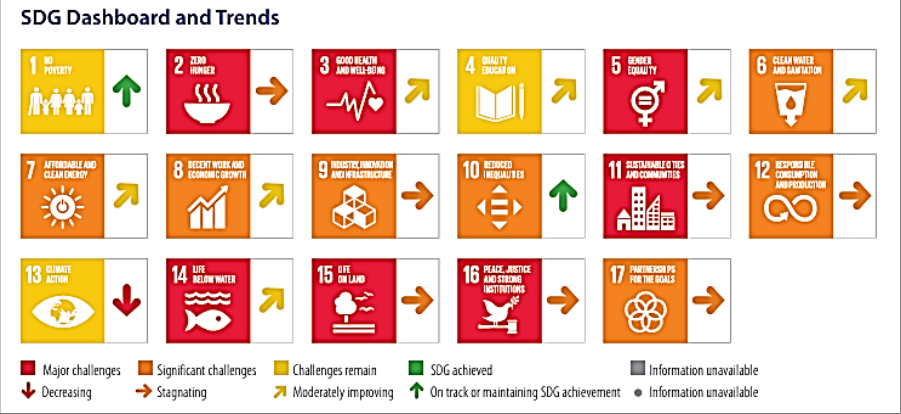 Figure 2
Introduction
The UNDP (United Nations Development Program) defines sustainable development as "progress that satisfies the requirements of the present without compromising the ability of future generations to meet their needs" (UNDP, 2015). The UN established the 2030 Agenda for Sustainable Development in 2015, with 169 goals and 17 Sustainable Development Goals (SDGs). It is a global initiative that focuses on reducing poverty, protecting the environment, and ensuring prosperity for all. India, our nation of vast size and diversity, has significant socioeconomic and environmental differences but possesses great opportunities to integrate inclusive growth with sustainable development. Since the Sustainable Development Goals were adopted a decade ago in 2015, this is a crucial time to assess India's achievements from the beginning in 2015 to the midpoint in 2025. India has made significant progress in reducing the major challenges of poverty, hunger, improving digital and financial inclusion, and improving access to healthcare facilities, ensures universal access to education, and marks the development of infrastructure over the course of this period. However, challenges like gender equality, urbanization, conservation of the environment, and the eradication of hunger remain unresolved. This paper undertakes a comparative and analytical study of India's SDG progress between 2015 and 2025, examining achievements, challenges, and inter-state variations. It also identifies government policies and flagship schemes that have shaped outcomes and proposes forward-looking strategies for the final five years leading up to 2030. (World Bank, 2023; NFHS-5, 2021) [4,13] .
Research Methodology
This study relies entirely on secondary data sources, adopting a descriptive and analytical research design. The major source is the Sustainable Development Report 2025 (SDSN, 2025), which provides India's country profile and progress indicators across all 17 SDGs. Complementary state-level data is drawn from the NITI Aayog SDG India Index Reports (2018-2023). Additional sources include the National Family Health Survey (NFHS-5), the Periodic Labour Force Survey, the Economic Survey of India, and reports from the Ministries of Health, Education, Environment, and Women and Child Development. International comparisons rely on UNDP, World Bank, and UNDESA datasets [13] .
Objectives of the Study
To compare the performance of India in terms of the SDGs from 2015 to 2025. To evaluate India's achievements and challenges in each of the 17 SDGs, with particular focus on the progress made during the period of ten years of implementation. To suggest strategies and recommendations in order to accelerate the progress of India towards SDGs during the remaining five years.
Literature Review
Debnath (2025) [1] conducted research on the progress of the Sustainable Development Goals in Indian states. The results indicate that the northern and eastern states that were poor couldn't keep up with the southern and western states that were moving faster in achieving goals. The study underscored the significance of the different government policies to reducing the regional gaps, emphasizing that disparities in governance, providing better infrastructure, and strengthening institutional framework which are fundamental to their explanatory power. Kumar and Anand (2022) [3] studied the journey of India toward the achievement of SDGs and their findings illustrate that India made a lot of progress in getting people access to energy and reducing poverty. Still, there are lags and not doing well in protecting the environment, achieving gender equality, or reducing hunger. The emphasis of their policies was placed on achieving the goal of balanced development, which necessitates increased support for states that are making slow progress through policy innovations and increased resource allocation. Unni et al. (2025) [15] focused on how Indian states build capacities to achieve sustainable development. Their study showed that states with diversified economies, better education systems, and stronger health infrastructure are performing better. In contrast, states heavily dependent on traditional resource-based growth struggled to convert economic progress into social well-being, this policy tends to point to the importance of integrated policy frameworks. Nevertheless, the extent of progress has varied across different goals and regions, with some areas recording substantial improvements while others continue to demonstrate persistent challenges. To provide a comprehensive understanding, the analysis considers each goal separately, highlighting national achievements, existing gaps, and inter-state variations over the decade.
1SDG 1-No Poverty:
In 2015, when the Sustainable Development Goals were launched, India's poverty headcount ratio at the international poverty line of $2.15 per day was nearly 12%, with states such as Bihar, Jharkhand, and Uttar Pradesh reporting very high poverty rates. But around 2018-2020, schemes like the Pradhan Mantri Jan Dhan Yojana (PMJDY), the National Food Security Act (NFSA), and the expansion of MGNREGA had begun to show the positive impacts like reduction of overall poverty and greater access to financial inclusion especially in rural areas. In 2025, the SDR report highlights that India has reduced poverty drastically, with extreme poverty falling to 1.1% nationally (World Bank, 2023) [13] . Kerala, Himachal Pradesh, and Tamil Nadu are the best performers due to strong social welfare systems and generating employment opportunities, while Bihar and Jharkhand still lag because of weak industrial bases and still a lot of people are dependent on agriculture, having low productivity causing agrarian distress. DBT largely contributes to the success of achieving this goal, PM-KISAN income support for farmers, housing schemes (PM Awas Yojana), and social pensions schemes, which have helped vulnerable households.
SDG 2 -Zero Hunger:
In 2015, India faced a serious food and nutrition challenge, with undernourishment affecting nearly 15% of the population, and child stunting and wasting levels standing at 38% and 20%, respectively (NFHS-5, 2021) [4] . But several, flagship programs such as the Integrated Child Development Scheme (ICDS), the Mid-Day Meal Scheme, and the launch of Poshan Abhiyaan (2018) [16] proves to be successful in improving child and maternal nutrition. However, this progress was uneven across India; while states like Kerala, Punjab, and Tamil Nadu saw nutritional improvements due to stronger health infrastructure systems and efficient Public Distribution Systems (PDS), whereas some states like Bihar, Madhya Pradesh, and Uttar Pradesh continued to struggle with high child malnutrition. In 2025, the SDR data shows only moderate improvement in undernourishment is 13.7%, stunting 35.5%, and wasting 18.7%. The persistence of hunger is directly related to poverty, unequal income distribution which causes weak maternal care. Also, several challenges in PDS cause hindrances in achieving this goal. Yet there are many government schemes such as One Nation One Ration Card, food fortification initiatives, and targeted nutrition programs for women and children are helping India slowly move toward its hunger reduction targets.
SDG 3-Good Health and Well-Being
India's health indicators in 2015 reflected major public health challenges, with the maternal mortality ratio (MMR) at 167 per 100,000 live births, under-five mortality at 47 per 1,000, and life expectancy at 67 years. But the introduction of Ayushman Bharat -Pradhan Mantri Jan Arogya Yojana (2018) [16] Pradesh, and Bihar are lagging because of weak health infrastructure, as the available infrastructure is not sufficient to provide facilities to that much large population of these states and also insufficient doctor-patient ratios adding salt to the wounds. Government strategies like Janani Shishu Suraksha Karyakram, scaling of telemedicine, and expansion of medical colleges in underserved states are now seen as a step in the right direction.
SDG 4 -Quality Education
In 2015, India had already achieved near-universal primary school enrolment, but challenges persisted in retention of students in schools, secondary completion, and quality of learning outcomes. States like Kerala and Himachal Pradesh were ahead in literacy and enrolment of students, while states like Bihar and Uttar Pradesh lagged behind due to several reasons. To improve the enrolment rate and the literacy rate the government launched reforms under the Samagra Shiksha Abhiyan (2018) [16] and emphasising on quality through learning outcomes and infrastructure. The adoption of the National Education Policy (NEP) 2020 [17] marked a turning point by expanding access to early childhood care, vocational education, and digital learning. In 2025, India's net primary enrolment stands at 99.9%, youth literacy at 97%, and secondary completion at 85.5%. However, Kerala continues to excel due to high public spending on education and community participation, while Bihar and Jharkhand report high dropout rates and infrastructure gaps in education. The expansion of ICT under Digital India and free textbook/scholarship schemes have played crucial roles in ensuring inclusivity.
SDG 5 -Gender Equality
In 2015, gender disparities were evident across different sectors and at different scales like in labor participation, education, and political representation, with female labor force participation at just 32% nationally. Several initiatives are taken by GoI to improve the female labour participation such as Beti Bachao, Beti Padhao (2015), reservation for women in local governance, and gender-sensitive financial schemes began to improve outcomes. By 2025, India has made a female-to-male labor force participation ratio 42.6%, family planning coverage stands at 77.5%, yet only 13.8% of parliamentary seats are held by women. States such as Kerala and Sikkim show higher women participation in education and employment, while states like Rajasthan, Bihar, and Uttar Pradesh continue to face cultural and structural barriers.
Initiatives like PM Ujjwala Yojana, ensuring access to clean cooking fuels, and Stand-Up India, providing credit to women entrepreneurs, proves to be very beneficial in increasing the role and importance of women in several sectors.
SDG 6-Clean Water and Sanitation
SDG 6-Clean Water and Sanitation
SDG12-Responsible Consumption and Production:
In 2015, India's waste management and sustainable consumption practices were at a nascent stage, with rising municipal solid waste and electronic waste, but limited collection infrastructure. By 2018-2020, campaigns like Swachh Bharat, Plastic Waste Management Rules (2016, amended 2021), and promotion of circular economy principles began to shape awareness. In 2025, India produces around 0.4 kg of municipal solid waste per person daily and 2.9 kg of electronic waste per capita annually. While states like Kerala and Sikkim lead in waste segregation and plastic bans, others continue to grapple with landfill overflows and inadequate recycling. National initiatives promoting Extended Producer Responsibility (EPR), energy efficiency through Perform, Achieve and Trade (PAT) scheme, and industrial waste management are essential to aligning India's growth with sustainable consumption.
SDG 13-Climate Action
India was experiencing a rise in carbon emissions due to coal dependence of all the major industries, though its per capita CO₂ emissions were lower than the global average. India's commitment to renewable energy and emission reduction in the Paris Agreement lead to a shift in policy outlook of India. [6,7] . By 2020, India expanded its role through initiatives like the International Solar Alliance and active participation in the UN. By 2025, government spending on health and education is 5.4% of GDP, and India's support to multilateralism is rated at 63.
Conclusion and Recommendations
The comparative analysis of India's Sustainable Development Goals performance from 2015 to 2025 reveals a decade of remarkable gains alongside deep-rooted challenges. The most significant achievements include the steep decline in extreme poverty, near-universal access to electricity and primary education, improvements in maternal and child health, and the expansion of digital and financial inclusion. These advancements are possible with effective implementations of Government schemes such as MGNREGA, Swachh Bharat Mission, Ayushman Bharat, PM Ujjwala Yojana, Jal Jeevan Mission, and the National Education Policy. Despite these improvements, India still has a long way to go to eradicate issues like hunger, attain gender equality, and make cities more sustainable and environmentally friendly. Global issues are shown by instances like child hunger, pollution in the air and water, loss of biodiversity, and disparities in opportunity between states.
The findings indicate that development in India is uneven.
States like Kerala, Himachal Pradesh, and Tamil Nadu are top achievers, whereas states like Bihar, Jharkhand, and Uttar Pradesh are lagging behind. India's progress could be uneven and incomplete without specific state-level efforts India has to implement multifaceted strategies to achieve the goals by 2030. Initially, it is essential to boost the efforts made to address hunger and nutrition. Poshan Abhiyaan, that assures universal PDS coverage and encourages sustainable agriculture and fortified foods. Secondly, gender empowerment must move forward from social campaigns to structural reforms, which aims to improve women's access to several opportunities like political representation, and workforce participation etc.
Third, the core of development should be environmental sustainability, which can be achieved by expanding renewable energy, enforcing air quality regulations, safeguarding forests and biodiversity, and urging circular economy practices. Fourth, there is a need to invest in affordable housing, public transportation facilities, and effective waste management to solve the waste disposal and cleanliness issues in cities. Lastly, to mitigate different disparities among the states, it is necessary to enhance fiscal devolution and statewide collaborations. States that are behind in these areas must implement some unique programs for infrastructure, education, and health. India's progress to attain the SDGs by 2030 will rely on both central initiatives and the state efforts to innovate, collaborate, and execute policies customized to their own developmental circumstances.
Figures and tables from the paper
References
14 in the original paper- Debnath S. Progress of Sustainable Development Goals in Indian States. Indian Journal of Sustainable Development. 2025;12(1):55-68.
- International Energy Agency (IEA). India Energy Outlook 2022. Paris: IEA; 2022. Available from: https://www.iea.org
- Kumar R, Anand S. India's Progress towards SDGs: Achievements and Challenges. Economic and Political Weekly. 2022;57(24):47-56.
- Ministry of Health and Family Welfare. National Family Health Survey (NFHS-5), 2019-21. Government of India; 2021. Available from: http://rchiips.org/nfhs
- NITI Aayog. SDG India Index and Dashboard 2023-24. Government of India; 2023. Available from: https://sdgindiaindex.niti.gov.in
- Sachs J, Kroll C, Lafortune G, Fuller G, Woelm F. Sustainable Development Report 2023. Cambridge: Cambridge University Press; 2023.
- Sustainable Development Solutions Network (SDSN). Sustainable Development Report 2025: India Country Profile. SDSN; 2025. Available from: https://www.sdgindex.org
- United Nations Development Programme (UNDP). Human Development Report 2015. New York: UNDP; 2015. Available from: http://hdr.undp.org
- United Nations Children's Fund (UNICEF), World Health Organization (WHO). Progress on Household Drinking Water, Sanitation and Hygiene 2000-2020. Geneva: WHO/UNICEF; 2022. Available from: https://washdata.org
- United Nations. Transforming our World: The 2030 Agenda for Sustainable Development. New York: United Nations; 2015. Available from: https://sdgs.un.org/2030agenda
- World Bank. World Bank Data: India. Washington DC: World Bank; 2023. Available from: https://data.worldbank.org/country/india
- World Economic Forum. Global Gender Gap Report 2022. Geneva: World Economic Forum; 2022. Available from: https://www.weforum.org
- Unniet et al. Samagra. 2025.
- Government of India. National Education Policy (NEP). 2020.