
Research article · 2025 · Full text
International Journal of Geography Geology and EnvironmentFish, food, and affordability: Nutritional and livelihood dimensions of marine fish consumption by low-income households in Contai coastal region, West Bengal
Volume 7(9) · Pages 43–58 · DOI: 10.22271/27067483.2025.v7.i9a.408 ↗
Research areasFisheries and Aquaculture StudiesFish Biology and Ecology StudiesChild Nutrition and Water Access
Abstract
Author-writtenMarine fish play a vital role in the dietary and economic well-being of the households as economically weaker sections in society and region. Marine fisheries form a nutritional and economic lifeline for low-income households in the Contai coastal region of Purba Medinipur, West Bengal. Despite their importance, the links between species preference, affordability, nutritional contribution, and household food security remain under- documented. This study addresses these gaps through three objectives to document species preference and consumption patterns across coastal households, to assess the affordability of marine fish species using a Food Affordability Index (FAI), to evaluate nutritional quality and socio-economic relevance of commonly consumed fish. A stratified household survey (n=156) was undertaken, integrating species-wise price monitoring, FAI estimation, nutrient composition analysis (protein, omega-3 fatty acids, calcium, iodine, vitamin D), and the Household Food Insecurity Access Scale (HFIAS).Findings reveal that affordable small pelagic and low-value demersal fish dominate consumption, contributing substantially to protein and micronutrient intake. The mean FAI demonstrated significant inter-coastal and inter-species variation, with low-cost species ensuring high nutrient returns per unit price. Nutrient-specific visualizations and radar plots highlighted stingrays and sardines as nutrient-rich, cost-effective species. However, food insecurity remains prevalent: 44% households are food secure, 38% mildly to moderately insecure, and 19% severely insecure (mean HFSS = 11.8). This reflects fragile access to marine fish amidst market fluctuations and ecological pressures.The study emphasizes the dual role of affordable fisheries in sustaining household nutrition and local livelihoods. Policy recommendations include strengthening low-value fish supply chains, promoting nutrition-sensitive fisheries management, and integrating marine fish into regional food security planning.
Summary
Source-checkedPlain-language reading of the full paper, prepared with AI and checked against the text. Each point links to the authors' own words.
Why it matters
- In the Contai coastal region of West Bengal, marine fisheries are essential for the economic and nutritional survival of low-income households. View evidence ↗
- Affordable marine fish are the primary source of animal protein for these households because they are significantly cheaper than meat or poultry. View evidence ↗
- Access to affordable fish is becoming more difficult due to unstable prices, seasonal shortages, and overfishing. View evidence ↗
The question
- The study aims to document fish species preferences, assess affordability using a Food Affordability Index (FAI), and evaluate the nutritional and socio-economic value of commonly consumed fish. View evidence ↗
What they did
- Researchers used purposive sampling to survey 156 low-income households and 40 vendors across five coastal markets. View evidence ↗
- To target vulnerable populations, the study only included households with a monthly income below Rs. 12,000. View evidence ↗
- The methodology combined price monitoring, FAI calculations, analysis of specific nutrients (protein, omega-3, calcium, iodine, vitamin D), and the HFIAS for food security. View evidence ↗
What they found
- Indian anchovy (76.25%) and White anchovy (74.25%) are the most consumed species, followed by sea tiger prawn (72.25%) and Bombay duck (69.50%). View evidence ↗
- On average, households must spend 30.68% of their daily wages to buy one kilogram of fish. View evidence ↗
- The most affordable fish species are White Anchovy and Indian Anchovy (both FAI = 21.3) and Bombay Duck (FAI = 22.9). View evidence ↗
- Food insecurity is widespread: only 43.6% of households are food secure, while 37.8% are mildly to moderately insecure and 18.6% are severely insecure. View evidence ↗
- Indian mackerel (643 IU), Indian anchovy (250 IU), and white sardine (210 IU) are the primary sources of Vitamin D among the studied species. View evidence ↗
- Tourism in Mandarmani and Digha-Sankarpur-Tajpur increases fish prices, making them less affordable for local low-income residents. View evidence ↗
What it means
- The authors conclude that targeted pricing interventions and fisheries management are necessary to keep nutrient-rich fish accessible to the poor. View evidence ↗
Visual summary
2 visualsIllustrations explain the paper; charts are replotted from the paper's own table values.
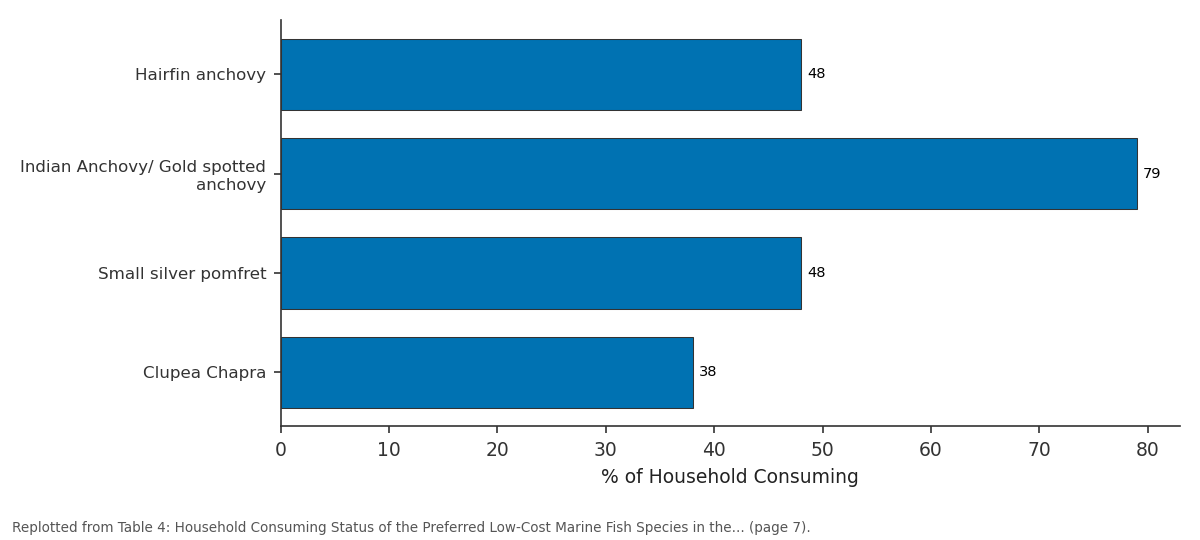
Mandarmani Coast: Ramnagar-II: Hairfin anchovy vs Indian Anchovy/ Gold... vs Small silver pomfret vs Clupea Chapra
Replotted from Table 4 (page 7) of the original paper. Every bar is the paper's own table value.
View source evidence ↗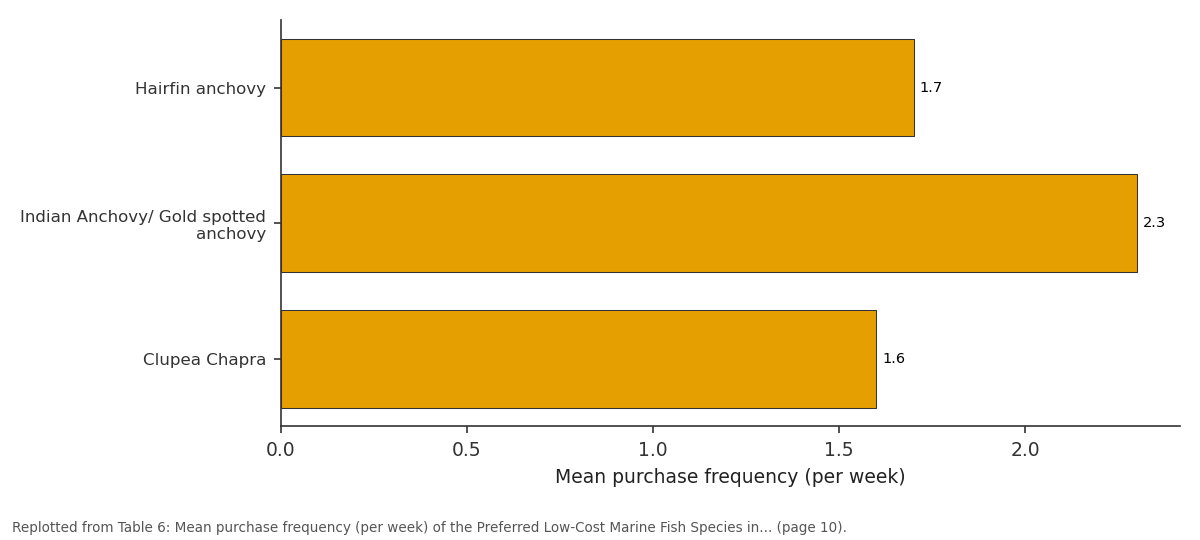
Mandarmani Coast: Ramnagar-II: Hairfin anchovy vs Indian Anchovy/ Gold... vs Clupea Chapra
Replotted from Table 6 (page 10) of the original paper. Every bar is the paper's own table value.
View source evidence ↗Figures & tables
From the original paper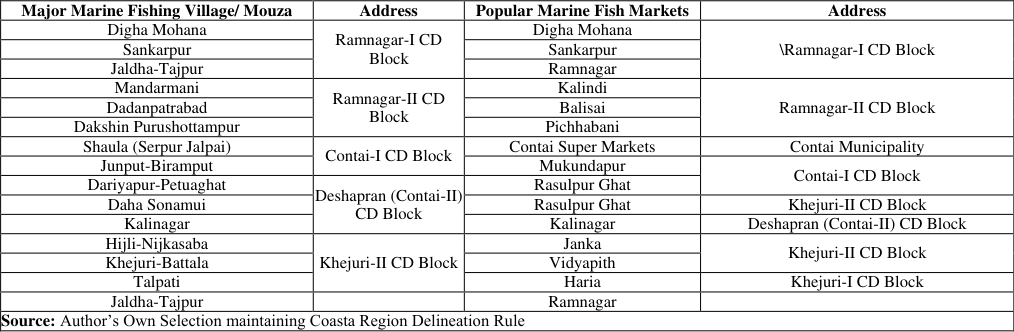 Table 1
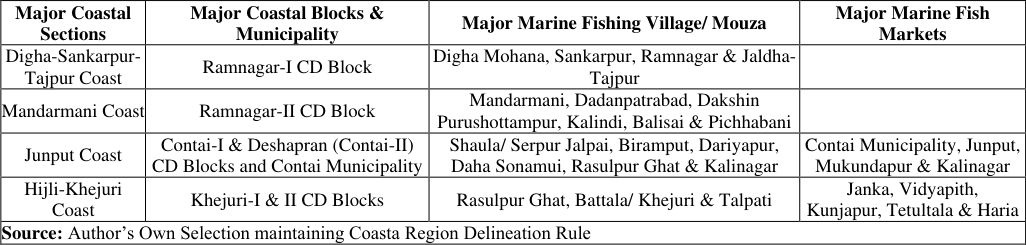 Table 2
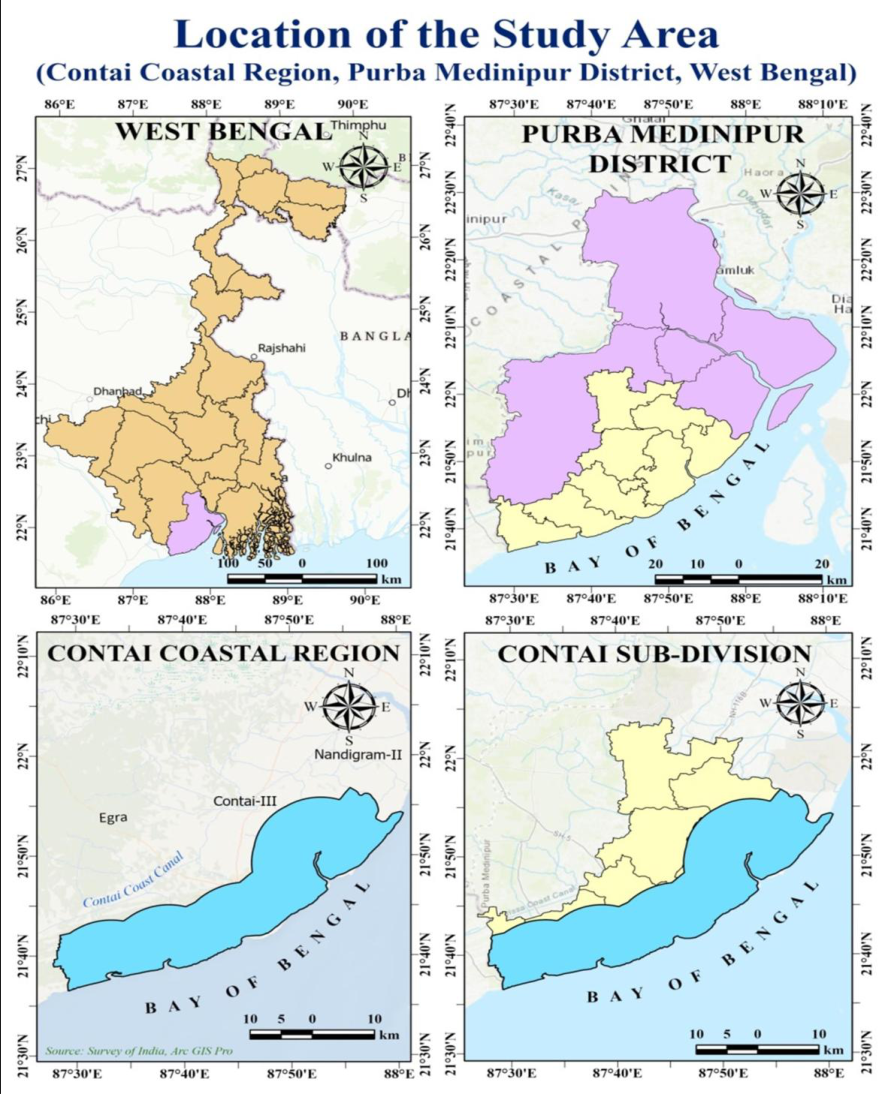 Figure 1
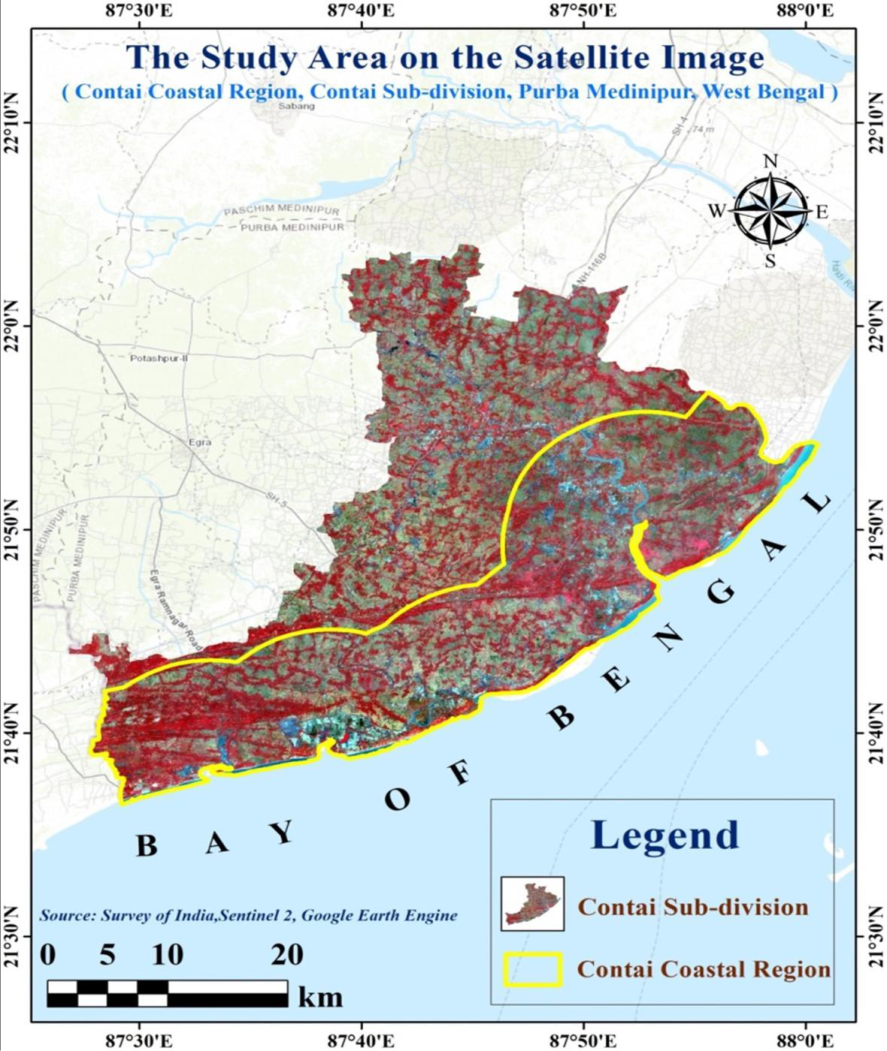 Figure 2
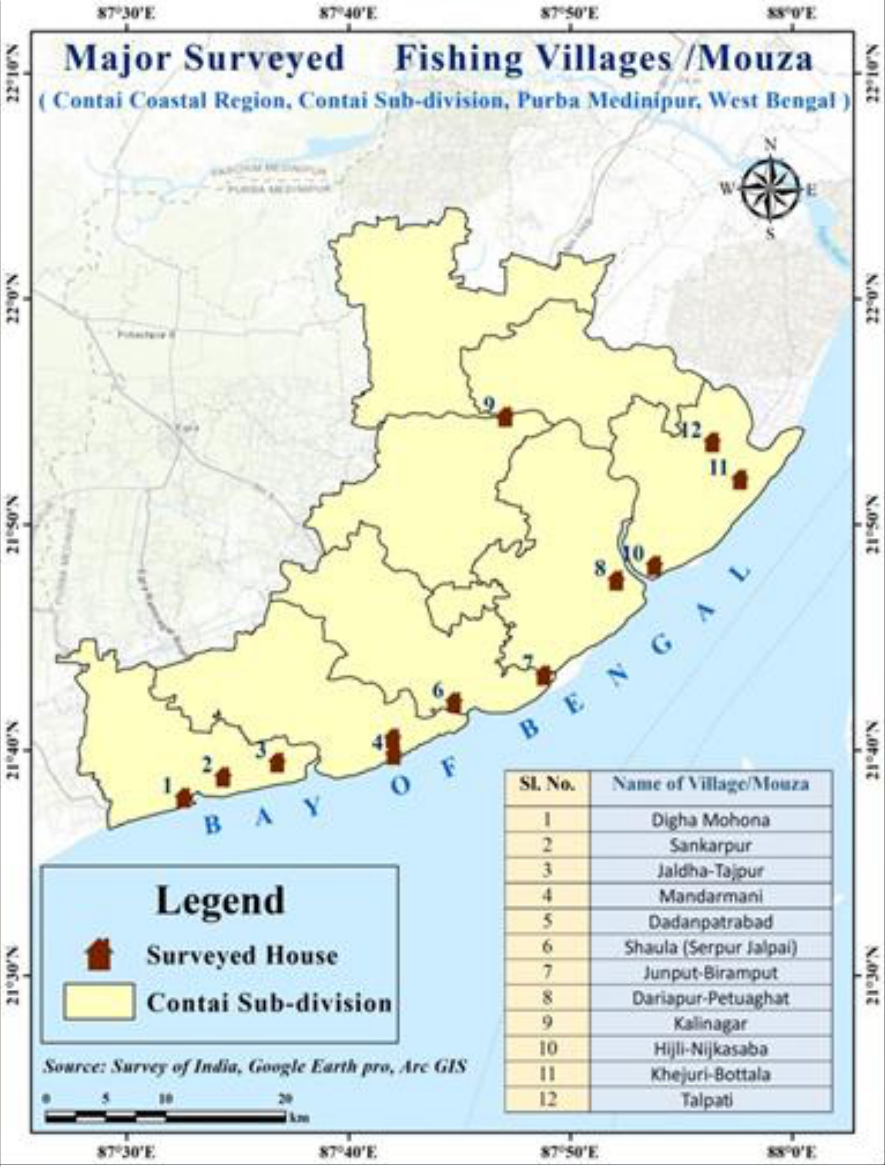 Figure 3
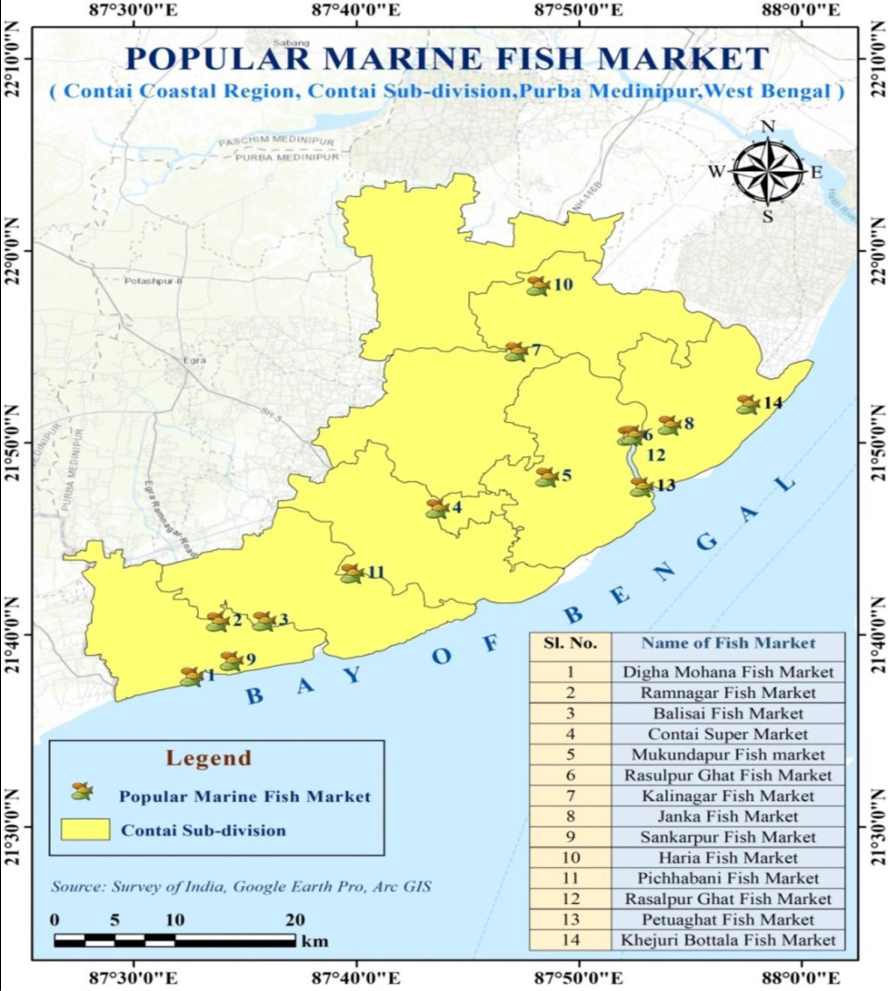 Figure 4
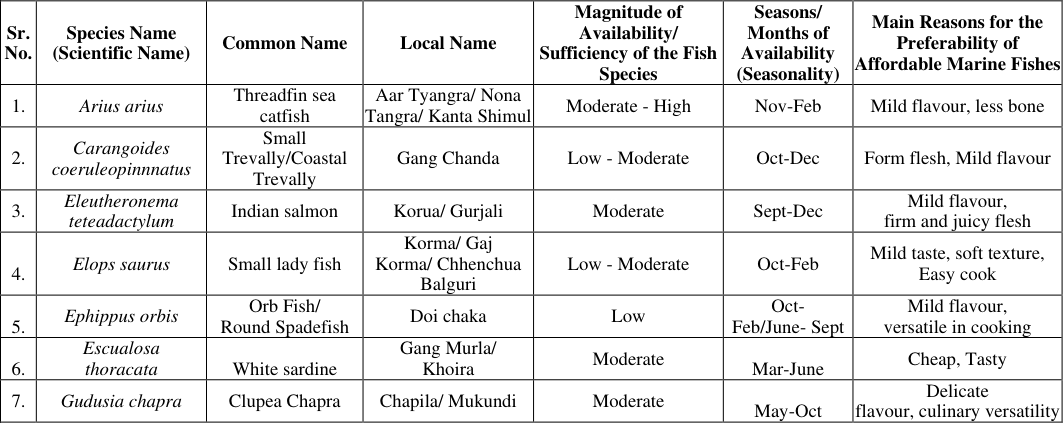 Table 3
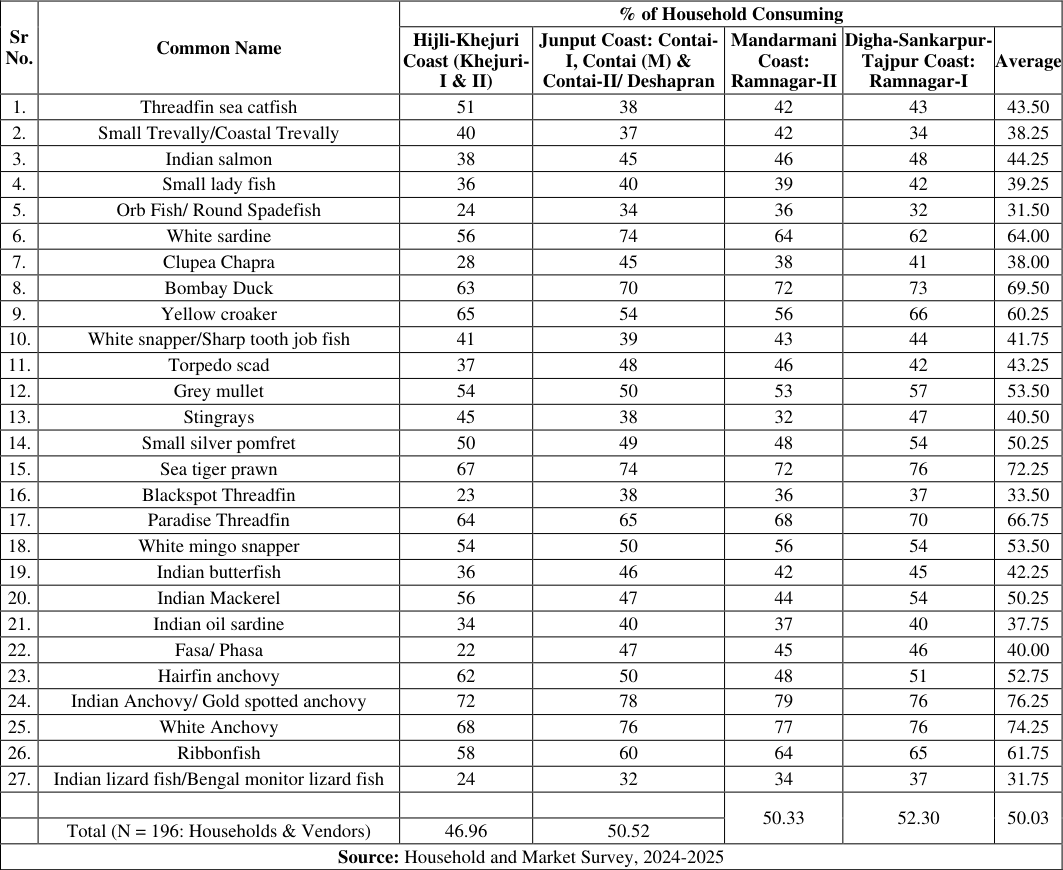 Table 4
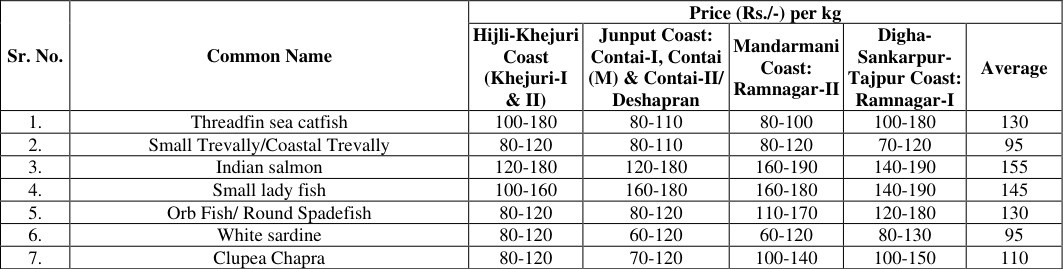 Table 5
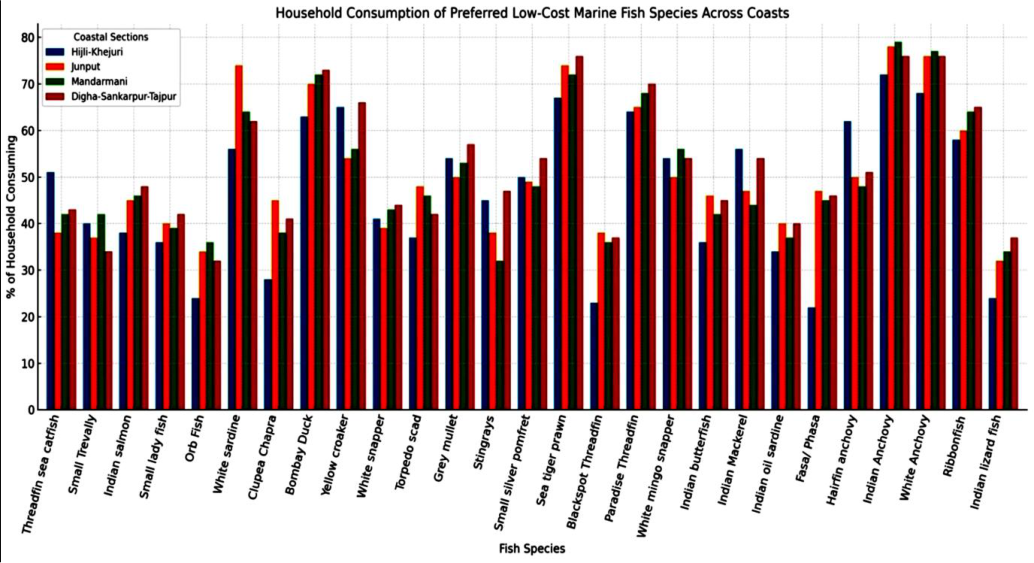 Figure 5
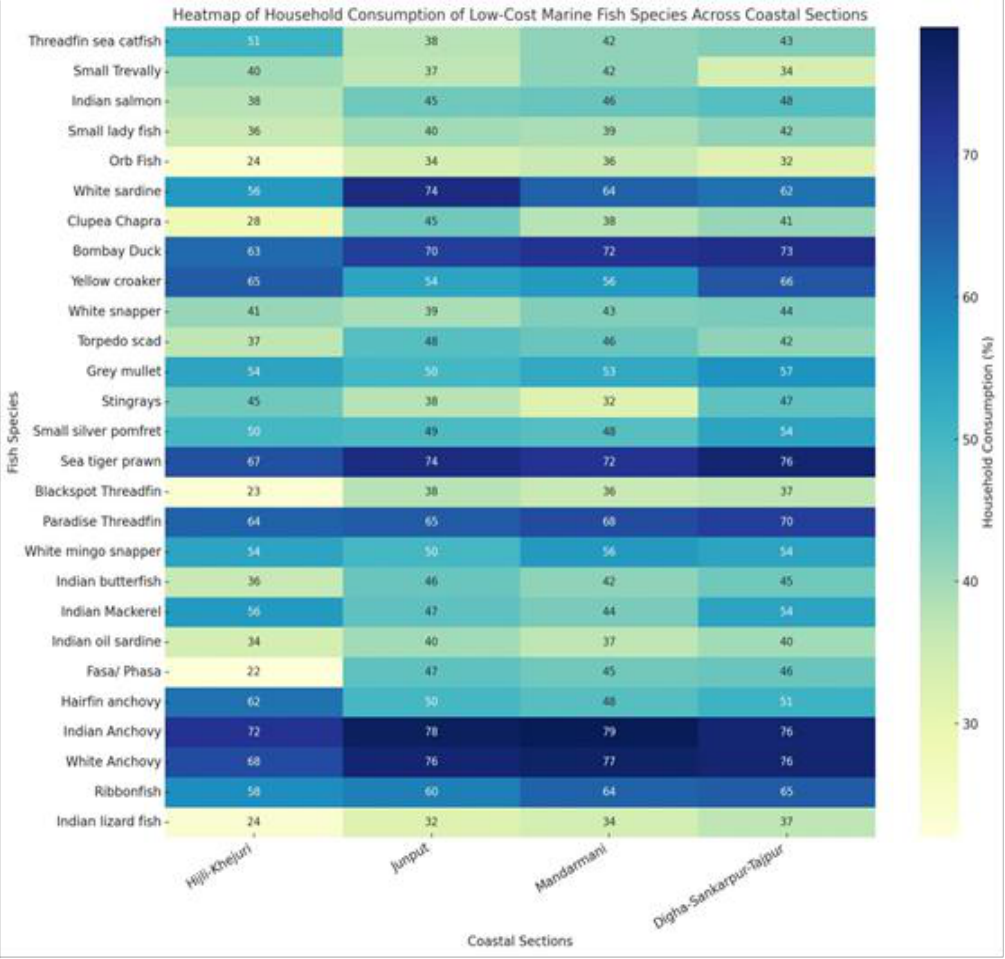 Figure 6
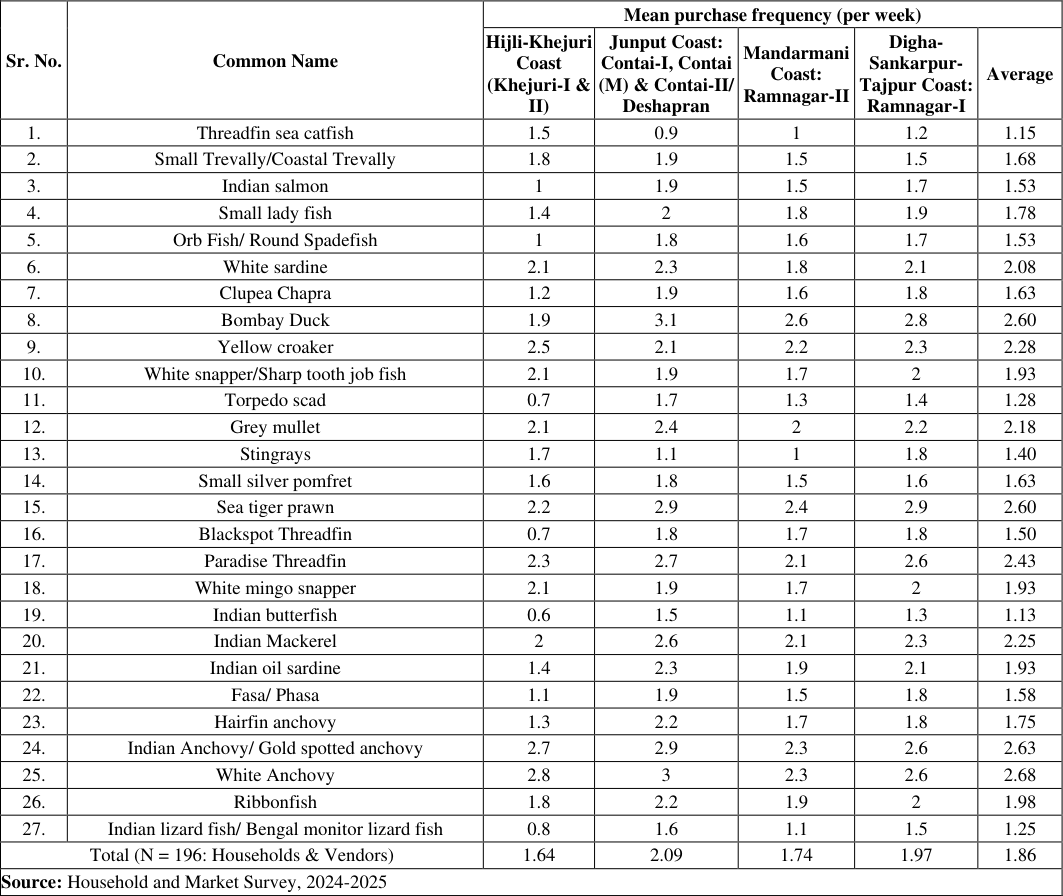 Table 6
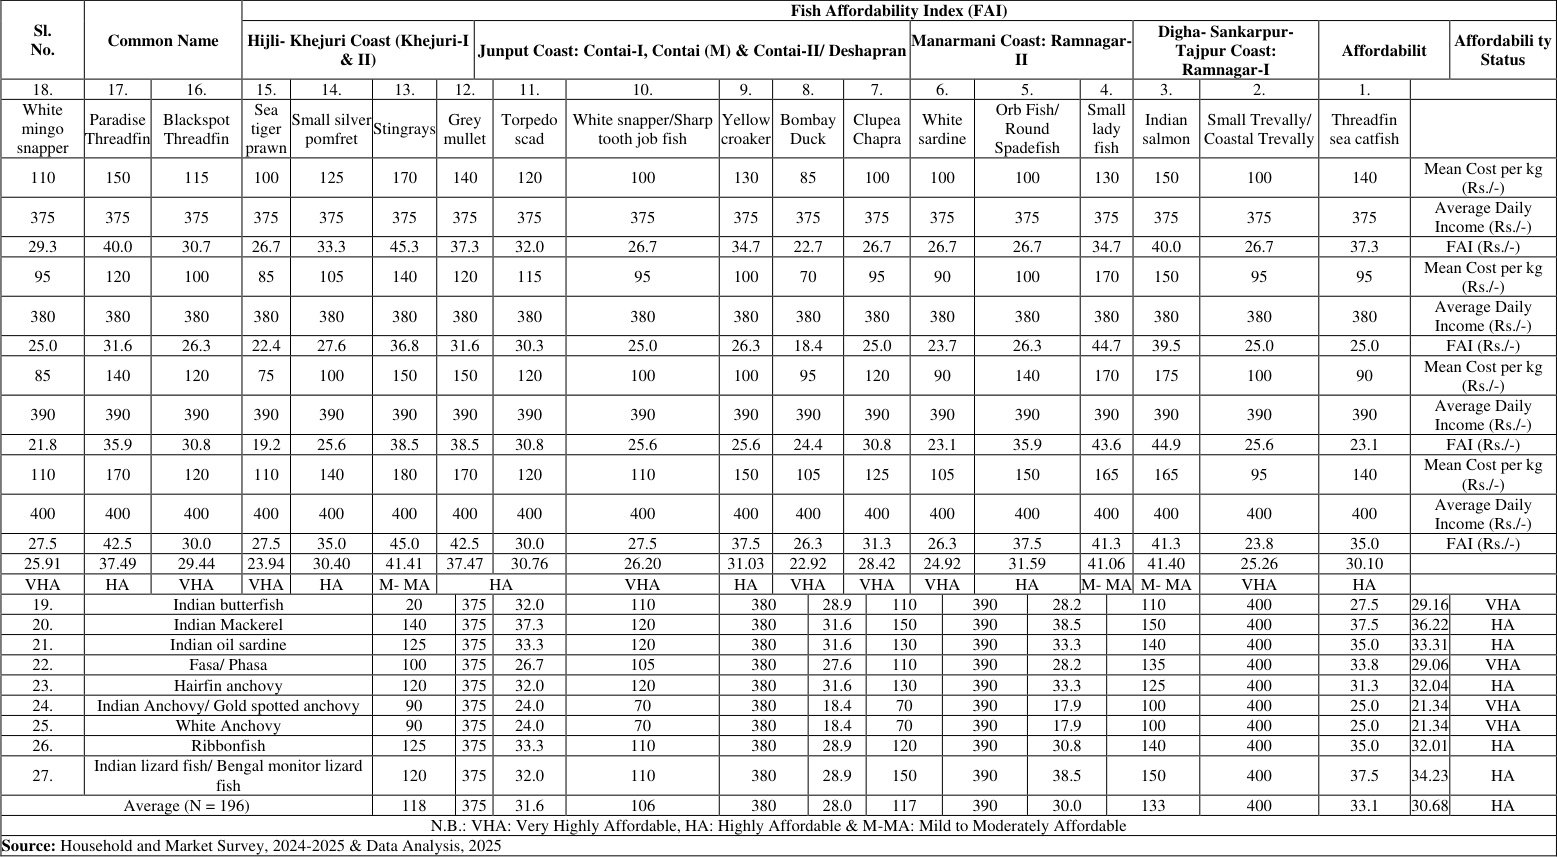 Table 7
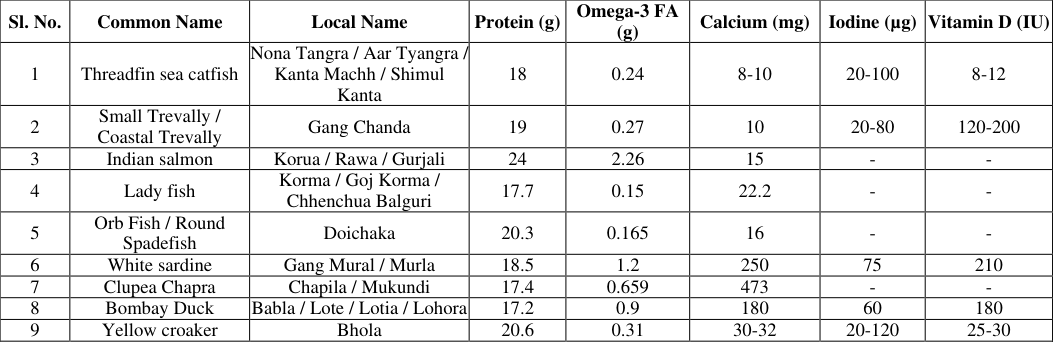 Table 8
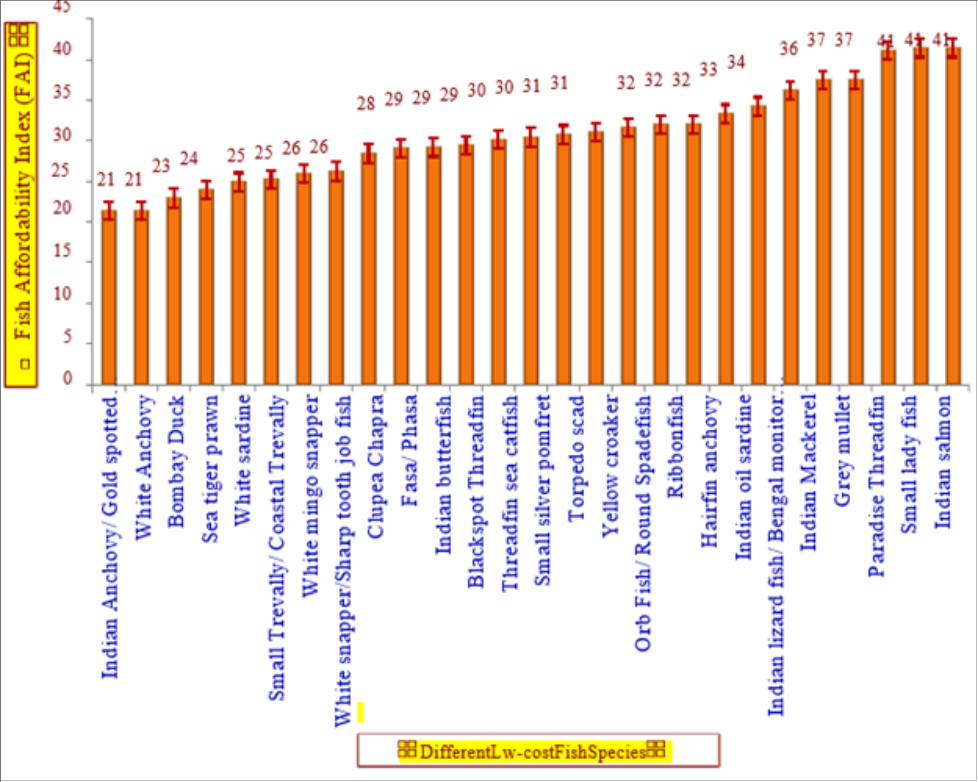 Figure 7
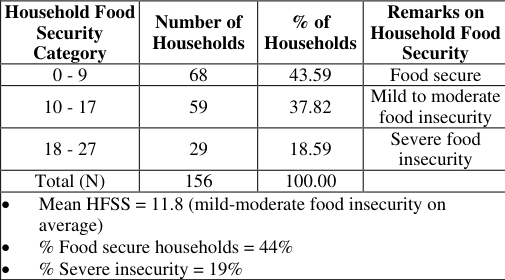 Table 9
Introduction
Marine fisheries play a pivotal role in the coastal food economy of eastern India, particularly in the Contai coastal region of Purba Medinipur, West Bengal. Among low-income households, affordable marine fish species remain the dominant source of animal protein, supplying essential nutrients at a fraction of the cost of other protein-rich foods such as meat or poultry (ICMR-NIN, 2017). Their availability and relatively low price make them indispensable in household diets, functioning not only as a staple food but also as a buffer against economic shocks and livelihood uncertainties. Embedded deeply in cultural food practices, marine fish consumption is both a nutritional necessity and a socio-cultural tradition. At the global level, aquatic foods are increasingly recognized as nutrient-dense dietary staples capable of addressing protein and micronutrient deficiencies. They provide highquality protein, bioavailable minerals, and omega-3 fatty acids vital for cardiovascular health, cognitive development, and overall well-being (FAO, 2024; Robinson et al., 2022) [6,14] . In particular, small pelagic fish, often consumed whole, are exceptionally rich in calcium, iodine, and vitamin D. These nutrients are of special importance for maternal health, child growth, and the reduction of "hidden hunger" in resource-constrained communities (Khan et al., 2023) [11] .
Despite this recognized importance, limited research in West Bengal has examined the combined dimensions of species preference, nutritional quality, and socio-economic value of affordable marine fish. Most existing studies have focused on capture fisheries or trade dynamics, while overlooking how consumption patterns directly intersect with nutrition and household affordability. This lack of integrated evidence creates a gap in understanding the role of low-cost fish in food security and community resilience. Addressing this gap is crucial for informing fisheries management, public health nutrition, and coastal development policies aimed at ensuring both dietary security and livelihood sustainability (CMFRI, 2021) [3] .
Literature Review 2.1 Aquatic foods and nutrition
Marine fish, particularly small pelagic species, provide highly digestible protein and essential fatty acids, as well as critical micronutrients such as calcium and iodine. Studies in South Asia highlight their role in preventing proteinenergy malnutrition and micronutrient deficiencies (Khan et al., 2023) [11] .
Affordability and access
Small pelagic species such as sardines, anchovies, and Bombay duck are typically inexpensive and culturally embedded in coastal diets (Robinson et al., 2022) [14] . Their affordability makes them central to household food security strategies in low-and middle-income countries.
Socio-economic aspects
Fish consumption patterns in India are shaped by price, availability, and cultural preference (Salim et al., 2020) [15] . Low-income households often rely on these species for up to 60% of their total protein intake (CMFRI, 2021) [3] . In West Bengal, particularly in Purba Medinipur, daily fish consumption is high, but seasonal supply gaps and market price fluctuations present major challenges (Mathew & George, 1991) [12] .
West Bengal and Contai fisheries context
The Contai coastal belt (Junput-Mandarmani-Petuaghat) hosts numerous landing centres dominated by small-scale fisheries. These fisheries face infrastructural challenges, especially in cold chain storage, which lead to reliance on traditional preservation methods such as drying (Bhanja et al., 2023) [2] .
Gender and household nutrition
Women play a decisive role in purchasing and preparing fish for household consumption. Gender-inclusive fisheries planning and support for women-led retail can enhance both livelihoods and nutrition outcomes (ICSF, 2023).
Statement of Problem
Low-income households in the Contai coastal region increasingly struggle to access affordable marine fish because of overfishing, seasonal shortages, and unstable market prices. Although several low-cost species continue to sustain local diets, there is insufficient research documenting their consumption trends, nutritional value, and socio-economic importance. This knowledge gap restricts the ability of policymakers, fisheries managers, and public health planners to design evidence-based strategies that enhance nutritional security and strengthen coastal livelihoods. Without such insights, both community wellbeing and the sustainability of marine resources remain at risk.
Specific Objectives
1. To examine species preferences and affordability of marine fish consumed by low-income households in the Contai coastal region. 2. To assess the nutritional value of commonly consumed low-cost marine fish species 3. in relation to dietary needs. 4. To evaluate the socio-economic significance of affordable marine fish consumption for household food security and livelihoods.
Methods
Methods
Study Area and Sampling
The study was conducted in the Contai coastal region of Purba Medinipur, West Bengal, a major hub of marine fishing and consumption. A purposive sampling approach was applied to select five coastal markets (Contai, Digha, Junput, Tajpur, and Shankarpur), where affordable fish species are commonly sold. Data were collected through household surveys (n = 156 low-income households) and market surveys (n = 40 vendors). Households were selected based on income thresholds (below Rs. 12,000/-per month) to represent vulnerable communities dependent on marine fish for protein intake.
For the study, the different coastal fishing villages and markets are considered along the Contai coastal belt, including Hijli-Khejuri, Petuaghat, Junput, Shaula (Sherpur Jalpai), Dadanpatrabad, Mandarmani, Sankarpur and Digha of Purba Medinipur district in West Bengal.
Fish Affordable Index (FAI)
An FAI score ≤ 20% was considered affordable, while higher values indicated reduced accessibility for lowincome households.
Categories of FAI based on FAO affordability guidelines: <40% = Highly affordable 40-60% = Affordable to moderately affordable >60% = Low affordability (financially burdensome)
Nutritional Analysis
Nutrient composition (protein, fat, calcium, iron, and omega-3 fatty acids) of selected low-cost fish species (e.g., Sardinella longiceps, Harpadon nehereus, Trichiurus lepturus) was compiled from ICMR-NIN (2017) and supplemented with laboratory proximate analysis of representative samples. Nutrient density scores and cost-tonutrient ratios were computed to compare affordability of nutrients across species. Results and Discussion 6.1 Species Preference The household consumption patterns reveal strong regional and species-specific preferences across the Contai coastal stretches. On average, about 50% of surveyed households consumed the listed low-cost marine fishes, though the proportions varied significantly by species and coast. High-consumed species: Anchovies emerged as the most widely consumed, with Indian anchovy (76.25%) and White anchovy (74.25%) dominating household diets, followed closely by sea tiger prawn (72.25%) and Bombay duck (69.50%). These species are affordable, abundantly available, and nutritionally dense, making them critical to food security. Moderately consumed species: Species like yellow croaker (60.25%), ribbonfish (61.75%), grey mullet (53.50%), white mingo snapper (53.50%), and small silver pomfret (50.25%) reflected moderate popularity, often driven by seasonal availability and local market access. Low-consumed species: Fasa (40.00%), stingrays (40.50%), orb fish (31.50%), and Indian lizard fish (31.75%) registered relatively low household preference, possibly due to taste, handling difficulty, or cultural biases against certain varieties. Regional variation: Consumption levels were highest in Digha-Sankarpur-Tajpur (52.30%) and lowest in Hijli-Khejuri (46.96%), reflecting disparities in local fish landings, distribution networks, and consumer preferences. Junput and Mandarmani households showed mid-range but consistent consumption (≈50%). Overall, the findings suggest that while anchovies, prawns, and small pelagic species are central to coastal diets, underutilized but nutritionally valuable species (e.g., stingrays, threadfins, orb fish) remain underrepresented in household consumption. This points to both opportunities for nutritional diversification and the need for policy interventions to stabilize market access and affordability. The pricing pattern of low-cost marine fish species across the Hijli-Khejuri, Junput, Mandarmani, and Digha-Sankarpur-Tajpur coasts reflects a combination of availability, seasonality, demand-supply dynamics, and local consumption preferences.
Pricing Status of the Preferred Low-Cost Marine Fish Species
Pricing Status of the Preferred Low-Cost Marine Fish Species
General Price Range and Affordability
Prices of most species fall between ₹80-180 per kg, indicating their role as relatively affordable protein sources compared to premium marine fish (e.g., hilsa, large pomfret, tiger prawns). Exceptionally, some species such as stingrays (₹140-200/kg), grey mullet (₹120-200/kg), and Indian salmon (₹120-190/kg) occupy the higher spectrum of the "lowcost" range, reflecting demand among middle-income fish consumers.
Inter-Coastal Price Variations
Junput Coast shows a generally lower price range (₹60-120/kg for sardines, anchovies, Bombay duck, and prawns), suggesting stronger availability due to proximity to landing centres (Junput-Biramput, Shaula, Deshapran) and active small-scale fisheries. Digha-Sankarpur-Tajpur registers higher average prices, especially for yellow croaker (₹200/kg), stingrays (₹200/kg), and lady fish (₹190/kg), likely influenced by tourism-driven demand and higher vendor margins. Mandarmani Coast shows moderate-to-high prices, again reflecting its tourism-linked seafood demand and relatively smaller local landing compared to Digha. Hijli-Khejuri records wide price ranges (e.g., threadfin catfish ₹100-180, Bombay duck ₹50-120), showing its position as a major estuarine-coastal fish hub with high seasonal variability.
Species-Specific Insights
Bombay Duck (Lote/Lohora) remains the cheapest option (₹40-150/kg), sustaining its role as the most accessible protein for lower-income households. Anchovies (Ruli/Amudi, Tapra) also remain highly affordable (₹40-120/kg), particularly in Junput and Mandarmani, supporting food security in fishing households.
Croakers (Bhola), grey mullet (Khosla), and stingrays (Shankar), though still categorized as "low-cost", approach premium boundaries in tourist areas. Small silver pomfret (Rupchanda), although cheaper than large pomfret, still costs up to ₹180/kg, reflecting its aspirational value in household diets.
Socio-Economic Implications
The data indicates that households in Junput and Hijli-Khejuri have relatively better access to cheaper marine protein due to direct landings. Tourism-influenced coasts (Mandarmani and Digha-Sankarpur-Tajpur) see price inflation, reducing affordability for local low-income households while catering to urban/tourist demand. This spatial disparity highlights the dual character of marine fish markets balancing subsistence nutrition for locals and commercial seafood demand for outsiders.
Nutritional and Policy Relevance
From a nutritional security perspective, sustaining the affordability of species like Bombay duck, anchovies, sardines, and threadfin catfish is critical. Policymakers must recognize the impact of tourism and market integration on local fish pricing, ensuring equitable access for fishing communities and lowincome buyers through price stabilization mechanisms or local cooperative markets.
Table 4 reveals that while the Contai coastal fisheries still provide diverse low-cost marine fish, rising tourism and inter-coastal market variations risk making certain species unaffordable for local households. The dual pressure of nutritional dependence vs. commercial seafood demand is at the core of this dynamic, and any blue economy or food security strategy must address this pricing disparity. The analysis of mean purchase frequency of low-cost marine fish species across the four coastal segments of the Contai region (Hijli-Khejuri, Junput, Mandarmani, and Digha-Shankarpur-Tajpur) provides important insights into localized consumption behavior, affordability, and cultural preference (Table 5). The overall household and vendor average shows that low-cost marine fishes are purchased 1.86 times per week, reflecting their significance as staple protein sources in coastal diets. A striking trend is the high preference for anchovies (Ruli/Amudi), particularly Indian Anchovy (2.63 times/week) and White Anchovy (2.68 times/week). Their affordability, ease of cooking, and availability in bulk during peak fishing seasons contribute to this dominance. Anchovies are also nutritionally valued for their calcium and omega-3 fatty acid content, making them attractive to low-and middle-income households. Similarly, Bombay Duck (Babla/Lote) and Sea Tiger Prawn (Nona Chingri) record a purchase frequency above 2.5, highlighting their strong market presence despite slight price fluctuations. Species such as Yellow Croaker (Bhola), Grey Mullet (Khosla), Indian Mackerel (Potol), and Paradise Threadfin (Tupsi) also show relatively high purchase frequencies (>2), suggesting a regional preference for mid-tier species that balance affordability with taste. These fishes often serve as alternatives when high-demand anchovy or sardine stocks fluctuate. In contrast, certain species display comparatively low purchase frequencies, such as Indian Butterfish (Chandi/Karati, 1.13), Indian Lizard Fish (Kanua, 1.25), and Torpedo Scad (Gura, 1.28). Their limited demand can be attributed to factors such as bony texture, seasonal unavailability, or cultural disinterest. Notably, Stingrays (Shankar/Mulli) also record a lower purchase frequency (1.40), suggesting that although nutritionally rich (particularly in protein and calcium), they are less favored for regular household consumption, possibly due to cooking challenges and religious taboos in certain fishing communities. A spatial contrast emerges across coasts. Junput and Digha-Tajpur show the highest mean purchase frequencies (2.09 and 1.97, respectively), while Hijli-Khejuri reports the lowest average (1.64). This reflects differences in market accessibility, income levels, and cultural eating patterns. For example, Junput markets act as redistribution nodes, receiving bulk landings from trawlers and supplying surrounding villages, which helps stabilize fish prices and increase weekly purchase capacity. Conversely, Hijli-Khejuri relies more on localized artisanal landings with seasonal fluctuations, reducing weekly household purchases. From a socio-economic lens, the dataset illustrates the tight coupling of affordability, availability, and preference. Lowcost fishes (sardines, anchovies, Bombay duck, croaker, mullet) dominate household baskets, while high-value demersal species (pomfrets, snappers, butterfish) are purchased less frequently, often reserved for special occasions. This aligns with the findings of previous coastal livelihood studies in West Bengal, where marine fish consumption is not merely a dietary practice but also reflects household income resilience and local food culture. Table 5 demonstrates that anchovies, sardines, Bombay duck, prawns, and croakers form the backbone of coastal food security in the Contai coastal region. Spatial variation further indicates that market connectivity and affordability play a stronger role than species availability alone in shaping purchase frequency. This insight contributes to understanding how low-cost marine fishes sustain both nutritional resilience and cultural continuity among fishing and non-fishing households in coastal Bengal.
| Sr No. | Common Name | % of Household Consuming | — | — | — | — |
|---|---|---|---|---|---|---|
| Hijli-Khejuri Coast (Khejuri- I & II) | Junput Coast: Contai- I, Contai (M) & Contai-II/ Deshapran | Mandarmani Coast: Ramnagar-II | Digha-Sankarpur- Tajpur Coast: Ramnagar-I | Average | ||
| 1. | Threadfin sea catfish | 51 | 38 | 42 | 43 | 43.50 |
| 2. | Small Trevally/Coastal Trevally | 40 | 37 | 42 | 34 | 38.25 |
| 3. | Indian salmon | 38 | 45 | 46 | 48 | 44.25 |
| 4. | Small lady fish | 36 | 40 | 39 | 42 | 39.25 |
| 5. | Orb Fish/ Round Spadefish | 24 | 34 | 36 | 32 | 31.50 |
| 6. | White sardine | 56 | 74 | 64 | 62 | 64.00 |
| 7. | Clupea Chapra | 28 | 45 | 38 | 41 | 38.00 |
| 8. | Bombay Duck | 63 | 70 | 72 | 73 | 69.50 |
| 9. | Yellow croaker | 65 | 54 | 56 | 66 | 60.25 |
| 10. | White snapper/Sharp tooth job fish | 41 | 39 | 43 | 44 | 41.75 |
| 11. | Torpedo scad | 37 | 48 | 46 | 42 | 43.25 |
| 12. | Grey mullet | 54 | 50 | 53 | 57 | 53.50 |
| 13. | Stingrays | 45 | 38 | 32 | 47 | 40.50 |
| 14. | Small silver pomfret | 50 | 49 | 48 | 54 | 50.25 |
| 15. | Sea tiger prawn | 67 | 74 | 72 | 76 | 72.25 |
| 16. | Blackspot Threadfin | 23 | 38 | 36 | 37 | 33.50 |
| 17. | Paradise Threadfin | 64 | 65 | 68 | 70 | 66.75 |
| 18. | White mingo snapper | 54 | 50 | 56 | 54 | 53.50 |
| 19. | Indian butterfish | 36 | 46 | 42 | 45 | 42.25 |
| 20. | Indian Mackerel | 56 | 47 | 44 | 54 | 50.25 |
| 21. | Indian oil sardine | 34 | 40 | 37 | 40 | 37.75 |
| 22. | Fasa/ Phasa | 22 | 47 | 45 | 46 | 40.00 |
| 23. | Hairfin anchovy | 62 | 50 | 48 | 51 | 52.75 |
| 24. | Indian Anchovy/ Gold spotted anchovy | 72 | 78 | 79 | 76 | 76.25 |
| 25. | White Anchovy | 68 | 76 | 77 | 76 | 74.25 |
| 26. | Ribbonfish | 58 | 60 | 64 | 65 | 61.75 |
| 27. | Indian lizard fish/Bengal monitor lizard fish | 24 | 32 | 34 | 37 | 31.75 |
| 50.33 | 52.30 | 50.03 | ||||
| Total (N = 196: Households & Vendors) | 46.96 | 50.52 | ||||
| Source: Household and Market Survey, 2024-2025 |
Table text extracted from the original PDF; superscript letters are shown inline. The original table image is below.
View original table image
Purchase Frequency Patterns in the Contai Coastal Region
Purchase Frequency Patterns in the Contai Coastal Region
Affordability of Low-Cost Marine Fish across Coastal Sections
The Fish Affordability Index (FAI) reflects the proportion of daily household income required to purchase one kilogram of a preferred marine fish species. In the Contai coastal region, the average FAI across all species and sections is 30.68%, meaning that nearly one-third of daily wages must be spent to purchase a kilogram of fish. This underlines both the nutritional importance and the economic strain of accessing marine protein for low-income households. Spatial variation is evident. The Hijli-Khejuri coast consistently recorded higher FAIs (mean = 31.6), reflecting higher average fish prices (Rs.118/-per kg) combined with slightly lower daily incomes. In contrast, the Junput coast showed the lowest affordability (mean FAI = 28.0) due to lower mean fish prices (Rs. 106/-per kg) relative to household incomes. Mandarmani (mean FAI = 30.0) and Digha-Sankarpur-Tajpur (mean FAI = 33.1) lie in between, with the latter reflecting both tourism-driven market pressures and higher fish demand. Species-wise contrasts further highlight affordability divides. The most affordable species include Bombay Duck (FAI = 22.9), Indian Anchovy/Gold spotted anchovy (21.3), and White Anchovy (21.3). These small pelagic fishes are purchased more frequently (see Table 5) and function as nutritional safety nets. In contrast, species such as Indian salmon (41.4), Stingrays (41.4), and Small ladyfish (41.1) exhibit much higher FAIs, indicating reduced affordability for poorer households despite their high nutrient value. Intermediate species, including Grey mullet (37.5), Indian mackerel (36.2), and Paradise threadfin (37.5), represent fish of aspirational status: consumed less frequently due to price constraints but valued when affordable [14] , which emphasize how market price fluctuations directly influence protein access among artisanal fishing households. In the Contai region, where the mean daily income ranges only between Rs. 375-400/-, the purchase of high FAI species could be prohibitive, pushing households towards anchovies, sardines, and Bombay duck for regular consumption. Policy implications emerge from this analysis. First, affordability patterns show that anchovy, sardine, and Bombay duck are nutritionally and economically critical for sustaining food security in the region. Second, the high FAIs of larger demersal and commercially valued species highlight the risk of nutritional inequity, where poorer households are excluded from accessing high-protein, highmicronutrient fish. Finally, targeted subsidies, improved local distribution, and community-based fish processing initiatives could reduce affordability gaps while ensuring both dietary diversity and fisheries sustainability. The nutritional analysis highlights a substantial diversity in the nutrient profile of lowcost marine fish consumed across the Contai coastal region. Protein content is generally high, ranging from 14 g in stingrays to over 24 g in Indian salmon and white mingo snapper, underscoring their role as affordable protein sources for low-income households. Species such as Indian salmon (24 g) and torpedo scad (21 g) particularly stand out for their elevated protein density.
Nutritional Contributions of Low-Cost Marine Fish
In terms of fatty acid composition, omega-3 levels show significant variation. While stingrays provide negligible amounts, oily species like Indian anchovy (1.8 g), white anchovy (1.45 g), and white sardine (1.2 g) emerge as critical sources of essential fatty acids that support cardiovascular and cognitive health. This reinforces the nutritional importance of small pelagic species that remain relatively affordable in local markets (Chaudhary et al., 2023) [13] . Calcium content is particularly remarkable in certain species, such as torpedo scad (670 mg), Clupea chapra (473 mg), and Indian oil sardine (382 mg), which far exceed the average calcium content of commonly consumed terrestrial foods. Such species are consumed whole or semi-whole (including bones), explaining the higher mineral contribution. Similarly, iodine availability, though inconsistently documented, is highest in Indian mackerel (140 µg) and anchovies (80 µg), offering dietary support against iodine deficiency disorders common in coastal and inland populations. Vitamin D values also reveal striking contrasts: Indian mackerel (643 IU), Indian anchovy (250 IU), and white sardine (210 IU) function as key dietary sources, compensating for limited sunlight exposure or poor dietary diversity in vulnerable communities. In contrast, stingrays, butterfish, and other benthic or low-fat species contribute minimally to vitamin D intake.
Overall, these findings suggest that while all species provide baseline protein, the nutritional density of small pelagics (sardines, anchovies, scads) is far superior in terms of calcium, iodine, omega-3 fatty acids, and vitamin D. This elevates their importance not only as affordable food but also as public health assets in combating micronutrient deficiencies. For policymakers and nutritionists, these results reinforce the necessity of safeguarding access to such species through sustainable fishery management, equitable pricing strategies, and nutrition-sensitive interventions.
Household Food Security Score (HFSS)
Household Food Insecurity Access Scale (HFIAS), which scores responses to questions on food sufficiency. Each household gets a score from 0 (fully food secure) to 27 (severely food insecure). [11,14] . Nutritional profiles demonstrate their potential to address both macroand micronutrient deficiencies. However, seasonal price fluctuations linked to fishing bans and monsoon weather pose risks to dietary stability (CMFRI, 2021). Infrastructure gaps in cold storage exacerbate post-harvest losses, limiting supply and inflating prices (Bhanja et al., 2023) [2] . Gender dynamics are central to fish access and preparation, echoing global SSF findings that women's roles in fisheries value chains should be supported to strengthen household nutrition (ICSF, 2023) [10] .
The findings highlight that low-income households in Contai rely heavily on small, affordable marine fish for nutritional and cultural reasons. The high protein and micronutrient
Major Findings 1. Centrality of small pelagics in diets and budgets
Indian/white anchovies, white sardine, and Bombay duck dominate weekly purchase frequency (≥2-2.7 times/week on average) and exhibit the lowest FAIs (≈21-25%), confirming their role as the primary, affordable protein sources.
Affordability pressure at one-third of daily income
The overall mean Fish Affordability Index (FAI) is ≈30.7% across species and coasts i.e., one kilogram of fish costs roughly a third of daily wages leaving little room for dietary diversity when prices rise.
Coastal market gradient in prices and affordability
Junput shows the lowest median prices and FAIs (mean FAI ≈28%), consistent with landing-site proximity and shorter value chains. Digha-Sankarpur-Tajpur has the highest medians and dispersion (mean FAI ≈33%), reflecting tourism-driven mark-ups and greater volatility. Hijli-Khejuri is affordability-constrained (mean FAI ≈31.6%) with more seasonality. 4. Price volatility concentrated in a few "workhorse" species: Bombay duck, ribbonfish, and threadfin catfish display wide min-max ranges across coasts indicative of monsoon/sea-state sensitivity and cold-chain gaps that amplify household risk.
Nutrient density strongly favors small pelagics
Anchovies and sardines deliver high omega-3 (1.2-1.8 g/100 g), calcium (≥250-320 mg; higher when eaten bone-in), iodine (up to 80 µg), and vitamin D (≈190-250 IU). Torpedo scad, Clupea chapra and Indian oil sardine show exceptionally high calcium (≥382-670 mg), supporting bone health where dairy intake is low.
Nutritional inequality risk with higher-FAI species
Indian salmon, stingrays, grey mullet, and paradise threadfin have FAIs ≈37-41%; these become occasional or aspirational purchases, constraining access to their protein and micronutrients for poorer households. 7. Purchase frequency aligns with affordability and accessibility: Coasts with better landings access (Junput/Deshapran) show higher average weekly purchases (≈2.09), while Hijli-Khejuri averages ≈1.64, underscoring the importance of local supply chains. 8. Tourism exerts a systemic price premium: In Digha-Mandarmani clusters, mid-tier species (croakers, small pomfret, mackerel) price up during peak tourism, crowding out low-income buyers exactly when sea conditions limit artisanal income. 9. Information asymmetry at retail: Large inter-vendor spreads and weak price transparency suggest search costs and bargaining for low-income consumers, worsening effective affordability.
Gendered value-chain opportunities underutilized
Women's SHGs are well placed for dried/salted/ smoked fish processing of small pelagics but face working-capital and quality-control constraints that limit scale and nutrition-sensitive products.
Policy
Policy
Conclusion
This study underscores the critical nutritional and socioeconomic significance of low-cost marine fish species in the Contai coastal region, where affordability, accessibility, and dietary diversity remain major challenges for low-income communities. The analysis highlights that while certain species such as Indian salmon, Indian anchovy, sardines, and mackerel provide superior protein, omega-3 fatty acids, and micronutrients, other inexpensive varieties like catfish, ribbonfish, Bombay duck, and clupeids play an equally vital role in ensuring food security and cultural continuity of coastal households. The affordability index further demonstrates that these species act as a "nutritional safety net" for vulnerable groups, especially during periods of seasonal scarcity and price fluctuations. For society, the message is that sustaining the consumption of small, underutilized, and nutrient-dense species is essential to combating hidden hunger and supporting community health. For institutions, particularly nutritionists, health workers, and extension services, this research emphasizes the urgent need to integrate marine fish into dietary planning, school nutrition programs, and community awareness campaigns. For planners and policymakers, the findings point toward the necessity of adopting targeted fisheries management and pricing interventions, ensuring that nutrient-rich, affordable fish species remain accessible to the poor without compromising ecological sustainability. Ultimately, safeguarding the dual roles of marine fish as both cultural food heritage and nutritional capital is indispensable for achieving equitable coastal development, resilience, and improved public health. By linking fisheries management with food security policies, this research provides a pathway toward a sustainable blue economy that nourishes both people and ecosystems.
Figures and tables from the paper
| Major Marine Fishing Village/ Mouza | Address | Popular Marine Fish Markets | Address |
|---|---|---|---|
| Digha Mohana | Ramnagar-I CD Block | Digha Mohana | \Ramnagar-I CD Block |
| Sankarpur | Sankarpur | ||
| Jaldha-Tajpur | Ramnagar | ||
| Mandarmani | Ramnagar-II CD Block | Kalindi | Ramnagar-II CD Block |
| Dadanpatrabad | Balisai | ||
| Dakshin Purushottampur | Pichhabani | ||
| Shaula (Serpur Jalpai) | Contai-I CD Block | Contai Super Markets | Contai Municipality |
| Junput-Biramput | Mukundapur | Contai-I CD Block | |
| Dariyapur-Petuaghat | Deshapran (Contai-II) CD Block | Rasulpur Ghat | |
| Daha Sonamui | Rasulpur Ghat | Khejuri-II CD Block | |
| Kalinagar | Kalinagar | Deshapran (Contai-II) CD Block | |
| Hijli-Nijkasaba | Khejuri-II CD Block | Janka | Khejuri-II CD Block |
| Khejuri-Battala | Vidyapith | ||
| Talpati | Haria | Khejuri-I CD Block | |
| Jaldha-Tajpur | Ramnagar | ||
| Source: Author’s Own Selection maintaining Coasta Region Delineation Rule |
Table text extracted from the original PDF; superscript letters are shown inline. The original table image is below.
View original table image
| Sr. No. | Common Name | Mean purchase frequency (per week) | — | — | — | — |
|---|---|---|---|---|---|---|
| Hijli-Khejuri Coast (Khejuri-I & II) | Junput Coast: Contai-I, Contai (M) & Contai-II/ Deshapran | Mandarmani Coast: Ramnagar-II | Digha- Sankarpur- Tajpur Coast: Ramnagar-I | Average | ||
| 1. | Threadfin sea catfish | 1.5 | 0.9 | 1 | 1.2 | 1.15 |
| 2. | Small Trevally/Coastal Trevally | 1.8 | 1.9 | 1.5 | 1.5 | 1.68 |
| 3. | Indian salmon | 1 | 1.9 | 1.5 | 1.7 | 1.53 |
| 4. | Small lady fish | 1.4 | 2 | 1.8 | 1.9 | 1.78 |
| 5. | Orb Fish/ Round Spadefish | 1 | 1.8 | 1.6 | 1.7 | 1.53 |
| 6. | White sardine | 2.1 | 2.3 | 1.8 | 2.1 | 2.08 |
| 7. | Clupea Chapra | 1.2 | 1.9 | 1.6 | 1.8 | 1.63 |
| 8. | Bombay Duck | 1.9 | 3.1 | 2.6 | 2.8 | 2.60 |
| 9. | Yellow croaker | 2.5 | 2.1 | 2.2 | 2.3 | 2.28 |
| 10. | White snapper/Sharp tooth job fish | 2.1 | 1.9 | 1.7 | 2 | 1.93 |
| 11. | Torpedo scad | 0.7 | 1.7 | 1.3 | 1.4 | 1.28 |
| 12. | Grey mullet | 2.1 | 2.4 | 2 | 2.2 | 2.18 |
| 13. | Stingrays | 1.7 | 1.1 | 1 | 1.8 | 1.40 |
| 14. | Small silver pomfret | 1.6 | 1.8 | 1.5 | 1.6 | 1.63 |
| 15. | Sea tiger prawn | 2.2 | 2.9 | 2.4 | 2.9 | 2.60 |
| 16. | Blackspot Threadfin | 0.7 | 1.8 | 1.7 | 1.8 | 1.50 |
| 17. | Paradise Threadfin | 2.3 | 2.7 | 2.1 | 2.6 | 2.43 |
| 18. | White mingo snapper | 2.1 | 1.9 | 1.7 | 2 | 1.93 |
| 19. | Indian butterfish | 0.6 | 1.5 | 1.1 | 1.3 | 1.13 |
| 20. | Indian Mackerel | 2 | 2.6 | 2.1 | 2.3 | 2.25 |
| 21. | Indian oil sardine | 1.4 | 2.3 | 1.9 | 2.1 | 1.93 |
| 22. | Fasa/ Phasa | 1.1 | 1.9 | 1.5 | 1.8 | 1.58 |
| 23. | Hairfin anchovy | 1.3 | 2.2 | 1.7 | 1.8 | 1.75 |
| 24. | Indian Anchovy/ Gold spotted anchovy | 2.7 | 2.9 | 2.3 | 2.6 | 2.63 |
| 25. | White Anchovy | 2.8 | 3 | 2.3 | 2.6 | 2.68 |
| 26. | Ribbonfish | 1.8 | 2.2 | 1.9 | 2 | 1.98 |
| 27. | Indian lizard fish/ Bengal monitor lizard fish | 0.8 | 1.6 | 1.1 | 1.5 | 1.25 |
| Total (N = 196: Households & Vendors) | 1.64 | 2.09 | 1.74 | 1.97 | 1.86 | |
| Source: Household and Market Survey, 2024-2025 |
Table text extracted from the original PDF; superscript letters are shown inline. The original table image is below.
View original table image
| Sl. No. | Common Name | — | Fish Affordability Index (FAI) | — | — | — | — | — | — | — | — | — | — | — | — | — | — | — | — | — | — | — | — | — | — | — |
|---|---|---|---|---|---|---|---|---|---|---|---|---|---|---|---|---|---|---|---|---|---|---|---|---|---|---|
| Hijli- Khejuri Coast (Khejuri-I & II) | Junput Coast: Contai-I, Contai (M) & Contai-II/ Deshapran | Manarmani Coast: Ramnagar- II | Digha- Sankarpur- Tajpur Coast: Ramnagar-I | Affordabilit | Affordabili ty Status | |||||||||||||||||||||
| 18. | 17. | 16. | 15. | 14. | 13. | 12. | 11. | 10. | 9. | 8. | 7. | 6. | 5. | 4. | 3. | 2. | 1. | |||||||||
| White mingo snapper | Paradise Threadfin | Blackspot Threadfin | Sea tiger prawn | Small silver pomfret | Stingrays | Grey mullet | Torpedo scad | White snapper/Sharp tooth job fish | Yellow croaker | Bombay Duck | Clupea Chapra | White sardine | Orb Fish/ Round Spadefish | Small lady fish | Indian salmon | Small Trevally/ Coastal Trevally | Threadfin sea catfish | |||||||||
| 110 | 150 | 115 | 100 | 125 | 170 | 140 | 120 | 100 | 130 | 85 | 100 | 100 | 100 | 130 | 150 | 100 | 140 | Mean Cost per kg (Rs./-) | ||||||||
| 375 | 375 | 375 | 375 | 375 | 375 | 375 | 375 | 375 | 375 | 375 | 375 | 375 | 375 | 375 | 375 | 375 | 375 | Average Daily Income (Rs./-) | ||||||||
| 29.3 | 40.0 | 30.7 | 26.7 | 33.3 | 45.3 | 37.3 | 32.0 | 26.7 | 34.7 | 22.7 | 26.7 | 26.7 | 26.7 | 34.7 | 40.0 | 26.7 | 37.3 | FAI (Rs./-) | ||||||||
| 95 | 120 | 100 | 85 | 105 | 140 | 120 | 115 | 95 | 100 | 70 | 95 | 90 | 100 | 170 | 150 | 95 | 95 | Mean Cost per kg (Rs./-) | ||||||||
| 380 | 380 | 380 | 380 | 380 | 380 | 380 | 380 | 380 | 380 | 380 | 380 | 380 | 380 | 380 | 380 | 380 | 380 | Average Daily Income (Rs./-) | ||||||||
| 25.0 | 31.6 | 26.3 | 22.4 | 27.6 | 36.8 | 31.6 | 30.3 | 25.0 | 26.3 | 18.4 | 25.0 | 23.7 | 26.3 | 44.7 | 39.5 | 25.0 | 25.0 | FAI (Rs./-) | ||||||||
| 85 | 140 | 120 | 75 | 100 | 150 | 150 | 120 | 100 | 100 | 95 | 120 | 90 | 140 | 170 | 175 | 100 | 90 | Mean Cost per kg (Rs./-) | ||||||||
| 390 | 390 | 390 | 390 | 390 | 390 | 390 | 390 | 390 | 390 | 390 | 390 | 390 | 390 | 390 | 390 | 390 | 390 | Average Daily Income (Rs./-) | ||||||||
| 21.8 | 35.9 | 30.8 | 19.2 | 25.6 | 38.5 | 38.5 | 30.8 | 25.6 | 25.6 | 24.4 | 30.8 | 23.1 | 35.9 | 43.6 | 44.9 | 25.6 | 23.1 | FAI (Rs./-) | ||||||||
| 110 | 170 | 120 | 110 | 140 | 180 | 170 | 120 | 110 | 150 | 105 | 125 | 105 | 150 | 165 | 165 | 95 | 140 | Mean Cost per kg (Rs./-) | ||||||||
| 400 | 400 | 400 | 400 | 400 | 400 | 400 | 400 | 400 | 400 | 400 | 400 | 400 | 400 | 400 | 400 | 400 | 400 | Average Daily Income (Rs./-) | ||||||||
| 27.5 | 42.5 | 30.0 | 27.5 | 35.0 | 45.0 | 42.5 | 30.0 | 27.5 | 37.5 | 26.3 | 31.3 | 26.3 | 37.5 | 41.3 | 41.3 | 23.8 | 35.0 | FAI (Rs./-) | ||||||||
| 25.91 | 37.49 | 29.44 | 23.94 | 30.40 | 41.41 | 37.47 | 30.76 | 26.20 | 31.03 | 22.92 | 28.42 | 24.92 | 31.59 | 41.06 | 41.40 | 25.26 | 30.10 | |||||||||
| VHA | HA | VHA | VHA | HA | M- MA | HA | VHA | HA | VHA | VHA | VHA | HA | M- MA | M- MA | VHA | HA | ||||||||||
| 19. | Indian butterfish | 20 | 375 | 32.0 | 110 | 380 | 28.9 | 110 | 390 | 28.2 | 110 | 400 | 27.5 | 29.16 | VHA | |||||||||||
| 20. | Indian Mackerel | 140 | 375 | 37.3 | 120 | 380 | 31.6 | 150 | 390 | 38.5 | 150 | 400 | 37.5 | 36.22 | HA | |||||||||||
| 21. | Indian oil sardine | 125 | 375 | 33.3 | 120 | 380 | 31.6 | 130 | 390 | 33.3 | 140 | 400 | 35.0 | 33.31 | HA | |||||||||||
| 22. | Fasa/ Phasa | 100 | 375 | 26.7 | 105 | 380 | 27.6 | 110 | 390 | 28.2 | 135 | 400 | 33.8 | 29.06 | VHA | |||||||||||
| 23. | Hairfin anchovy | 120 | 375 | 32.0 | 120 | 380 | 31.6 | 130 | 390 | 33.3 | 125 | 400 | 31.3 | 32.04 | HA | |||||||||||
| 24. | Indian Anchovy/ Gold spotted anchovy | 90 | 375 | 24.0 | 70 | 380 | 18.4 | 70 | 390 | 17.9 | 100 | 400 | 25.0 | 21.34 | VHA | |||||||||||
| 25. | White Anchovy | 90 | 375 | 24.0 | 70 | 380 | 18.4 | 70 | 390 | 17.9 | 100 | 400 | 25.0 | 21.34 | VHA | |||||||||||
| 26. | Ribbonfish | 125 | 375 | 33.3 | 110 | 380 | 28.9 | 120 | 390 | 30.8 | 140 | 400 | 35.0 | 32.01 | HA | |||||||||||
| 27. | Indian lizard fish/ Bengal monitor lizard fish | 120 | 375 | 32.0 | 110 | 380 | 28.9 | 150 | 390 | 38.5 | 150 | 400 | 37.5 | 34.23 | HA | |||||||||||
| Average (N = 196) | 118 | 375 | 31.6 | 106 | 380 | 28.0 | 117 | 390 | 30.0 | 133 | 400 | 33.1 | 30.68 | HA | ||||||||||||
| N.B.: VHA: Very Highly Affordable, HA: Highly Affordable & M-MA: Mild to Moderately Affordable | ||||||||||||||||||||||||||
| Source: Household and Market Survey, 2024-2025 & Data Analysis, 2025 |
Table text extracted from the original PDF; superscript letters are shown inline. The original table image is below.
View original table image
| Sl. No. | Common Name | Local Name | Protein (g) | Omega-3 FA (g) | Calcium (mg) | Iodine (µg) | Vitamin D (IU) |
|---|---|---|---|---|---|---|---|
| 1 | Threadfin sea catfish | Nona Tangra / Aar Tyangra / Kanta Machh / Shimul Kanta | 18 | 0.24 | 8-10 | 20-100 | 8-12 |
| 2 | Small Trevally / Coastal Trevally | Gang Chanda | 19 | 0.27 | 10 | 20-80 | 120-200 |
| 3 | Indian salmon | Korua / Rawa / Gurjali | 24 | 2.26 | 15 | - | - |
| 4 | Lady fish | Korma / Goj Korma / Chhenchua Balguri | 17.7 | 0.15 | 22.2 | - | - |
| 5 | Orb Fish / Round Spadefish | Doichaka | 20.3 | 0.165 | 16 | - | - |
| 6 | White sardine | Gang Mural / Murla | 18.5 | 1.2 | 250 | 75 | 210 |
| 7 | Clupea Chapra | Chapila / Mukundi | 17.4 | 0.659 | 473 | - | - |
| 8 | Bombay Duck | Babla / Lote / Lotia / Lohora | 17.2 | 0.9 | 180 | 60 | 180 |
| 9 | Yellow croaker | Bhola | 20.6 | 0.31 | 30-32 | 20-120 | 25-30 |
Table text extracted from the original PDF; superscript letters are shown inline. The original table image is below.
View original table image
References
16 in the original paper- Aqua Asia Pacific. Fish consumption in India: Patterns and trends. 2024 Feb 29. https://aquaasiapac.com/2024/02/29/fish-consumptionin-india-patterns-and-trends/
- Bhanja A, Payra P, Mandal B, Das M, Mandal S, Bhunia T. A study on the availability of marine fishes in Digha Mohana Fish Landing Centre, Purba Medinipur, West Bengal, India. Biological Forum -An International Journal. 2023;15(2):285-291.
- Central Marine Fisheries Research Institute (CMFRI). Fish consumption patterns in Purba Medinipur district of West Bengal. 2021. https://eprints.cmfri.org.in/15887/
- CMFRI. Marine fish landings of West Bengal -2022 (Digha RC). 2023. https://eprints.cmfri.org.in/17044/ 5. Department of Fisheries, Government of India. Handbook on Fisheries Statistics 2020. 2020. https://dof.gov.in/sites/default/files/202102/Final_Book.pdf
- FAO. Aquatic foods: An untapped potential for healthy diets (SOFIA 2024 online feature). 2024. https://www.fao.org/3/cd0683en/online/sofia/2024/aqua tic-foods-an-untapped-potential.html
- Food and Agriculture Organization (FAO). Food security and nutrition -Small-scale fisheries and the human right to adequate food. 2019. https://www.fao.org/voluntary-guidelines-small-scalefisheries/key-thematic-areas/food-security-andnutrition/en
- ICMR-NIN. Indian Food Composition Tables 2017. 2017. https://www.nin.res.in/ebooks/IFCT2017.pdf
- Indian Council of Medical Research -National Institute of Nutrition (ICMR-NIN). Dietary Guidelines for Indians. 2nd ed. 2011. https://www.nin.res.in/downloads/DietaryGuidelinesfor NINwebsite.pdf
- International Collective in Support of Fishworkers (ICSF). Social development and sustainable fisheries: West Bengal, India. 2023. https://www.icsf.net/wpcontent/uploads/2023/06/930.ICSF243_Social_Develop ment_West_Bengal_India.pdf
- Khan MI, Rahman MM, Jahan S, Nahiduzzaman M, Hasan MR. Nutritional value of marine fish in Bangladesh and their potential to address malnutrition: A review. Heliyon. 2023;9(3):e13551. https://www.ncbi.nlm.nih.gov/pmc/articles/PMC99752 39/
- Mathew S, George JP. Marine small-scale fisheries of West Bengal: An introduction. FAO Bay of Bengal Programme. 1991. https://www.fao.org/4/ae489e/ae489e00.pdf
- Chaudhary M, Garg AP. Bioactive compounds from plants and animals: A review. Int. J. Adv. Biochem. Res. 2023;7(1):105-117.
- Robinson JPW, Ota Y, Ghosh S, Karim M, Peabody S, Coffey C, et al. Small pelagic fish supply abundant and affordable micronutrients to low-and middle-income countries. Nature Food. 2022;3:1075-1084. https://jpwrobinson.github.io/publication/robinson2022nf/robinson2022-nf.pdf
- Salim SS, Prasad KN, Radhakrishnan EV, Bhat GS. Demand pattern and willingness to pay for high value fish in selected metro cities of Kerala. Indian Journal of Fisheries. 2020;67(4):23-30. https://epubs.icar.org.in/index.php/IJF/article/download /70635/42323/468467
- Shyam SS. Spatial fish consumption paradigms across Kerala. Current Advances in Agricultural Sciences. 2020;12(2):85-90. https://eprints.cmfri.org.in/15868/1/Current%20Advanc es%20in%20Agricultural%20Sciences_2020_Shyam% 20S%20Salim.pdf
- CMFRI. West Bengal Marine Fisheries Census 2016. State volume. 2020. https://eprints.cmfri.org.in/17491/2/WEST%20BENGA L%20Marine%20Fisheries%20Census%20India%2020 16.pdf