
Research article · 2025 · Full text
International Journal of Agriculture and Food ScienceAssessment of dietary intake and nutritional deficiecy among primary school children of deodar taluka of Banaskantha district
Volume 7(9) · Pages 287–291 · DOI: 10.33545/2664844x.2025.v7.i9d.755 ↗
Research areasAgricultural Economics and PracticesChild Nutrition and Water AccessLivestock Management and Performance Improvement
Abstract
Author-writtenThe school-age period is a critical phase for developing essential life skills, including independent eating habits and the formation of food preferences. Establishing healthy dietary practices during this stage lays the groundwork for long-term well-being and adult health. Despite the importance of nutrition during childhood, there remains a significant gap in research focused on the dietary habits and nutritional status of school-going children, particularly in rural areas. This study aimed to evaluate the dietary patterns and identify nutritional deficiencies among primary school children residing in rural areas of Deodar taluka in Banaskantha district. A cross-sectional approach was adopted, involving a sample of 300 children aged between 6 and 12 years. Data on food intake were collected using a 24-hour dietary recall along with a food frequency questionnaire. Clinical assessments were also performed to detect visible signs of nutritional deficiencies. The findings revealed that several nutrient deficiencies were present among the children surveyed. The typical diet of the participants showed low intake of pulses, green leafy vegetables, fruits, and animal-based foods such as meat. These suboptimal dietary habits may stem from unequal food distribution within households and personal food preferences among children. Therefore, dietary practices needs to be improved to avoid nutritional deficiencies that lead to a decrease in the growth spurt, for both physical and mental health.
Summary
Source-checkedPlain-language reading of the full paper, prepared with AI and checked against the text. Each point links to the authors' own words.
Why it matters
- The school-age period is a vital time for forming eating habits and food preferences, which are essential for long-term health into adulthood. View evidence ↗
- There is a notable lack of research regarding the nutritional status and dietary habits of children attending school in rural regions. View evidence ↗
The question
- The study aimed to identify nutritional deficiencies and evaluate dietary patterns in primary school children from rural Deodar taluka, Banaskantha district. View evidence ↗
What they did
- The researchers used a cross-sectional design with a sample of 300 children between the ages of 6 and 12. View evidence ↗
- To ensure unbiased representation, 10 villages were randomly selected from a total of 72 in the taluka. View evidence ↗
- Dietary data were collected via face-to-face interviews using a pre-tested food frequency questionnaire. View evidence ↗
- Qualified healthcare experts or physicians performed clinical evaluations to detect visible signs of nutritional deficiencies. View evidence ↗
What they found
- The vast majority of the children (94.67%) followed a vegetarian diet, with only 5.33% consuming non-vegetarian foods. View evidence ↗
- Cereals and millets were the primary dietary staple, consumed daily by 100% of the children. View evidence ↗
- Pulse consumption was low, with only 21.7% of children eating them daily, while 47.3% consumed them once a week. View evidence ↗
- Fruit intake was very low, with only 4% of children consuming fruits daily, likely due to low income and lack of awareness. View evidence ↗
- Clinical signs included dental caries in 27% of children and spongy or bleeding gums in 17%, suggesting poor oral hygiene or vitamin C deficiency. View evidence ↗
- Severe protein deficiency was indicated by bilateral oedema observed in 15% of the children. View evidence ↗
- Niacin (vitamin B3) deficiency was suggested by the presence of pellagrous dermatitis in 12.67% of the children. View evidence ↗
- Vitamin B-complex deficiency was evident, with cheilosis (13%), angular scars (11%), tongue oedema (13.33%), and glossitis (13%) observed. View evidence ↗
What it means
- The authors concluded that dietary habits were suboptimal, potentially due to personal preferences and unequal food distribution within homes. View evidence ↗
- The authors recommend promoting balanced dietary practices to prevent deficiencies that hinder mental and physical development. View evidence ↗
Visual summary
1 visualsIllustrations explain the paper; charts are replotted from the paper's own table values.
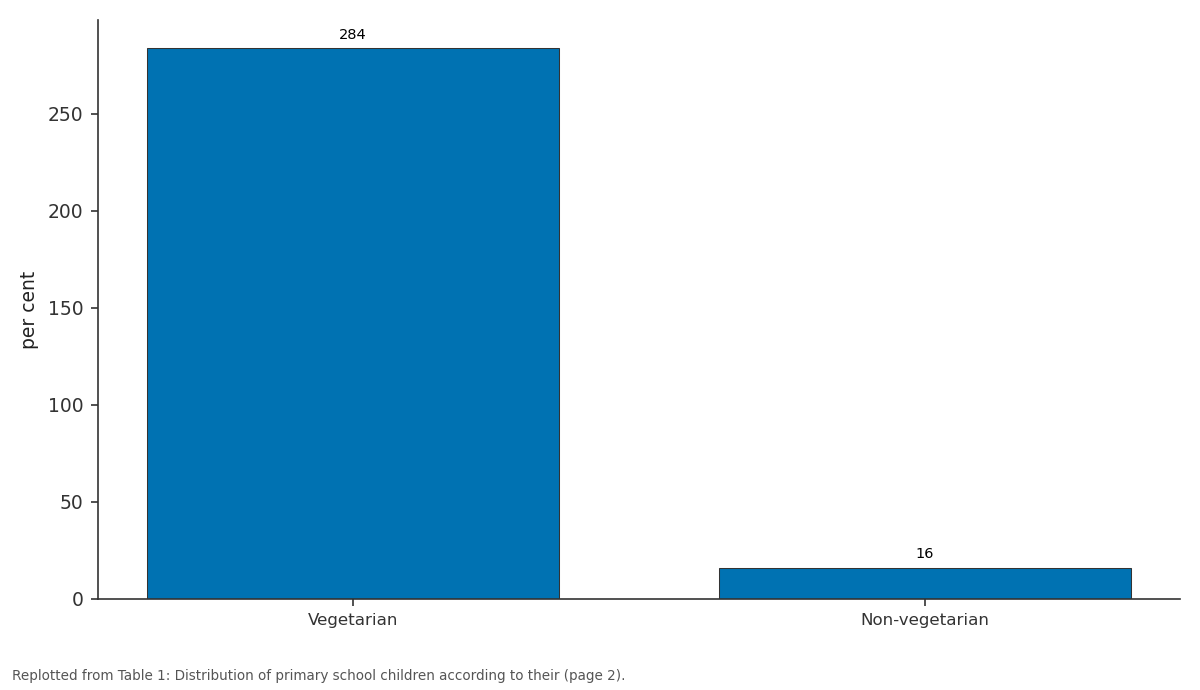
Total / f: Vegetarian vs Non-vegetarian
Replotted from Table 1 (page 2) of the original paper. Every bar is the paper's own table value.
View source evidence ↗Figures & tables
From the original paper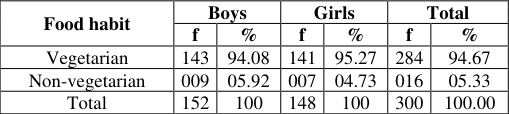 Table 1
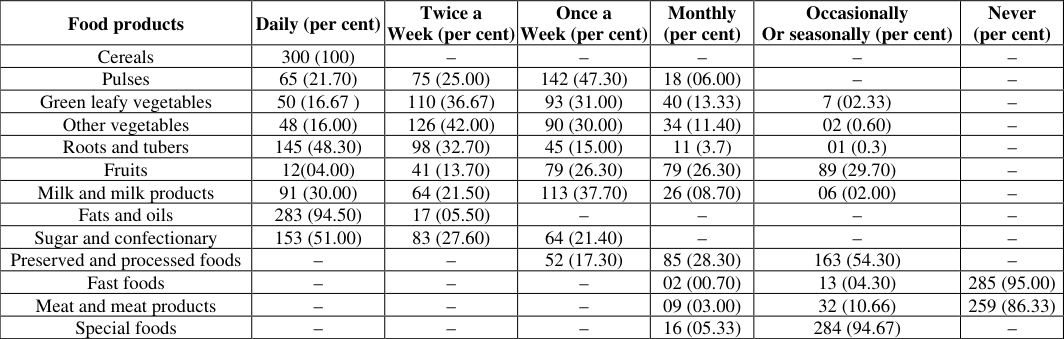 Table 2
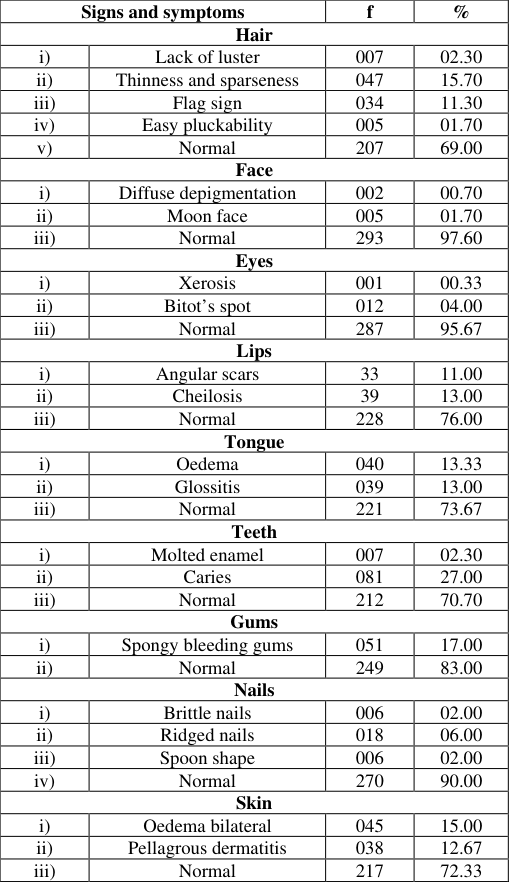 Table 3
Introduction
Diet plays a fundamental role in determining an individual's health and nutritional status. Inadequate dietary intake-both in terms of quality and quantity-is a leading factor contributing to widespread malnutrition, especially among children. To address this issue, dietary assessments form a vital component of evaluating nutritional status, as they help in determining whether an individual's intake meets their nutritional needs. The school-age years represent a critical phase in a child's development, marked by the acquisition of self-feeding skills and the formation of personal food preferences. Establishing healthy eating habits during this stage is essential, as they lay the groundwork for long-term health and nutrition in adulthood. A well-balanced diet during childhood and adolescence is not only important for immediate growth and health (WHO/FAO, 2003) [11] , but also helps form sustainable eating patterns that can last a lifetime (Westenhoefer J, 2002) [16] . Adequate consumption of energy and macronutrients is necessary for physical development, while micronutrients play key roles in metabolic processes (B vitamins), bone health (calcium), blood formation (iron), and growth (zinc). Deficiencies in essential micronutrients-such as vitamin A, iron, and iodinecontinue to be prevalent in many developing countries, including India, and have severe implications for children's health, learning abilities, and overall productivity (Bowley A, 2008; Vijayaraghavan K, 2002) [3,15] . Malnutrition among children remains a major public health concern in tropical and subtropical regions. Importantly, it goes beyond merely satisfying hunger. A child may consume enough to feel full, yet still suffer from hidden hunger due to nutrient deficiencies. Malnutrition is closely linked to poverty and has profound physical and psychological impacts. It is increasingly being recognized not just as a health issue, but also as a violation
Objectives
The specific objectives of the above study were the following: 1. To evaluate the dietary intake of the primary school children 2. To assess the prevalence of nutritional deficiency through clinical signs and symptoms of primary school children
Methods and Materials
This cross-sectional study was carried out in the rural regions of Deodar Taluka, located in Banaskantha District. Deodar Taluka was specifically chosen for the study due to its classification as a socially and educationally backward area. Out of the 72 villages in the Taluka, 10 were selected using a random sampling method to ensure unbiased representation.
During the data collection phase, a list of primary school children aged 6 to 12 years was obtained from schools within the selected villages. From each of these schools, 30 students (including both boys and girls) were randomly chosen, resulting in a total study sample of 300 children.
To gather dietary information, a pre-designed and pre-tested food frequency questionnaire was administered through face-to-face interviews with the participants (as referenced in Basch et al., 1990; Lytle et al., 1998) [1,7] . This approach ensured accurate recall and detailed dietary intake data.
In addition to dietary assessment, clinical evaluations were conducted to identify signs of nutritional deficiencies. These assessments were performed by a qualified physician or healthcare expert. The clinical evaluation followed the guidelines provided by the National Advisory Committee and the Indian Council of Medical Research (NAC-ICMR), as recommended by Swaminathan (2003) [12] . These guidelines facilitated a structured assessment of health conditions in relation to dietary intake. The data obtained were collated and statistically analyzed.
Results and Discussion
Dietary survey of the respondents Dietary surveys play a crucial role in evaluating the nutritional status of individuals or populations. They offer valuable insights into the quantity and quality of nutrient intake, food sources, dietary habits, and attitudes toward food. In this study, the dietary habits of participants were analyzed based on diet type, meal frequency, and regularity of food consumption.
As shown in Table 1, a significant majority (94.67 per cent) of the surveyed primary school children followed a vegetarian diet, while only 05.33 per cent consumed nonvegetarian foods. To understand the participants' nutrient intake, their food consumption patterns were examined using a structured dietary assessment. Cereals and millets were found to be the dietary staple, forming the foundation of most meals. This aligns with general dietary trends among low-income populations in India and other developing nations, where cereals and millets often contribute 70-80 per cent of the total diet. Table 2 highlights that 100 per cent of the participating children consumed cereals and millets on a daily basis, reflecting their essential role in the diet.
| Food products | Daily (per cent) | Twice a Week (per cent) | Once a Week (per cent) | Monthly (per cent) | Occasionally Or seasonally (per cent) | Never (per cent) |
|---|---|---|---|---|---|---|
| Cereals | 300 (100) | – | – | – | – | – |
| Pulses | 65 (21.70) | 75 (25.00) | 142 (47.30) | 18 (06.00) | – | – |
| Green leafy vegetables | 50 (16.67 ) | 110 (36.67) | 93 (31.00) | 40 (13.33) | 7 (02.33) | – |
| Other vegetables | 48 (16.00) | 126 (42.00) | 90 (30.00) | 34 (11.40) | 02 (0.60) | – |
| Roots and tubers | 145 (48.30) | 98 (32.70) | 45 (15.00) | 11 (3.7) | 01 (0.3) | – |
| Fruits | 12(04.00) | 41 (13.70) | 79 (26.30) | 79 (26.30) | 89 (29.70) | – |
| Milk and milk products | 91 (30.00) | 64 (21.50) | 113 (37.70) | 26 (08.70) | 06 (02.00) | – |
| Fats and oils | 283 (94.50) | 17 (05.50) | – | – | – | – |
| Sugar and confectionary | 153 (51.00) | 83 (27.60) | 64 (21.40) | – | – | – |
| Preserved and processed foods | – | – | 52 (17.30) | 85 (28.30) | 163 (54.30) | – |
| Fast foods | – | – | – | 02 (00.70) | 13 (04.30) | 285 (95.00) |
| Meat and meat products | – | – | – | 09 (03.00) | 32 (10.66) | 259 (86.33) |
| Special foods | – | – | – | 16 (05.33) | 284 (94.67) | – |
Table text extracted from the original PDF; superscript letters are shown inline. The original table image is below.
View original table image
| Food habit | Boys | — | Girls | — | Total | — |
|---|---|---|---|---|---|---|
| f | % | f | % | f | % | |
| Vegetarian | 143 | 94.08 | 141 | 95.27 | 284 | 94.67 |
| Non-vegetarian | 009 | 05.92 | 007 | 04.73 | 016 | 05.33 |
| Total | 152 | 100 | 148 | 100 | 300 | 100.00 |
Table text extracted from the original PDF; superscript letters are shown inline. The original table image is below.
View original table image
Pulses, known for their high protein content (ranging from 19.00 per cent to 24.00 per cent), were also evaluated. They serve as important sources of B-complex vitamins and minerals. However, pulses are generally low in vitamins A, D, B12 and C. Despite these limitations, pulses effectively complement the nutrient profile of cereals when consumed together, making them a vital component of a balanced vegetarian diet. The analysis of pulse consumption, as presented in Table 2, reveals that only 21.7% of the primary school children consumed pulses on a daily basis. A larger proportion-47.3 per cent-reported consuming pulses once a week, while 25.00 included them in their diet twice a week. A small fraction, about 6.00 per cent, consumed pulses only on a monthly basis. These findings are in line with the observations of Garg and Vermani (2014) [5] , who noted that while cereal intake was consistently high, pulse consumption showed a satisfactory pattern across both genders. In the rural setting of this study, children primarily consumed locally available pulses, such as green gram and Bengal gram, reflecting regional dietary practices and availability. [13] , who found that children from higher socio-economic backgrounds consumed more fats and proteins and ate out more frequently. Data from Table 2 also explored the consumption of special or traditional foods like homemade sweets (e.g., laddu, shira, sukhadi). About 94.67 per cent of children and their families consumed such foods occasionally, while 5.33 per cent did so monthly. These foods are often prepared during or special family occasions. The National Nutrition Monitoring Bureau (NNMB, 2012) supports these findings, reporting that Gujarat showed relatively high consumption of cereals, pulses, fats, oils, and dairy products compared to other Indian states. Distribution of the primary school children according to the signs and symptoms Clinical examination is a vital method for assessing the nutritional status of both individuals and communities. It involves identifying physical signs that are commonly associated with nutrient deficiencies. These signs are typically observed in superficial epithelial tissues such as the skin, eyes, and other easily accessible body parts. In this study, clinical assessments were conducted to evaluate the condition of the hair, face, eyes, lips, tongue, teeth, gums, nails, and skin of primary school children. The findings, summarized in Table 3, reveal the presence of various clinical symptoms indicative of nutritional deficiencies. Observations related to hair health showed that 15.7 per cent of the children had thin and sparse hair. Flag sign, a condition where strands of hair show alternate bands of pigmentation, was present in 11.3 per cent. Additionally, 2.3 per cent exhibited a lack of luster in hair, while 1.7 per cent had hair that could be plucked easily-another potential indicator of protein-energy malnutrition. Most children showed normal facial appearance. However, 0.7 per cent exhibited diffuse depigmentation, and 1.7 per cent had a "moon face," which may suggest underlying nutritional or metabolic issues. Vitamin A deficiency was rare, identified in just 0.33 per cent of participants. Signs of xerosis (dryness of the and Bitot's spots-both classic indicators of vitamin A deficiency-were observed in 4 per cent of the children.
| Signs and symptoms | — | f | % |
|---|---|---|---|
| Hair | |||
| i) | Lack of luster | 007 | 02.30 |
| ii) | Thinness and sparseness | 047 | 15.70 |
| iii) | Flag sign | 034 | 11.30 |
| iv) | Easy pluckability | 005 | 01.70 |
| v) | Normal | 207 | 69.00 |
| Face | |||
| i) | Diffuse depigmentation | 002 | 00.70 |
| ii) | Moon face | 005 | 01.70 |
| iii) | Normal | 293 | 97.60 |
| Eyes | |||
| i) | Xerosis | 001 | 00.33 |
| ii) | Bitot’s spot | 012 | 04.00 |
| iii) | Normal | 287 | 95.67 |
| Lips | |||
| i) | Angular scars | 33 | 11.00 |
| ii) | Cheilosis | 39 | 13.00 |
| iii) | Normal | 228 | 76.00 |
| Tongue | |||
| i) | Oedema | 040 | 13.33 |
| ii) | Glossitis | 039 | 13.00 |
| iii) | Normal | 221 | 73.67 |
| Teeth | |||
| i) | Molted enamel | 007 | 02.30 |
| ii) | Caries | 081 | 27.00 |
| iii) | Normal | 212 | 70.70 |
| Gums | |||
| i) | Spongy bleeding gums | 051 | 17.00 |
| ii) | Normal | 249 | 83.00 |
| Nails | |||
| i) | Brittle nails | 006 | 02.00 |
| ii) | Ridged nails | 018 | 06.00 |
| iii) | Spoon shape | 006 | 02.00 |
| iv) | Normal | 270 | 90.00 |
| Skin | |||
| i) | Oedema bilateral | 045 | 15.00 |
| ii) | Pellagrous dermatitis | 038 | 12.67 |
| iii) | Normal | 217 | 72.33 |
Table text extracted from the original PDF; superscript letters are shown inline. The original table image is below.
View original table image
in vitamin B-complex was evident in several participants. Cheilosis (cracks at the corners of the mouth) was present in 13 per cent, and angular scars were seen in 11 per cent. Tongue-related issues included oedema in 13.33 per cent and glossitis (inflammation) in 13 per cent of the children.
Dental assessments showed that 2.3 per cent of the children had mottled enamel, a symptom often associated with fluorosis. Dental caries were observed in 27 per cent of the participants, and 17 per cent showed symptoms of spongy or bleeding gums-indicative of potential vitamin C deficiency or poor oral hygiene. Among nail-related findings, 6 per cent had rigid nails, 2 per cent had brittle nails, and another 2 per cent had spoonshaped nails (koilonychia), which can be a sign of iron deficiency. Skin examinations revealed that 15 per cent of children showed signs of bilateral oedema-a symptom of severe protein deficiency. Pellagrous dermatitis, associated with niacin (vitamin B3) deficiency, was seen in 12.67 per cent of the children. These clinical findings are consistent with those reported in earlier studies by Gopalan (2004) [6] and Bhattacharya et al. (2004) [2] , suggesting a significant prevalence of nutrient deficiencies among school-aged children in rural areas. The frequency pattern of the respondents was not satisfactory and they did not cover all the food groups in their regular diet. The kinds and amount of food eaten are may be affected by the money that can be spent for food stated by Omidvar and Begum (2014) [10] which is the root cause of the current result.
Conclusion
The dietary habits observed among the participants were found to be suboptimal. This may be attributed to unequal distribution of food within households and personal food preferences of the children. To prevent nutritional deficiencies that can hinder both physical and mental development, it is essential to promote improved and balanced dietary practices.
References
16 in the original paper- Basch C, Shea S, Arliss R, Contento I, Rips J, Gutin B. Validation of mothers' reports of dietary intake by fourto seven-year-old children. Am J Public Health. 1990;81:1314.
- Bhattacharya RN, Shrivastava P, Sadhukhan SK, Lahiri SK, Chakravorty M, Soha JBC. A study on visual activity and vitamin A deficiency among primary school students in Naxalari village, Darjeeling district of West Bengal. Indian J Public Health. 2004;48:17180.
- Bowley A. Alliances against hunger. Nutriview. 2008;4:2.
- Donaldson M. Nutrition and cancer: A review of the evidence for an anti-cancer diet. Nutr J. 2004;3(19):140.
- Garg M, Varmani SG. Nutritional health status of north Indian adults. Int J Food Nutr Sci. 2014;3(3):118-21.
- Gopalan C. Micronutrient deficiencies: Public health implications. Indian J Pediatr. 2004;62:157-67.
- Lytle L, Murray D, Perry C, Elridge A. Validating fourth-grade students' self-report of dietary intake: Results from the 5 A Day Power Plus program. J Am Diet Assoc. 1998;98:321-340.
- National Institute of Nutrition (NIN). Dietary guidelines for Indians: A manual. 2 nd ed. Hyderabad: NIN; 2011. p. 32-7.
- National Nutrition Monitoring Bureau (NNMB). Diet and nutritional status of rural population, prevalence of hypertension and diabetes among adults and infant and young child feeding practices. Hyderabad: National Institute of Nutrition, Indian Council of Medical Research; 2012. p. 11-3.
- Omidvar S, Begum K. Dietary pattern, food habits and preferences among adolescent and adult student girls from an urban area, South India. Indian J Fundam Appl Life Sci. 2014;4(2):465-473.
- WHO/FAO. Diet, nutrition and the prevention of chronic diseases. Report of a Joint WHO/FAO Expert Consultation. Geneva: World Health Organisation; 2003. p. 916.
- Swaminathan M. Essentials of food and nutrition. 2nd ed. Bangalore: Bappco Publication; 2003. p. 337-338.
- Swaminathan P, Jeyaranjan R, Sreenivasan, Jayashre K. Tamil Nadu's midday meal scheme: Where assumed benefits score over hard data. Econ Polit Wkly. 2004 Oct 30;39(44):4811-4821.
- United States Department of Agriculture (USDA). Foreign Agricultural Service Report. Washington, DC: USDA; 2014 [cited 2017 Mar 29]. Available from: http://www.fas.usda.gov/regions/south-and-centralasia/india International Journal of Agriculture and Food Science https://www.agriculturaljournals.com
- Vijayaraghavan K. Control of micronutrient deficiencies in India: Obstacles and strategies. Nutr Rev. 2002;60:S73.
- Westenhoefer J. Establishing dietary habits during childhood for long-term weight control. Ann Nutr Metab. 2002;46 Suppl 1:18-23.