
Research article · 2025 · Full text
International Journal of Agriculture and Food ScienceMorphological characterization and quantitative genetic analysis of sugarcane (Saccharum spp) germplasm
Volume 7(9) · Pages 117–120 · DOI: 10.33545/2664844x.2025.v7.i9b.738 ↗
Research areasSugarcane Cultivation and ProcessingNatural Products and Biological Research
Abstract
Author-writtenThe present study was conducted using 100 sugarcane genotypes in 2023-2024 in an Augmented Block Design-II at the Research farm, Main Sugarcane Research Centre, NAU, Navsari. The objective was to estimation of genetic parameters. Based on overall mean performance, genotype 2021 N 144 was identified as best clone exhibiting superior performance over the best standard for juice brix %, purity %, sucrose % and CCS %. Similarly, 2021 N 157 exhibited superior performance for number of tillers at 120 DAS, number of millable canes, stalk length and CCS (t/ha). Therefore, 2021 N 144 identified as best performer for juice quality characters and 2021 N 164 for cane yield contributing characters. Moderate variability, high heritability and moderate to high genetic advance as percent of mean were recorded for number of tillers at 120 DAS, number of shoots at 240 DAS, number of millable canes, stalk length, cane diameter, CCS %, CCS (t/ha), and cane yield.
Summary
Source-checkedPlain-language reading of the full paper, prepared with AI and checked against the text. Each point links to the authors' own words.
Why it matters
- Sugarcane is a critical global cash crop used for sucrose storage and the production of ethanol, a renewable bio-fuel. View evidence ↗
- Sugarcane is a primary source of commercial sugar, providing nearly two-thirds of the world's total production. View evidence ↗
- India holds a dominant position in the industry as the world's largest producer and consumer of sugar and the second largest producer of sugarcane. View evidence ↗
The question
- The study aimed to estimate the genetic parameters of sugarcane genotypes. View evidence ↗
What they did
- The research evaluated 100 sugarcane genotypes during 2023-2024 using an Augmented Block Design-II at the NAU Research farm in Navsari. View evidence ↗
- Researchers measured 13 different characters, selecting ten random plants per plot for most morphological observations, while germination percentage at 45 DAS was measured across the net crop area. View evidence ↗
What they found
- Genotype 2021 N 144 was the top performer for juice quality, surpassing the best standard in brix %, purity %, sucrose %, and CCS %. View evidence ↗
- Genotype 2021 N 157 showed superior results for yield-contributing traits, including stalk length, number of millable canes, number of tillers at 120 DAS, and CCS (t/ha). View evidence ↗
- Single cane weight varied across genotypes, with a minimum of 0.74 kg in 2021 N 115 and a maximum of 1.34 kg in 2021 N 49. View evidence ↗
- Commercial cane sugar (CCS) yield ranged from 7.26 t/ha in genotype 2021 N 216 to 20.63 t/ha in 2021 N 105. View evidence ↗
- Cane yield exhibited significant variation, ranging from 67.58 t/ha (2021 N 115) to 143.16 t/ha (2020 N 164). View evidence ↗
- Cane yield, cane diameter, and CCS (t/ha) showed high heritability in the broad sense combined with high genetic advance. View evidence ↗
- Traits such as stalk length, number of shoots, number of tillers, number of millable canes, and CCS % showed moderate GCV/PCV and high heritability, suggesting additive gene action. View evidence ↗
What it means
- The authors concluded that 2021 N 144 is the best performer for juice quality, while 2021 N 157 is the best for yield-contributing characters. View evidence ↗
- The authors state that because certain characters are governed by additive gene effects, simple selection will be effective for improving them in future generations. View evidence ↗
- For traits with low to moderate variability, the authors suggest that further hybridization and indirect selection through correlated traits are necessary to create more variability. View evidence ↗
Visual summary
1 visualsIllustrations explain the paper; charts are replotted from the paper's own table values.
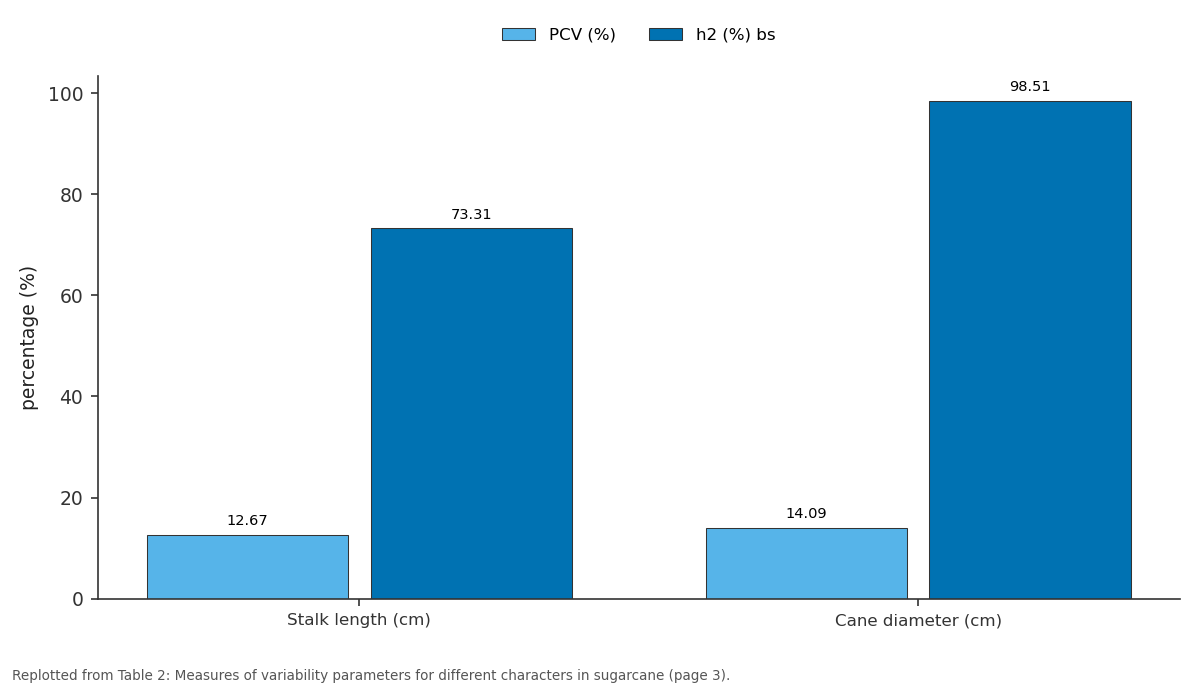
PCV (%) and h2 (%) bs: Stalk length (cm) vs Cane diameter (cm)
Replotted from Table 2 (page 3) of the original paper. Every bar is the paper's own table value.
View source evidence ↗Figures & tables
From the original paper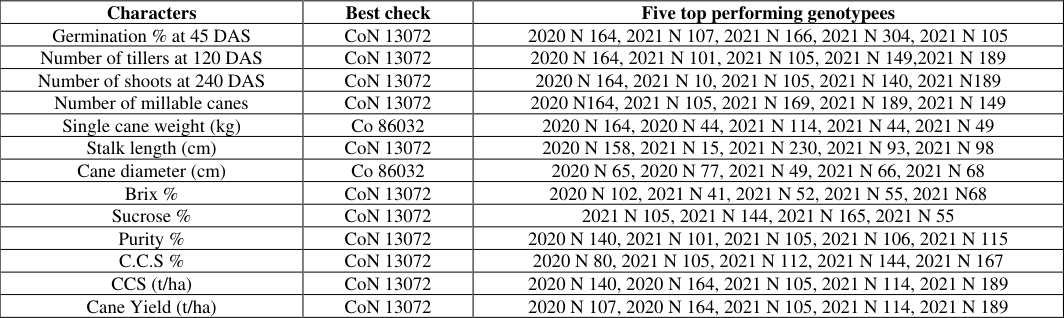 Table 1
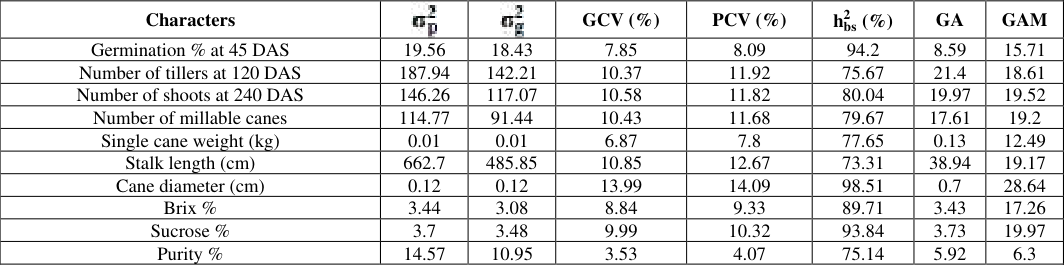 Table 2
Introduction
Sugarcane is one of the important cash crops which is cultivated in tropical and sub-tropical regions of the world. It is valuable because it stores high concentration of sucrose in the stem and more recently for the production of an important renewable bio-fuel, ethanol (Sharma and Tamta, 2015) [1] . Globally, sugarcane is an important source of commercial sugar, accounting for almost two-thirds of worlds sugar production (Menossi et al., 2008) [2] . India is the second largest producer of sugarcane and is the largest producer and consumer of sugar in the world. A significant portion of the canes are also crushed for the extraction of juice for domestic consumption, and about 10 % of the canes are used as seed for planting new crops (Viswanathan, 2012) [3] . The term Saccharum is derived from the Sanskrit word 'sarkara' or 'sakkara,' which means sugar, this transformed into 'Sukkar' in Arabic and 'Sakharon' in Greek. Sugarcane is a monocotyledon and belongs to the genus Saccharum of tribe Andropogoneae, sub-tribe Saccharineae in family Poaceae. The genus Saccharum consists of 6 to 37 species depending on taxonomic interpretation and the members are of tall grasses, native to warm temperate to tropical regions of South and South East Asia. Sugarcane has thick, jointed and fibrous stalks of 2 to 6 metres tall that store sugar. There are three cultivated species of sugarcane namely Saccharum officinarum (noble cane, 2n=80), Saccharum barberi (2n = 82-124), Saccharum sinense (2n = 111-120) and three wild species namely Saccharum spontaneum (2n = 40-128), Saccharum robustum (2n = 60-194) and Saccharum edule (2n = 60-80) (Gupta et al., 2010). Saccharum species complex is widely cultivated in India after nobilization because of high sucrose content and adaptability to adverse environmental conditions. Sugarcane contributes approximately 80% of the global sugar requirement; sugar beet meets the remainder. Brazil, India, Thailand, China, the USA, Mexico, Pakistan, Australia and Guatemala are the major sugarcane-producing countries (http://www.fao.org/faostat/en). The major sugarcane producing states in India are Uttar Pradesh, Maharashtra, Karnataka, Tamil Nadu, Bihar and Andhra Pradesh etc. It is the second most important agro-industrial crop in India, next only to cotton (Jayashree et al., 2010) [5] . In India, sugarcane is grown in 5.2 Mha area, which is approximately 3.0% of the total cultivable area in the country, and it contributes 7.5% gross value of agricultural production (https:// indiansugar.com/Statics.aspx). With additional backcrossing with Saccharum officinarum, modern sugarcane hybrids they originated from interspecific crosses between the wild, thin-stalked, low-sugar Saccharum spontaneum and the thick-stalked, high-sugar Saccharum officinarum. In addition to improving the present farmed sugarcane hybrids' vigor, robustness, tillering, disease resistance, and environmental adaptability, this complicated hybridization process increased the genome's complexity beyond that of their ancestors. Hybrids might have between 100 and 130 chromosomes, depending on the particular cross. Depending on the specific cross, hybrids might have between 100 and 130 chromosomes. Around 70-80% of these chromosomes come from S. officinarum, 10-20% from S. spontaneum, and 10% are the product of interspecific recombination. (Bao et al. 2024) [6] .
Materials and Methods
Total 100 genotypes were used in the study including 3 checks. The genotypes were of 2020 N series and from 2021 N series. Total 13 characters were studied. Ten plants from each plot were randomly selected for all the morphological observations except for character such as germination % at 45 DAS which were recorded from net area of the standing crop in all the accessions. All the remaining observations were recorded from plants in the field at an appropriate time. Quantitative parameters were recorded during the last week of December. The mean values of each observation obtained from the selected ten plants were used for statistical analysis. Seed yield was taken from the net plot area. The observations were recorded for 13 traits. Out of which six are agro-morphological viz., germination % at 45 DAS, number of tillers at 120 DAS, number of shoots at 240 DAS, single cane weight (kg), stalk length (cm), and cane diameter (cm). This study also included brix %, sucrose % and purity % which are quality parameters. Number of Millable Canes (N.M.C), C.C.S %, cane yield (t/ha) and CCS (t/ha) are the traits associated with yield.
Results and Discussion
To assess the performance and genetic diversity of sugarcane genotypes under evaluation, this design enabled efficient comparison among 97 unreplicated test entries using three replicated checks across six blocks. The analysis yielded insights into both raw trait performance and into stability and potential of genotypes for further selection. List of top performing genotypes over best check is given in Table 1. The mean values of 97 genotypes and 3 checks for various quantitative and qualitative traits in sugarcane is given in supplementary table. 1.
| Characters | Best check | Five top performing genotypees |
|---|---|---|
| Germination % at 45 DAS | CoN 13072 | 2020 N 164, 2021 N 107, 2021 N 166, 2021 N 304, 2021 N 105 |
| Number of tillers at 120 DAS | CoN 13072 | 2020 N 164, 2021 N 101, 2021 N 105, 2021 N 149,2021 N 189 |
| Number of shoots at 240 DAS | CoN 13072 | 2020 N 164, 2021 N 10, 2021 N 105, 2021 N 140, 2021 N189 |
| Number of millable canes | CoN 13072 | 2020 N164, 2021 N 105, 2021 N 169, 2021 N 189, 2021 N 149 |
| Single cane weight (kg) | Co 86032 | 2020 N 164, 2020 N 44, 2021 N 114, 2021 N 44, 2021 N 49 |
| Stalk length (cm) | CoN 13072 | 2020 N 158, 2021 N 15, 2021 N 230, 2021 N 93, 2021 N 98 |
| Cane diameter (cm) | Co 86032 | 2020 N 65, 2020 N 77, 2021 N 49, 2021 N 66, 2021 N 68 |
| Brix % | CoN 13072 | 2020 N 102, 2021 N 41, 2021 N 52, 2021 N 55, 2021 N68 |
| Sucrose % | CoN 13072 | 2021 N 105, 2021 N 144, 2021 N 165, 2021 N 55 |
| Purity % | CoN 13072 | 2020 N 140, 2021 N 101, 2021 N 105, 2021 N 106, 2021 N 115 |
| C.C.S % | CoN 13072 | 2020 N 80, 2021 N 105, 2021 N 112, 2021 N 144, 2021 N 167 |
| CCS (t/ha) | CoN 13072 | 2020 N 140, 2020 N 164, 2021 N 105, 2021 N 114, 2021 N 189 |
| Cane Yield (t/ha) | CoN 13072 | 2020 N 107, 2020 N 164, 2021 N 105, 2021 N 114, 2021 N 189 |
Table text extracted from the original PDF; superscript letters are shown inline. The original table image is below.
View original table image
Germination % at 45 DAS
Germination % at 45 DAS
Stalk length among the genotypes exhibited substantial variability, ranging from 147.05 cm (2021 N 97) to 257.05 cm (2021 N 98). Five genotypes surpassed CoN 13072, the best check variety for stalk length.
In this study, the narrowest cane is 2021 N 165 with the diameter of 1.77 cm. The widest cane was observed in genotype 2020 N 77, which stood out significantly with a diameter of 4.66 cm. The narrow gap between genotypes also indicates strong genetic control and limited environmental interference. Thirty-one genotypes had a larger average diameter than the best check Co 86032, which is vital for cane volume and juice content.
Sucrose %
In the present study, sucrose % varied from 14.25 % (2020 N 2) to 21.89 % (2021 N 144), with a mean value of 18.66 % and a coefficient of variation of 2.57%. Twenty-four test entries surpassed the sucrose content of CoN 13072.
Purity %
Purity ranged from 80.23 % (2021 N 41) to 99.58 % (2021 N 101), with a mean of 93.86 % and a CV of 2.03%, suggesting high trait stability and minimal environmental influence. High purity is critical for efficient sugar recovery and processing economy, as it signifies a lower proportion of non-sugar impurities in the juice. With a remarkable 50 genotypes outperforming CoN 13072 which is the best check in juice purity, this trait showed strong improvement potential.
C.C.S %
In the present evaluation, CCS % ranged from 9.64 % (2021 N 230) to 16.24 % (2021 N 105), A total of 27 test clones recorded higher CCS% than CoN 13072, pointing to genetic enhancement in sugar recovery.
Commercial cane sugar (t/ha) is a vital economic trait that directly reflects the total sugar yield obtained per unit area. In the present study, commercial cane sugar (t/ha) ranged from 7.26 t/ha (2021 N 216) to 20.63 t/ha (2021 N 105). Eight clones surpassed CoN 13072 in CCS (t/ha).
In the present study, cane yield showed a wide range from 67.58 t/ha (2021 N 115) to 143.16 t/ha (2020 N 164). Eighteen test entries outperformed the check CoN 13072 in total cane yield, a key productivity indicator.
Estimation of Genetic Variability, Heritability and Genetic Advance
A critical persual of PCV and GCV indicated that, PCV estimates were higher than GCV for all the characters and the closeness between GCV and PCV values for almost all the characters except stalk length and CCS (t/ha) indicated that these characters are less influenced by the environment. Moderate values of both PCV and GCV were observed for all the traits except for germination at 45 DAS, single cane weight, brix, per cent and purity percent. Moderate PCV and low GCV was recorded for sucrose per cent. Lower values of PCV and GCV of these traits indicates the presence of limited amount of genetic variability for these traits in the population. The high heritability in broad sense with high genetic advance was recorded for cane yield, CCS (t/ha), and cane diameter. It indicated that most likely these characters are governed by the additive gene effects and selection for these characters will be effective for improvement in successive generations. As heritability in broad sense is high it also indicated that these characters are least influenced by the environmental effects. Moderate GCV, PCV along with high h 2 b and GAM were recorded for cane yield, CCS (t/ha), and cane diameter indicates wider range of variability in the material and importance of additive gene action in the inheritance of these characters in sugarcane. Moderate estimates of GCV and PCV coupled with high estimates of heritability in broad sense and moderate genetic advance over mean recorded for number of tillers, number of shoots, number of millable canes, stalk length, and CCS per cent also indicated the importance of additive gene action in the inheritance of this character. These characters can be improved through simple selection. All the remaining traits have low to moderate PCV, GCV coupled with high heritability yet moderate genetic advance as percent of mean. Therefore, it is needed to go for indirect selection through more heritable and variable correlated traits and further hybridization to create the variability for these characters. Measures of variability parameters for different characters in sugarcane are given in table 2.
| Characters | — | — | GCV (%) | PCV (%) | h2 (%) bs | GA | GAM |
|---|---|---|---|---|---|---|---|
| Germination % at 45 DAS | 19.56 | 18.43 | 7.85 | 8.09 | 94.2 | 8.59 | 15.71 |
| Number of tillers at 120 DAS | 187.94 | 142.21 | 10.37 | 11.92 | 75.67 | 21.4 | 18.61 |
| Number of shoots at 240 DAS | 146.26 | 117.07 | 10.58 | 11.82 | 80.04 | 19.97 | 19.52 |
| Number of millable canes | 114.77 | 91.44 | 10.43 | 11.68 | 79.67 | 17.61 | 19.2 |
| Single cane weight (kg) | 0.01 | 0.01 | 6.87 | 7.8 | 77.65 | 0.13 | 12.49 |
| Stalk length (cm) | 662.7 | 485.85 | 10.85 | 12.67 | 73.31 | 38.94 | 19.17 |
| Cane diameter (cm) | 0.12 | 0.12 | 13.99 | 14.09 | 98.51 | 0.7 | 28.64 |
| Brix % | 3.44 | 3.08 | 8.84 | 9.33 | 89.71 | 3.43 | 17.26 |
| Sucrose % | 3.7 | 3.48 | 9.99 | 10.32 | 93.84 | 3.73 | 19.97 |
| Purity % | 14.57 | 10.95 | 3.53 | 4.07 | 75.14 | 5.92 | 6.3 |
Table text extracted from the original PDF; superscript letters are shown inline. The original table image is below.
View original table image
Conclusion
Based on overall mean performance, genotype 2021 N 144 was identified as best clone exhibiting superior performance over the best standard for juice brix %, purity %, sucrose % and CCS %. Similarly, 2021 N 164 exhibited superior performance for number of tillers at 120 DAS, number of millable canes, stalk length and CCS (t/ha). Therefore, 2021 N 144 identified as best performer for juice quality characters and 2021 N 157 for cane yield contributing characters. The estimates of variability parameters revealed moderate GCV, PCV along with high h 2 bs and GAM were recorded for cane yield, CCS (t/ha), and cane diameter indicates wider range of variability in the material and importance of additive gene action in the inheritance of these characters in sugarcane. Moderate estimates of GCV and PCV coupled with high estimates of heritability in broad sense and moderate genetic advance as percent of mean recorded for number of tillers at 120 DAS, number of shoots, number of millable canes, stalk length, and CCS % also indicated the importance of additive gene action in the inheritance of this character.
References
6 in the original paper- Sharma R, Tamta S. A review on red rot: the cancer of sugarcane. J Plant Pathol Microbiol. 2015;1(003).
- Menossi M, Silva-Filho MD, Vincentz M, Van-Sluys MA, Souza GM. Sugarcane functional genomics: gene discovery for agronomic trait development. International journal of plant genomics. 2008;2008(1):458732.
- Viswanathan R. Molecular basis of red rot resistance in sugarcane. Functional Plant Science and Biotechnology. 2012;6(2):40-50.
- Gupta V, Raghuvanshi S, Gupta A, Saini N, Gaur A, Khan MS, et al. The water-deficit stress-and red-rotrelated genes in sugarcane. Functional & integrative genomics. 2010 May;10(2):207-14.
- Jayashree J, Selvi A, Nair NV. Characterization of resistance gene analog polymorphisms in sugarcane cultivars with varying levels of red rot resistance. Electronic Journal of Plant Breeding. 2010;1(4):1191-9.
- Bao Y, Zhang Q, Huang J, Zhang S, Yao W, Yu Z, et al. A chromosomal-scale genome assembly of modern cultivated hybrid sugarcane provides insights into origination and evolution. Nature Communications. 2024 Apr 8;15(1):3041.