
Research article · 2025 · Full text
International Journal of Agriculture and Food ScienceA comparative study of personality traits across gender and location in the IT sector
Volume 7(9) · Pages 112–116 · DOI: 10.33545/2664844x.2025.v7.i9b.737 ↗
Research areasAI and HR TechnologiesTechnology Adoption and User Behaviour
Abstract
Author-writtenPersonality traits play a central role in shaping workplace behavior, adaptability, and performance. Guided by the Five-Factor Model (FFM), the present study examined the distribution of personality traits among information technology (IT) employees, with a focus on gender- and location-based differences. Data were collected from 60 IT professionals working in Bengaluru and Lucknow using the Big Five Personality Inventory (BFI short version). Descriptive statistics and independent-samples t-tests were employed for analysis. Results indicated that the majority of participants were moderate extroverts (70%), suggesting balanced sociability and assertiveness. Gender-based comparisons revealed significant differences in emotional stability and openness to experience, with males scoring higher on both dimensions. No significant gender differences were observed for extraversion, conscientiousness, or agreeableness. Location-based analyses showed no significant differences across any of the five traits, indicating broadly similar personality profiles among IT employees in Bengaluru and Lucknow. These findings suggest that while gender influences certain personality dimensions, regional variations within urban IT sectors are less pronounced. The study contributes to literature on personality and occupational behavior, highlighting implications for organizational practices such as team composition, employee well-being, and talent management. Future research with larger and more diverse samples is recommended to explore broader demographic influences on personality expression in professional contexts.
Summary
Source-checkedPlain-language reading of the full paper, prepared with AI and checked against the text. Each point links to the authors' own words.
Why it matters
- Personality traits are fundamental in determining how employees behave, adapt, and perform within a professional environment. View evidence ↗
- The Five-Factor Model (FFM), or the Big Five, is a standard framework used to analyze personality across different occupations and cultures. View evidence ↗
- Understanding personality traits in the IT sector is particularly important due to the industry's rapid growth and its focus on innovation, teamwork, and adaptability. View evidence ↗
The question
- The study aims to analyze how personality traits are distributed among IT employees, specifically looking for differences based on gender and location (Bengaluru vs. Lucknow). View evidence ↗
What they did
- The study included a sample of 60 IT professionals, with representation across various ages, genders, and job designations. View evidence ↗
- Researchers used the short version of the Big Five Personality Inventory (BFI) to measure the five core personality dimensions. View evidence ↗
- Purposive sampling was used to target specific IT roles, including analysts, engineers, managers, consultants, and specialists. View evidence ↗
- The data were analyzed using descriptive statistics and independent-samples t-tests. View evidence ↗
What they found
- Most participants (70.0%) were moderate extroverts, while 26.7% were highly extroverted and 3.3% were ambiverts. View evidence ↗
- Males scored significantly higher in emotional stability than females (Mean 12.17 vs 11.80, p = .025). View evidence ↗
- Males scored significantly higher in openness to experience compared to females (Mean 14.80 vs 12.97, p = .048). View evidence ↗
- No significant gender difference was found for extraversion (p = .499). View evidence ↗
- No significant gender difference was found for agreeableness (p = .092). View evidence ↗
- There were no significant differences in any of the Big Five personality traits between IT employees in Bengaluru and Lucknow. View evidence ↗
What it means
- The authors conclude that while gender influences certain personality traits, regional differences are less significant among urban IT professionals. View evidence ↗
- The authors suggest that future research should use larger samples, include rural and semi-urban employees, and use longitudinal designs. View evidence ↗
Visual summary
3 visualsIllustrations explain the paper; charts are replotted from the paper's own table values.

Gender Differences in Big Five Traits
AI-generated conceptual illustration (Male and female human silhouettes). It explains the idea and does not show study data.
View source evidence ↗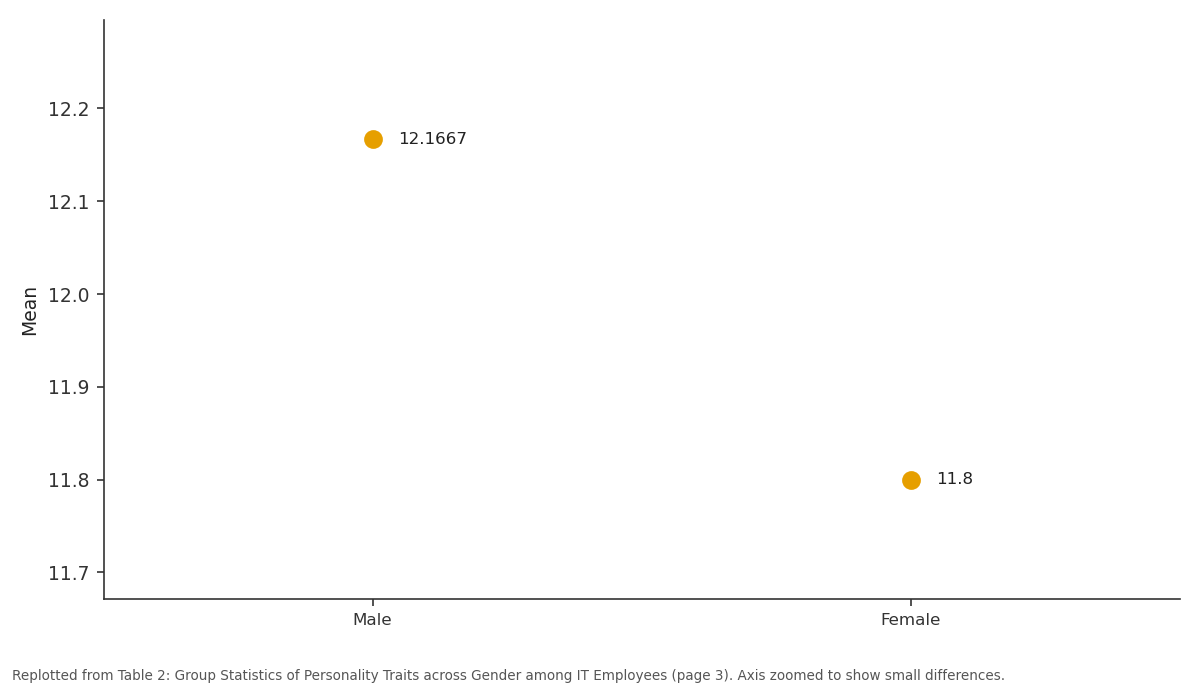
Mean: Male vs Female
Replotted from Table 2 (page 3) of the original paper. Every bar is the paper's own table value.
View source evidence ↗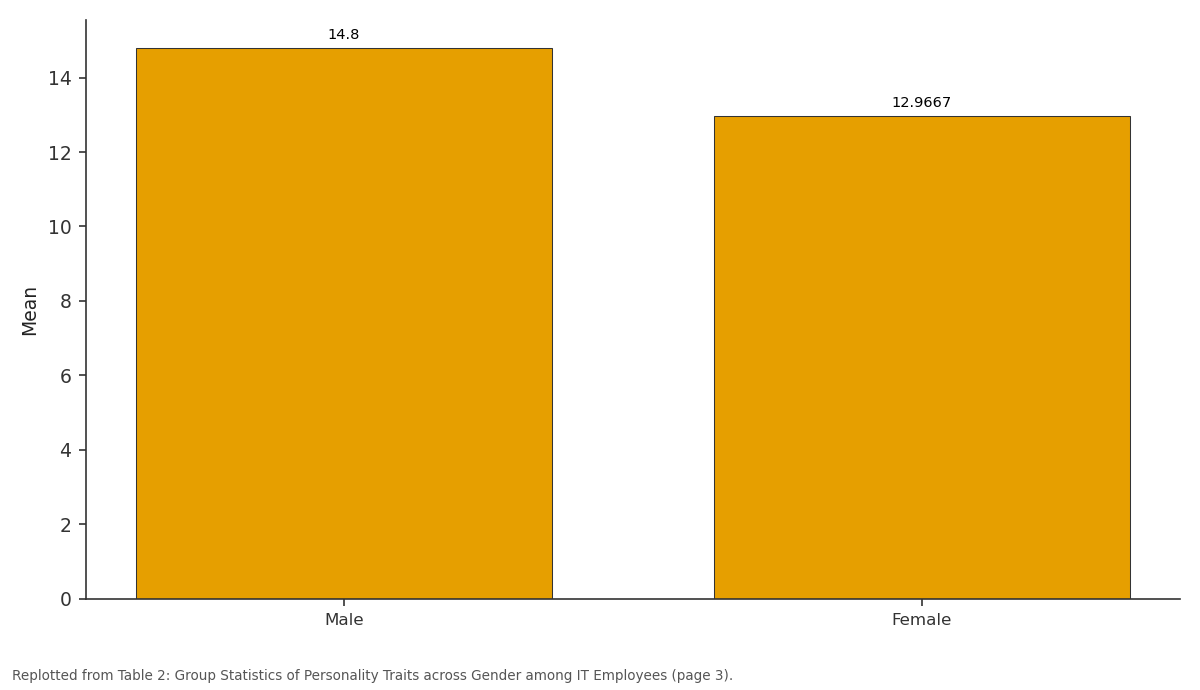
Mean: Male vs Female
Replotted from Table 2 (page 3) of the original paper. Every bar is the paper's own table value.
View source evidence ↗Figures & tables
From the original paper Table 1
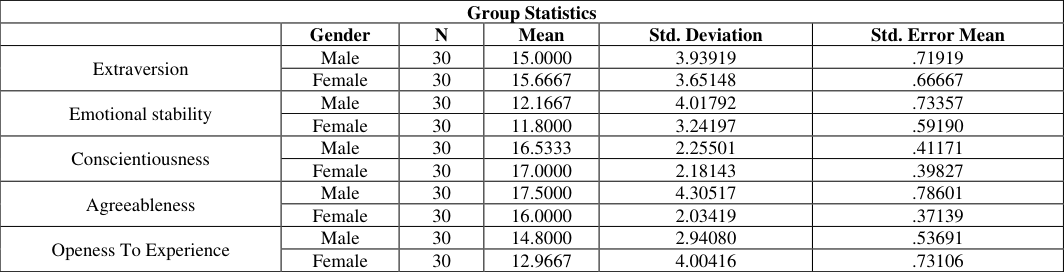 Table 2
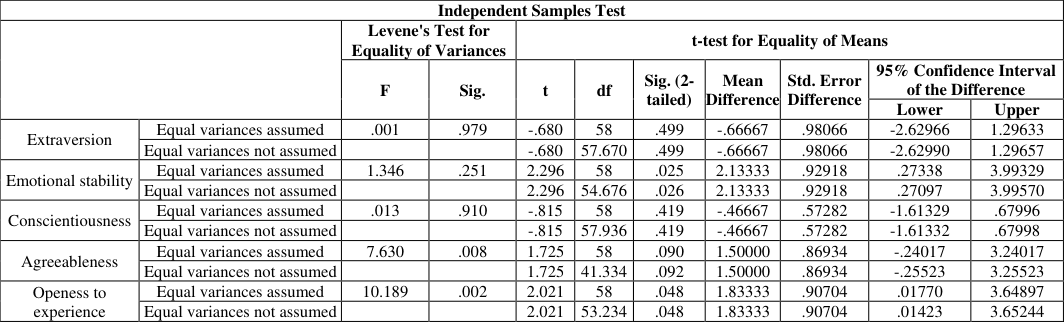 Table 2
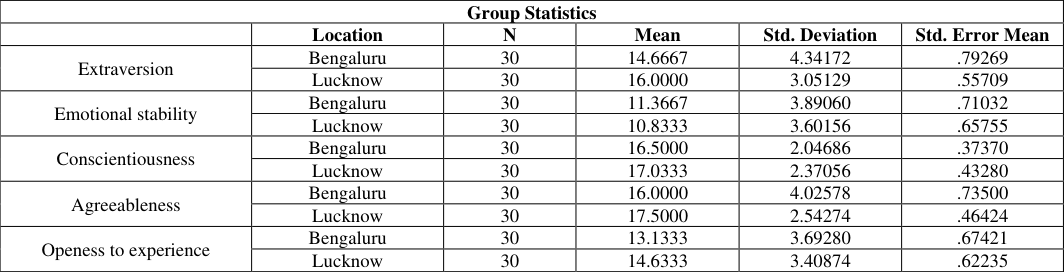 Table 3
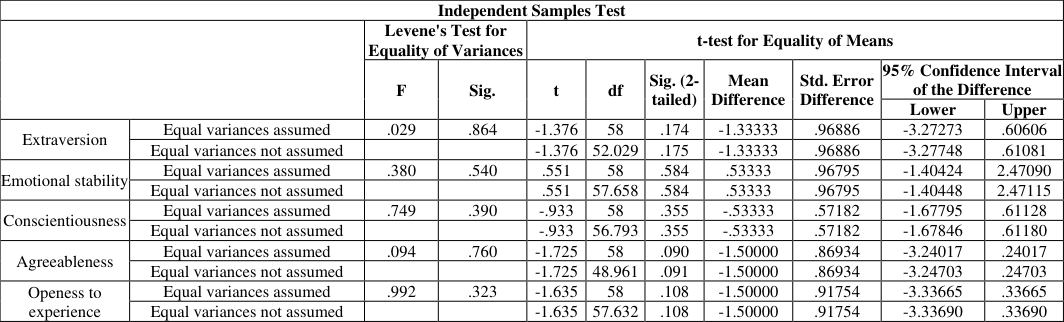 Table 3
Introduction
Personality traits play a crucial role in shaping individual behavior, interpersonal interactions, and workplace effectiveness. The Five-Factor Model (FFM), commonly known as the Big Five personality traits-extraversion, emotional stability, conscientiousness, agreeableness, and openness to experience-provides a widely accepted framework for examining personality across cultures and occupational groups (McCrae & Costa, 2008) [5] . Within organizational settings, these traits have been linked to job performance, adaptability, and overall well-being (Barrick & Mount, 1991; Judge & Zapata, 2015) [1,9] . Extraversion, in particular, has been consistently identified as a socially relevant trait, influencing sociability, assertiveness, and energy levels. Prior studies highlight that most individuals fall within moderate levels of extraversion rather than at extreme ends, suggesting adaptive advantages for balanced social engagement (Grant et al., 2011; Soto, 2019) [7,13] . Other traits such as conscientiousness and agreeableness contribute to cooperative workplace behaviors, while emotional stability is often associated with resilience and lower stress reactivity (Schmitt et al., 2008) [6] . Openness to experience, on the other hand, reflects creativity, curiosity, and adaptability to novel contexts (Weisberg, DeYoung, & Hirsh, 2011) [8] . Research has also emphasized the influence of demographic variables such as gender and location on personality expression. Gender-based differences have been reported across cultures, with findings often indicating that women tend to score higher on agreeableness and neuroticism, while men sometimes report higher emotional stability and openness (Feingold, 1994; Schmitt et al., 2017) [2,12] . Similarly, regional variations, though less pronounced than cross-cultural differences, may emerge due to environmental, cultural, and socioeconomic factors (Rentfrow, Jokela, & Lamb, 2015) [10] .
In the context of India, studies suggest that despite cultural and linguistic diversity, personality traits remain relatively consistent across regions, particularly within urban populations (McCrae et al., 2008; Chopra, 2016) [5,11] . However, given the rapid growth of the information technology (IT) sector and its emphasis on adaptability, teamwork, and innovation, understanding personality traits among IT employees is increasingly relevant. The present study therefore aims to examine the distribution of personality traits among IT employees, with a particular focus on differences across gender and location (Bengaluru and Lucknow). By exploring these dimensions, the study seeks to contribute to the growing literature on personality and workplace dynamics while offering insights into how demographic factors shape the expression of the Big Five traits in professional contexts.
Objectives of the Study
Based on the review of literature and the scope of the present research, the study was guided by the following objectives:
Data Collection Procedure
Permission was sought from respective organizations and individual participants before data collection. The questionnaires were distributed in both online and offline formats to ensure convenience for participants. Respondents were briefed about the objectives of the study, the voluntary nature of their participation, and confidentiality of their responses. A frequency analysis was conducted to assess the distribution of participants based on their levels of extraversion (Table 1). Results showed that the majority of participants were classified as moderate extroverts (70.0%), followed by highly extroverts (26.7%), while only a small proportion were identified as ambiverts (3.3%). This indicates that most participants in the sample demonstrated a moderate level of extraversion, with relatively few falling into the ambivert category. These findings are supported by previous research on personality distribution within populations. For instance, McCrae and Costa (2008) [5] noted that extraversion is typically expressed on a continuum, with the majority of individuals falling in the middle rather than at the extreme ends. Similarly, Grant et al. (2011) [7] observed that ambiverts, while effective in adaptive social and occupational behaviors, represent a relatively small portion of the population compared to those with moderate levels of extraversion. More recently, Soto (2019) [13] highlighted that moderate extraversion is common across cultures, suggesting that while some individuals exhibit strong sociability and assertiveness, most balance these traits with periods of reservation.
| Personality | — | — | — | — |
|---|---|---|---|---|
| Frequency | Percent | Valid Percent | Cumulative Percent | |
| Highly extrovert | 16 | 26.7 | 26.7 | 26.7 |
| Moderate extrovert | 42 | 70.0 | 70.0 | 96.7 |
| Ambivert | 2 | 3.3 | 3.3 | 100.0 |
| Total | 60 | 100.0 | 100.0 |
Table text extracted from the original PDF; superscript letters are shown inline. The original table image is below.
View original table image
Result and Discussion
Taken together, the present findings align with existing literature indicating that personality traits such as extraversion are normally distributed in populations, with extreme categories (i.e., highly extrovert or ambivert) being less frequent. This distribution also reflects the adaptive advantage of moderate extraversion, which may allow individuals to flexibly navigate social and personal contexts without the limitations of extreme outgoingness or introversion.
The results of the present study revealed both significant and non-significant gender differences across personality traits. For Extraversion and Conscientiousness, no significant differences were observed between males and females, suggesting that both genders demonstrated comparable levels of sociability and diligence. This finding aligns with Costa, Terracciano, and McCrae (2001), who found that gender differences in Extraversion and Conscientiousness are often minimal or inconsistent across cultures.
In contrast, significant gender differences were observed in Emotional Stability and Openness to Experience. Males scored higher in Emotional Stability, indicating lower levels of neurotic tendencies compared to females. This aligns with prior research demonstrating that women often report higher neuroticism and lower emotional stability, which has been attributed to both biological predispositions and greater exposure to stressors (Schmitt et al., 2008) [6] . Similarly, findings on Openness to Experience revealed that males scored significantly higher than females. Some crosscultural studies have reported comparable results, suggesting that men may be more inclined toward noveltyseeking and intellectual exploration, whereas women may express openness differently through aesthetic and interpersonal domains (Weisberg, DeYoung, & Hirsh, 2011) [8] . Interestingly, no significant gender differences emerged in Agreeableness, despite prior meta-analyses often reporting that women score higher in this trait (Feingold, 1994; Schmitt et al., 2017) [2,12] . The nonsignificant result in this sample may reflect contextual or cultural influences, as personality traits are shaped not only by biological factors but also by social expectations and environmental demands. Taken together, these findings suggest that while some personality traits (e.g., Extraversion and Conscientiousness) show little gender differentiation, others (Emotional Stability and Openness to Experience) reflect more robust gender-based variations. These results contribute to the broader literature on gender differences in personality by highlighting both universal trends and potential cultural nuances. Independent-samples t-tests were conducted to examine differences in personality traits between participants from Bengaluru and Lucknow (Table . 3 and Table 3.1). For Extraversion, no significant difference was found between Bengaluru (M = 14.67, SD = 4.34) and Lucknow (M = 16.00, SD = 3.05), t(58) = -1.38, p =.174. Similarly, no significant difference emerged for Emotional Stability, with Bengaluru (M = 11.37, SD = 3.89) and Lucknow (M = 10.83, SD = 3.60), t(58) = 0.55, p =.584. For Conscientiousness, participants from Bengaluru (M = 16.50, SD = 2.05) and Lucknow (M = 17.03, SD = 2.37) did not differ significantly, t(58) = -0.93, p =.355. Likewise, no significant differences were found for Agreeableness, Bengaluru (M = 16.00, SD = 4.03) and Lucknow (M = 17.50, SD = 2.54), t(58) = -1.73, p =.090. Finally, for Openness to Experience, scores did not differ significantly between Bengaluru (M = 13.13, SD = 3.69) and Lucknow (M = 14.63, SD = 3.41), t(58) = -1.64, p =.108. The present study examined whether personality traits differed between participants from Bengaluru and Lucknow.
| Independent Samples Test | — | — | — | — | — | — | — | — | — | — |
|---|---|---|---|---|---|---|---|---|---|---|
| Levene's Test for Equality of Variances | t-test for Equality of Means | |||||||||
| F | Sig. | t | df | Sig. (2- tailed) | Mean Difference | Std. Error Difference | 95% Confidence Interval of the Difference | |||
| Lower | Upper | |||||||||
| Extraversion | Equal variances assumed | .029 | .864 | -1.376 | 58 | .174 | -1.33333 | .96886 | -3.27273 | .60606 |
| Equal variances not assumed | -1.376 | 52.029 | .175 | -1.33333 | .96886 | -3.27748 | .61081 | |||
| Emotional stability | Equal variances assumed | .380 | .540 | .551 | 58 | .584 | .53333 | .96795 | -1.40424 | 2.47090 |
| Equal variances not assumed | .551 | 57.658 | .584 | .53333 | .96795 | -1.40448 | 2.47115 | |||
| Conscientiousness | Equal variances assumed | .749 | .390 | -.933 | 58 | .355 | -.53333 | .57182 | -1.67795 | .61128 |
| Equal variances not assumed | -.933 | 56.793 | .355 | -.53333 | .57182 | -1.67846 | .61180 | |||
| Agreeableness | Equal variances assumed | .094 | .760 | -1.725 | 58 | .090 | -1.50000 | .86934 | -3.24017 | .24017 |
| Equal variances not assumed | -1.725 | 48.961 | .091 | -1.50000 | .86934 | -3.24703 | .24703 | |||
| Openess to experience | Equal variances assumed | .992 | .323 | -1.635 | 58 | .108 | -1.50000 | .91754 | -3.33665 | .33665 |
| Equal variances not assumed | -1.635 | 57.632 | .108 | -1.50000 | .91754 | -3.33690 | .33690 |
Table text extracted from the original PDF; superscript letters are shown inline. The original table image is below.
View original table image
| Group Statistics | — | — | — | — | — |
|---|---|---|---|---|---|
| Location | N | Mean | Std. Deviation | Std. Error Mean | |
| Extraversion | Bengaluru | 30 | 14.6667 | 4.34172 | .79269 |
| Lucknow | 30 | 16.0000 | 3.05129 | .55709 | |
| Emotional stability | Bengaluru | 30 | 11.3667 | 3.89060 | .71032 |
| Lucknow | 30 | 10.8333 | 3.60156 | .65755 | |
| Conscientiousness | Bengaluru | 30 | 16.5000 | 2.04686 | .37370 |
| Lucknow | 30 | 17.0333 | 2.37056 | .43280 | |
| Agreeableness | Bengaluru | 30 | 16.0000 | 4.02578 | .73500 |
| Lucknow | 30 | 17.5000 | 2.54274 | .46424 | |
| Openess to experience | Bengaluru | 30 | 13.1333 | 3.69280 | .67421 |
| Lucknow | 30 | 14.6333 | 3.40874 | .62235 |
Table text extracted from the original PDF; superscript letters are shown inline. The original table image is below.
View original table image
Results indicated no significant differences across the Big Five personality dimensions, including Extraversion, Emotional Stability, Conscientiousness, Agreeableness, and Openness to Experience. These findings suggest that despite potential cultural, linguistic, and lifestyle differences between the two cities, participants demonstrated broadly similar personality profiles. This outcome is consistent with previous research showing that while regional differences in personality can exist, they are often subtle and less pronounced than gender or cultural variations at the national level (Rentfrow, Jokela, & Lamb, 2015) [10] . For example, Rentfrow et al. (2008) found that regional clustering of personality traits in the United States was modest, with environmental and socioeconomic contexts exerting only a small influence. Similarly, Schmitt et al. (2007) [4] reported that cultural differences in personality traits are more pronounced across countries rather than within sub-regions of the same country.
In the Indian context, research by McCrae et al. (2008) [5] noted that despite linguistic and cultural diversity, Indians share relatively consistent personality characteristics when measured using the Five-Factor Model. The absence of significant differences in the present study may thus reflect shared cultural values, collectivist orientations, and similarities in educational and occupational backgrounds among participants from both Bengaluru and Lucknow. Furthermore, as both cities are urban centers, participants may have been exposed to comparable social and economic environments that shape personality expression in similar ways (Chopra, 2016) [5] .
Conclusion
The present study examined the distribution of personality traits among IT employees, with particular attention to gender-and location-based differences across the Big Five dimensions. Findings revealed that the majority of participants were moderate extroverts, suggesting a balanced approach to sociability and assertiveness, consistent with prior research highlighting the adaptive advantages of moderate extraversion (Grant et al., 2011; Soto, 2019) [7,13] . Gender-based analyses indicated both similarities and differences across traits. While no significant differences were found for extraversion and conscientiousness, males demonstrated higher levels of emotional stability and openness to experience compared to females. These findings align with cross-cultural evidence suggesting that men often report lower neurotic tendencies and greater openness to novelty, whereas women may express openness in aesthetic or interpersonal domains (Schmitt et al., 2008; Weisberg et al., 2011) [6,8] . Interestingly, agreeableness did not significantly differ between genders, diverging from prior meta-analyses that often report higher female agreeableness (Feingold, 1994; Schmitt et al., 2017) [2,12] . In contrast, location-based comparisons revealed no significant differences across personality traits between employees in Bengaluru and Lucknow. This suggests that, despite cultural and linguistic diversity, IT professionals from urban centers may share common personality characteristics shaped by comparable occupational, educational, and social environments (McCrae et al., 2005; Rentfrow et al., 2015) [3,10] . Taken together, the findings underscore the importance of considering demographic variables when examining personality in workplace contexts. While gender differences remain evident in specific traits, regional variations appear less pronounced within the IT sector. These results contribute to the growing literature on personality and occupational behavior by highlighting the nuanced ways in which personality traits manifest across demographic groups.
Future research may benefit from expanding the sample size, including employees from rural and semi-urban areas, and incorporating longitudinal designs to capture developmental changes in personality over time. Such efforts would provide a deeper understanding of how personality influences workplace outcomes and may guide the development of tailored human resource practices, team dynamics, and organizational policies.
Figures and tables from the paper
| Group Statistics | — | — | — | — | — |
|---|---|---|---|---|---|
| Gender | N | Mean | Std. Deviation | Std. Error Mean | |
| Extraversion | Male | 30 | 15.0000 | 3.93919 | .71919 |
| Female | 30 | 15.6667 | 3.65148 | .66667 | |
| Emotional stability | Male | 30 | 12.1667 | 4.01792 | .73357 |
| Female | 30 | 11.8000 | 3.24197 | .59190 | |
| Conscientiousness | Male | 30 | 16.5333 | 2.25501 | .41171 |
| Female | 30 | 17.0000 | 2.18143 | .39827 | |
| Agreeableness | Male | 30 | 17.5000 | 4.30517 | .78601 |
| Female | 30 | 16.0000 | 2.03419 | .37139 | |
| Openess To Experience | Male | 30 | 14.8000 | 2.94080 | .53691 |
| Female | 30 | 12.9667 | 4.00416 | .73106 |
Table text extracted from the original PDF; superscript letters are shown inline. The original table image is below.
View original table image
| Independent Samples Test | — | — | — | — | — | — | — | — | — | — |
|---|---|---|---|---|---|---|---|---|---|---|
| Levene's Test for Equality of Variances | t-test for Equality of Means | |||||||||
| F | Sig. | t | df | Sig. (2- tailed) | Mean Difference | Std. Error Difference | 95% Confidence Interval of the Difference | |||
| Lower | Upper | |||||||||
| Extraversion | Equal variances assumed | .001 | .979 | -.680 | 58 | .499 | -.66667 | .98066 | -2.62966 | 1.29633 |
| Equal variances not assumed | -.680 | 57.670 | .499 | -.66667 | .98066 | -2.62990 | 1.29657 | |||
| Emotional stability | Equal variances assumed | 1.346 | .251 | 2.296 | 58 | .025 | 2.13333 | .92918 | .27338 | 3.99329 |
| Equal variances not assumed | 2.296 | 54.676 | .026 | 2.13333 | .92918 | .27097 | 3.99570 | |||
| Conscientiousness | Equal variances assumed | .013 | .910 | -.815 | 58 | .419 | -.46667 | .57282 | -1.61329 | .67996 |
| Equal variances not assumed | -.815 | 57.936 | .419 | -.46667 | .57282 | -1.61332 | .67998 | |||
| Agreeableness | Equal variances assumed | 7.630 | .008 | 1.725 | 58 | .090 | 1.50000 | .86934 | -.24017 | 3.24017 |
| Equal variances not assumed | 1.725 | 41.334 | .092 | 1.50000 | .86934 | -.25523 | 3.25523 | |||
| Openess to experience | Equal variances assumed | 10.189 | .002 | 2.021 | 58 | .048 | 1.83333 | .90704 | .01770 | 3.64897 |
| Equal variances not assumed | 2.021 | 53.234 | .048 | 1.83333 | .90704 | .01423 | 3.65244 |
Table text extracted from the original PDF; superscript letters are shown inline. The original table image is below.
View original table image
References
12 in the original paper- Barrick MR, Mount MK. The Big Five personality dimensions and job performance: A meta-analysis. Pers Psychol. 1991;44(1):1-26. doi:10.1111/j.17446570.1991.tb00688.x
- McCrae RR, Terracciano A, 78 Members of the Personality Profiles of Cultures Project. Universal features of personality traits from the observer's perspective: Data from 50 cultures. J Pers Soc Psychol. 2005;88(3):547-61. doi:10.1037/0022-3514.88.3.547
- Schmitt DP, Allik J, McCrae RR, Benet-Martínez V. The geographic distribution of Big Five personality traits: Patterns and profiles of human self-description across 56 nations. J Cross Cult Psychol. 2007;38(2):173-212. doi:10.1177/0022022106297299
- McCrae RR, Costa PT Jr. The five-factor theory of personality. In: John OP, Robins RW, Pervin LA, editors. Handbook of personality: Theory and research. 3rd ed. New York: Guilford Press; 2008. p. 159-81.
- Schmitt DP, Realo A, Voracek M, Allik J. Why can't a man be more like a woman? Sex differences in Big Five personality traits across 55 cultures. J Pers Soc Psychol. 2008;94(1):168-82. doi:10.1037/0022-3514.94.1.168
- Grant AM, Gino F, Hofmann DA. Reversing the extraverted sales advantage: The role of ambiverts in adaptive selling. Psychol Sci. 2011;22(9):1029-35. doi:10.1177/0956797611417136
- Weisberg YJ, DeYoung CG, Hirsh JB. Gender differences in personality across the ten aspects of the Big Five. Front Psychol. 2011;2:178. doi:10.3389/fpsyg.2011.00178
- Judge TA, Zapata CP. The person-situation debate revisited: Effect of situation strength and trait activation on the validity of the Big Five personality traits in predicting job performance. Acad Manage J. 2015;58(4):1149-79. doi:10.5465/amj.2010.0837
- Rentfrow PJ, Jokela M, Lamb ME. Regional personality differences in Great Britain. PLoS One. 2015;10(3):e0122245. doi:10.1371/journal.pone.0122245
- Chopra R. Cultural context and personality in India: Perspectives on collectivism and individualism. Indian J Psychol. 2016;91(2):123-34.
- Schmitt DP, Long AE, McPhearson A, O'Brien K, Remmert B, Shah SH. Personality and gender differences in global perspective. Int J Psychol. 2017;52(S1):45-56. doi:10.1002/ijop.12265
- Soto CJ. How replicable are links between personality traits and consequential life outcomes? The life outcomes of personality replication project. Psychol Sci. 2019;30(5):711-27. doi:10.1177/0956797619831612