
Research article · 2025 · Full text
International Journal of Geography Geology and EnvironmentEnvironmental evaluation of the heavy metal in urban soil and its health effects from different areas of Kirkuk governorate
Volume 7(9) · Pages 13–21 · DOI: 10.22271/27067483.2025.v7.i9a.404 ↗
Research areasHeavy Metals in PlantsHeavy metals in environment
Abstract
Author-writtenUrban soil plays an important role as a source of absorption of toxic heavy metals resulting from human activities, including industrial emissions, traffic, and urban expansion. This study aims to assess the levels, sources, and risks of heavy metal contamination in the urban soil of Kirkuk. Several environmental assessments were conducted using environmental parameters. Twenty-three urban soil samples were collected at a depth of 0-15 cm and analyzed using inductively coupled plasma optical emission spectroscopy (ICP-OES). To assess contamination, indices such as the geological accumulation index (Igeo), enrichment factor (EF), contamination factor (CF), and degree of contamination (Cdeg) were calculated. The results showed that most heavy metals ranged from uncontaminated to moderately contaminated levels, with the exception of lead (Pb), which showed moderate to high contamination at specific sites. EF values indicated moderate enrichment of chromium (Cr), nickel (Ni), and lead (Pb), suggesting human impact, particularly from industrial and traffic sources. Health risk assessment showed ingestion as the primary exposure route, especially for children, with Cr posing the highest potential risk. However, most metal exposure levels were below reference doses (RfD), indicating low health risks in general. While most sites show low to moderate contamination, some require mitigation strategies due to elevated levels of lead and chromium.
Summary
Source-checkedPlain-language reading of the full paper, prepared with AI and checked against the text. Each point links to the authors' own words.
Why it matters
- Urban soils act as reservoirs for dangerous toxic heavy metals, which accumulate primarily due to human activities like industrial emissions and urban traffic. View evidence ↗
- The accumulation of these heavy metals in the environment presents a significant risk to living organisms. View evidence ↗
The question
- The study aims to assess heavy metal contamination levels in the urban soils of Kirkuk, identify where the pollution comes from, and evaluate the resulting environmental and health risks. View evidence ↗
What they did
- The soil samples were analyzed using inductively coupled plasma optical emission spectroscopy (ICP-OES) to measure heavy metal concentrations. View evidence ↗
- Contamination was assessed using four indices: the geological accumulation index (Igeo), enrichment factor (EF), contamination factor (CF), and degree of contamination (Cdeg). View evidence ↗
What they found
- Based on the Igeo index, most heavy metals in the soil ranged from uncontaminated to moderately contaminated levels. View evidence ↗
- Lead (Pb) had the highest average enrichment factor (EF) of 3.0, with values ranging from 0.3 to 16.4. View evidence ↗
- Chromium (Cr) and nickel (Ni) showed average EF values between 2.7 and 3, placing them in the moderate enrichment category. View evidence ↗
- The contamination factor (CF) for lead (Pb) averaged 5.1, with a range from 0.6 to 27.1. View evidence ↗
- For both adults and children, ingestion was identified as the primary exposure route for heavy metals, followed by inhalation and dermal contact. View evidence ↗
- Chromium (Cr) posed a potential health risk to children, with a Hazard Index (HI) of 3.43, which exceeds the safe limit of 1. View evidence ↗
What it means
- The authors conclude that children are more vulnerable to heavy metal exposure than adults, primarily through ingestion. View evidence ↗
- The authors recommend mitigation strategies for specific sites that exhibit elevated levels of lead and chromium. View evidence ↗
Figures & tables
From the original paper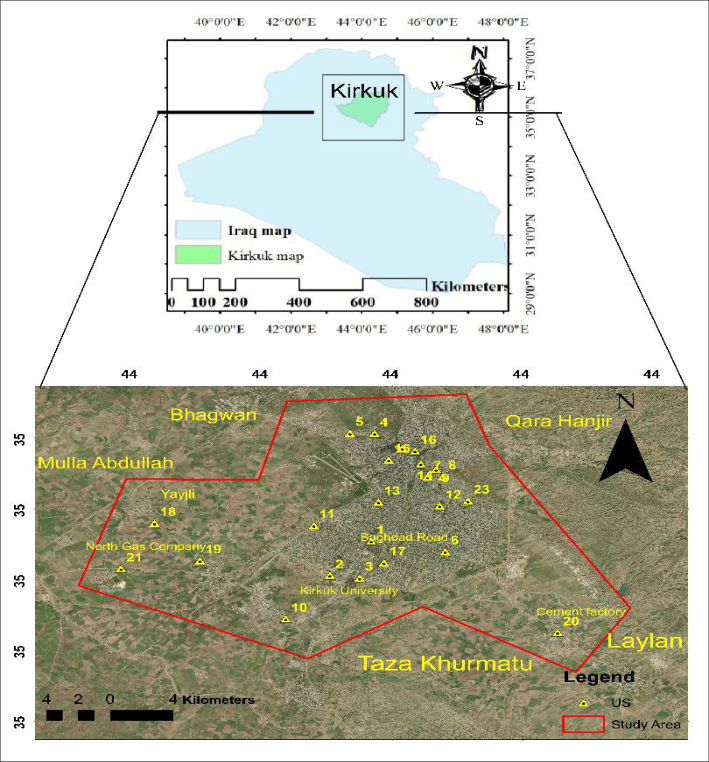 Figure 1
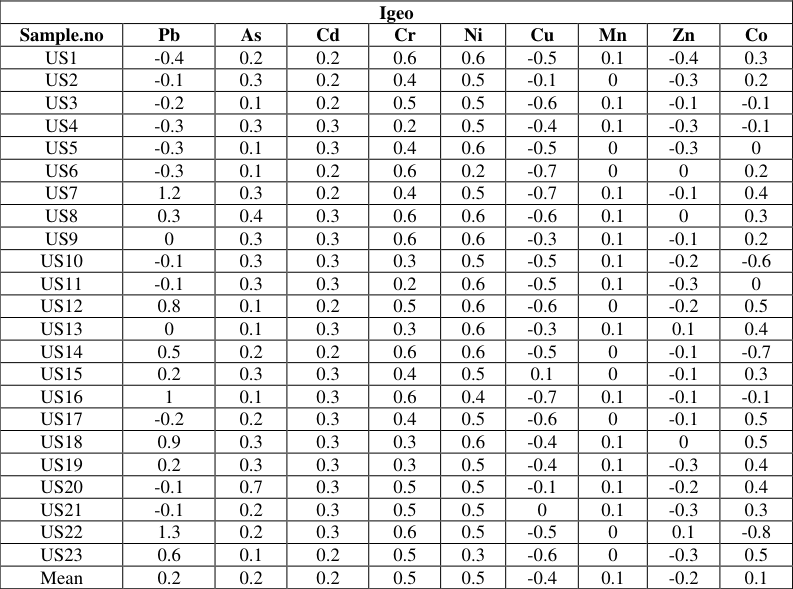 Table 1
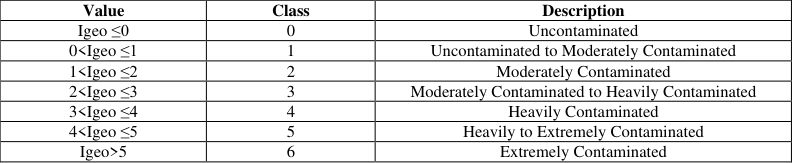 Table 2
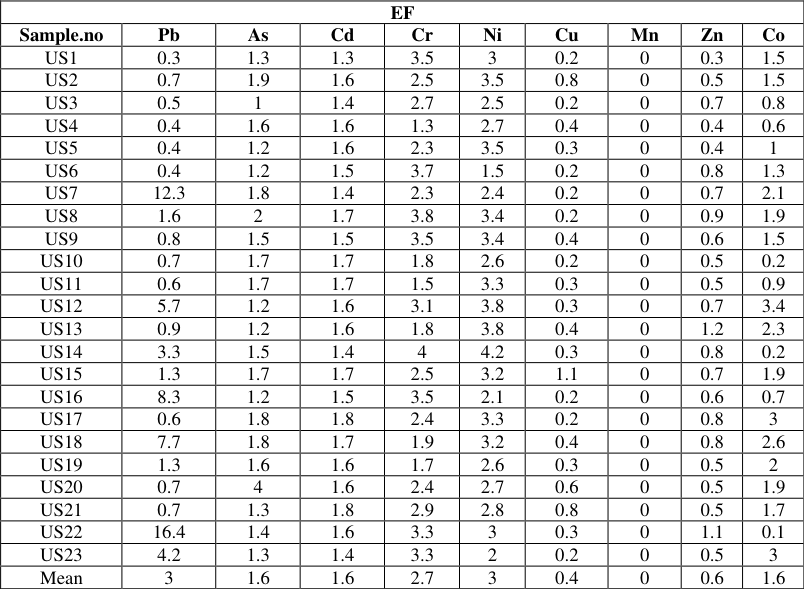 Table 3
 Table 4
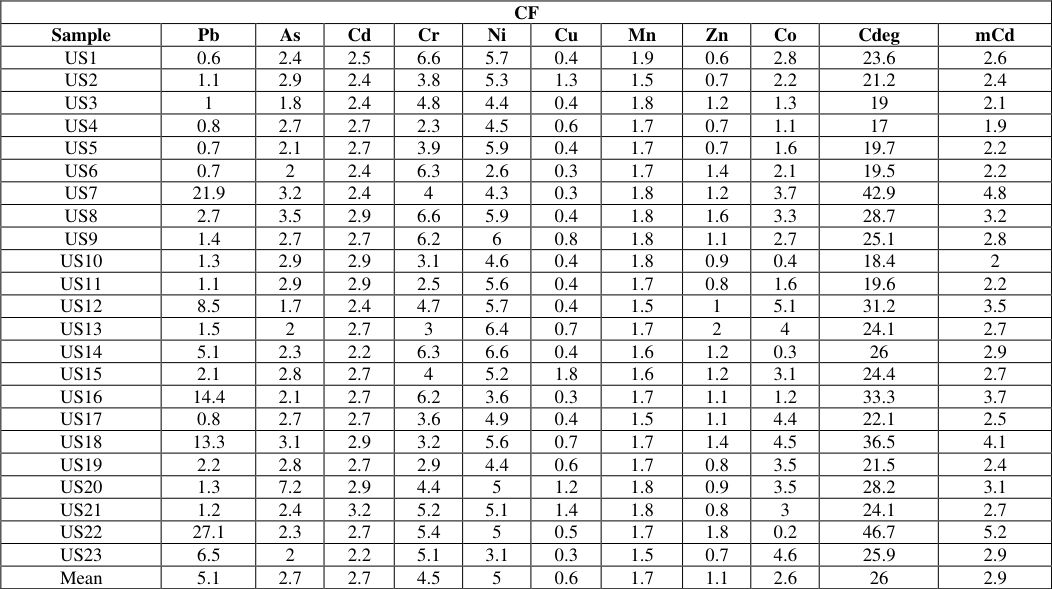 Table 5
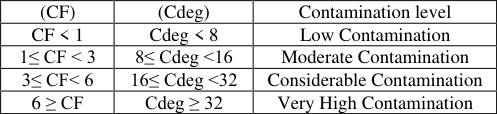 Table 6
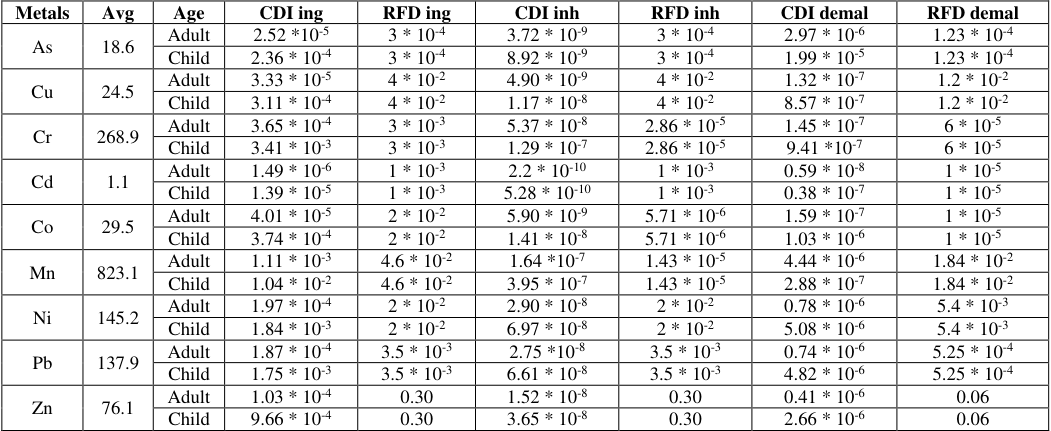 Table 7
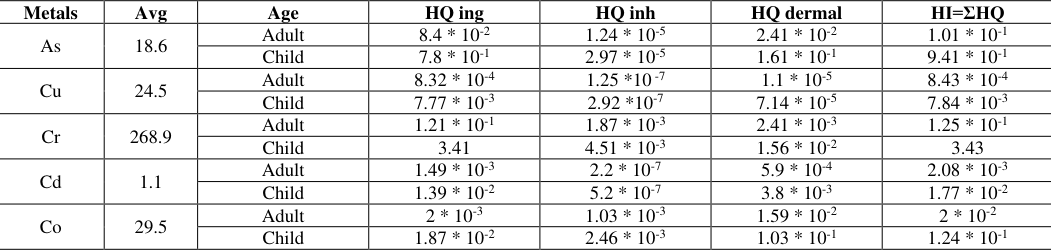 Table 8
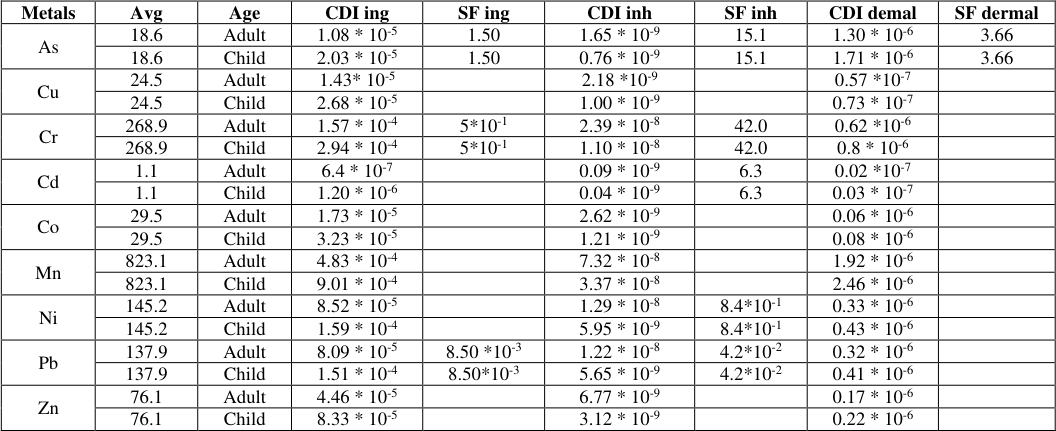 Table 9
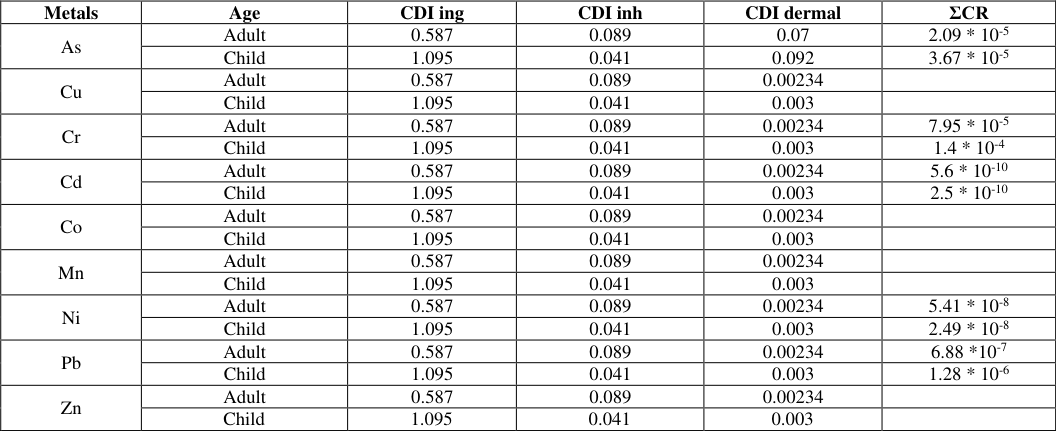 Table 10
Introduction
Urban soil is an important reservoir for toxic heavy metals such as lead (Pb), arsenic (As), cadmium (Cd), and chromium (Cr), which are among the most dangerous pollutants accumulated as a result of human activities, such as industrial emissions, pesticide use, contaminated rainwater runoff, and urban traffic formations (Boahen, 2024) [18] .Pollution with toxic heavy metals results from industrial sources, agricultural activities, urban expansion, as well as natural geological processes Several studies have also addressed this topic, the effect of toxic heavy elements in the soil and their health effects in Kirkuk, such as the study (Mohammed and Al -Jumaily, 2023) [28] which addressed their effect in different regions, in addition to other studies (Al -Obeidi and Al -Jumaily, 2020) [29] ; Al -Jumaily, 2016) [30] The distribution of these metals in the environment is affected by complex interactions with biological and chemical environmental factors, and these elements pose a significant environmental risk to living organisms. (El-Sharkawy, 2025(.Natural processes and human activities play a major role in the growing global concern about environmental pollution with heavy elements in the air, soil, and water systems (Li 𝑒𝑡 𝑎𝑙. , 2023) [2] ; (Holmes, 2021) [3] , (Morozesk 𝑒𝑡 𝑎𝑙. , 2021) [31] , (Zuo 𝑒𝑡 𝑎𝑙. , 2016) [5] , (Fu 𝑒𝑡 𝑎𝑙. , 2014) [6] . The various activities resulting from the main sources are considered to be large amounts of waste, such as excess construction materials, urban waste, and gaseous and liquid emissions, which can pose a threat to the environment with heavy elements. Extraction, exploration, and smelting processes also lead to the accumulation of many amounts of these wastes, contributing to increased concentrations of toxic metals such as cadmium (Cd), copper (Cu), arsenic (As), lead (Pb), zinc (Zn), and chromium (Cr) in the urban soil, as well as their emission into the atmosphere in the form of dust particles, which pose a serious threat to human health and the safety of ecological systems (Haghighizadeh 𝑒𝑡 𝑎𝑙. , 2024) [7] The aim of study assesses heavy metal contamination in Kirkuk's urban soils, identifies pollution sources, and evaluates environmental and health risks using spectral analysis and pollution indicators (Okeke et al, 2024) [4] .
Study area
The city of Kirkuk is located in the central part of Kirkuk Governorate and is bordered to the south by Laylan and Taza Khurmatu districts, to the north by Shawan district, to the east by Qara Hangar district, and to the west by Yayji district, Figure 1. The geologic layers in the Kirkuk region consist of multiple formations ranging from the oldest to the youngest, including the Fatha, Anjanah, Muqdadiya, and Bai Hassan formations, as well as modern deposits (𝐽𝑎𝑠𝑠𝑖𝑚 𝑎𝑛𝑑 𝐺𝑜𝑓𝑓, 2006 [8] ).
Aim of study:
This study aims to assess heavy metal contamination levels in urban soils in the city of Kirkuk, and the sources of these contaminants, and estimate the associated environmental and health risks using spectral analysis techniques with pollution assessment indicators.
Material & Methods
Urban soil samples were collected at a depth of (0-15) cm from different areas of Kirkuk city center. They were ground and sieved using a mesh 200 sieve, then 10 g of each sample was taken and placed in airtight bags, numbered and sent to Tehran laboratories and analyzed by using ICP-OES to measure the concentrations of heavy metals.
Result and Discussion
Result and Discussion
IGeo accumulation index
It is used to compare the concentrations in samples with their natural reference values, which helps determine the extent of human activities' impact on the environment (Fadhel and Abdulhussein, 2022) [19] and as in the equation (1).
Where (Cn) represents the concentration of the element in ppm in the surface soil, while (Bn) represents the natural reference concentration of the element according to (Kabata -Pendis, 2011) [23] , 1.5 is the correction factor based on lithogenicity and based on the Igeo values in the study area Table (4-1), the soil was classified into seven types according to its contamination based on (Muller, 1969) [10] Table (2). The results of the current study of the soil accumulation factor (Igeo) showed that most heavy metals fall within table (1) and ( 2) categories (0) and (1), meaning that they range from uncontaminated to moderately contaminated. Copper (Cu) and zinc (Zn) recorded negative values, placing them in Class 0, which means that the soil is not contaminated with these metals, i.e., their concentrations are low and do not pose any environmental hazard. As for arsenic (As), cadmium (Cd), chromium (Cr), nickel (Ni), manganese (Mn), and cobalt (Co) ranged between 0.1 and 0.5, classifying them as Class 1, i.e., uncontaminated to moderately contaminated. This may reflect moderate contamination, but it is not dangerous. However, it may indicate the interference of human activities in the environment. Although most of the results indicate low levels of contamination, lead (Pb) was recorded in some samples at values exceeding one, such as (US7 and US22) in the areas of Al-Masalla apartments and Arafat Stadium, respectively, placing it in Class 2, which indicates that it is moderately polluted. This may be the result of pollution from industrial activities and heavy vehicle traffic that uses lead in gasoline components, resulting from sources of pollution such as waste or industrial activities.
Enrichment factor
The enrichment factor (EF) is used to determine the extent to which the concentration of heavy elements in a soil sample is increased compared to its natural concentration in the environment. The purpose of using EF is to differentiate between natural sources of the element and pollution resulting from human activities (Sutherland, 2000) [20] . Manganese (Mn) is one of the elements used as a reference among other elements (Sc, Fe, Al, Ti, V, Mn), and the enrichment factor value is calculated based on (simex and Helz, 1981) [21] , (Ergin et al., 1991) [22] as in the equation ( 2)
Where sample (Me\Mn) represents the concentration ratio of the element in the sample studied/the concentration of manganese in it, while (Me\Mn) represents the concentration ratio of the reference element/the concentration of the reference manganese element based on the background (Kabata -Pendias 2011) [23] .
Table (3) shows the enrichment coefficients in the study area. It was found that lead (Pb) recorded the highest enrichment factor among all metals, with an average EF of (3.0) and a range between (0. 3 -16.4). This shows that most of the samples under study fall within the Moderate enrichment category according to (Sezgin, 2004) [9] Table (4), with some samples such as US7 and US22 falling within the Significant enrichment category), indicating the possibility of contamination resulting from human activity such as heavy vehicle traffic or industrial waste. As for arsenic (As), it recorded an average enrichment factor of 1.6 and was classified as Deficiency to Minimal Enrichment, indicating that it is naturally present in most samples, with the exception of one sample that approached the upper limit. However, other elements such as cadmium (Cd), copper (Cu), zinc (Zn), and cobalt (Co) ranged between 0.2 and 1.6, confirming that they are within normal levels and uncontaminated. In contrast, both chromium (Cr) and nickel (Ni) showed average values ranging between 2.7 and 3, respectively, within the moderate enrichment category, indicating the possibility of moderate contamination resulting from human activities.
Contamination (CF) and Degree of Contamination (Cdeg)
The contamination factor (CF) is one of the indicators used to determine the extent of heavy metal contamination in soil. It is the ratio of the concentration of the element in the sample to its natural concentration and is calculated using equation (3) according to (Hakanson, 1980) [11] .
Where 𝐶 𝑆𝑎𝑚𝑝𝑙𝑒 represents the concentration of the element in the sample, while 𝐶 𝑏𝑎𝑐𝑘𝑔𝑟𝑜𝑢𝑛𝑑 represents the concentration of the element in the soil, based on the values published by (Kabata-Pendias, 2011). While the pollution degree index (𝐶 𝑑𝑒𝑔 ) is one of the methods used to determine the degree of pollution in the soil (𝐻𝑎𝑘𝑎𝑛𝑠𝑜𝑛, 1980) [11] according to equation ( 4). ( 4) Table (5) shows the values of the pollution index and the degree of pollution in the urban soil of Kirkuk. The results showed that the CF values for lead (Pb) ranged between 0.6 and 27.1, with an average of 5.1. This indicates pollution ranging from low to moderate according to (Hakanson, 1980) [11] . Table (6), while arsenic (As) had CF values ranging from 1.8 to 7.2, with an average of 2.7, indicating low to moderate contamination according to the classification (Hakanson, 1980) [11] . It is known that arsenic has toxic properties, but in these samples it did not reach high levels. Cadmium (Cd) showed CF values ranging between 2.2 and 3.2, with an average of 2.7. Chromium (Cr) showed CF values between 2.3 and 6.6, with an average of 4.5, indicating considerable contamination. Nickel (Ni) showed values ranging from 2.6 to 6.6, with an average of 5.0, indicating considerable contamination, while copper (Cu), manganese (Mn), and zinc (Zn) showed CF values below 2, indicating low contamination. As for cobalt (Co), the CF contamination index ranged between 0.2 and 4.6, with an average of 2. [11] .
Very High Contamination Cdeg ≥ 32 6 ≥ CF
Health risk assessment of heavy metals in urban soil
Health risk assessment of heavy metals in urban soil
Study area 5.4.1 Chronic Daily Intake (CDI)
The objective of assessing the health risks of heavy metals in urban soil in urban areas, including the study area, is to understand their behavior and exposure routes based on the primary routes of human exposure on a daily basis, namely ingestion, inhalation and dermal contact. The chronic daily intake dose for each route is calculated separately for adults and children according to (𝑃𝑎𝑟𝑣𝑒𝑧 𝑒𝑡 𝑎𝑙. , 2024) [25] , (𝐾𝑒𝑙𝑒𝑝𝑒𝑟𝑡𝑧𝑖𝑠, 2014 [24] ), as shown in the equations (5)(6)( 7)
Where (𝐶 𝑠𝑜𝑖𝑙 ) represents the concentration of the element, measured in ppm, and 𝐶𝐷 𝑖𝑛𝑔 (average daily intake of heavy metals ingested from soil) is the average daily dose ingested) (𝐶𝐷 𝑖𝑛ℎ ) (is the average daily intake of heavy metals inhaled from soil) is the average daily dose inhaled (𝐶𝐷 𝑑𝑒𝑟𝑚𝑎𝑙 ) (exposure dose via dermal contact) represents the average daily dose via skin contact, and each is measured in units of (mg/kg.day), and Exposure frequency (EF) represents the number of times exposure is repeated and is measured in units of (days/year), while (ED) Exposure duration is the average exposure period measured in (Years), BW represents human body weight in kg, while CF is the conversion factor for elements and is measured in kg/mg. Particle emission factor (PEF) is the factor of particle emission from soil and is measured in (mg/cm².day). represents the soil adhesion factor to the skin and is measured in units, and (SL) Soil to skin adherence factor is measured in units of (mg/cm².day), while SA refers to the area of skin exposed to soil and is measured in units of (𝐶𝑚 2 ), (ABS) is the skin absorption factor, while (AT) Average Time represents the average exposure time and is measured in units of (day). The values of the above variables for both adults and children are shown in Table (7). Table (8) explains the daily dose values of heavy elements in urban soil in the study area. The results of the chronic daily intake (CDI) of heavy metals showed that their values were, in order 𝐶𝐷𝐼 𝑖𝑛𝑔 > 𝐶𝐷𝐼 𝑖𝑛ℎ > 𝐶𝐷𝐼 𝑑𝑒𝑟𝑚𝑎𝑙 dermal for children and adults, respectively. This means that ingestion is the main source of exposure, followed by inhalation, then skin contact, which is the least significant. The value of chromium (Cr) in children was high, indicating a potential risk via the oral route, while inhalation and skin contact were well below the reference limits. As for arsenic (As) and lead (Pb), they did not exceed the permissible limit, especially in children. On the other hand, other elements such as zinc (Zn), copper (Cu), and cadmium (Cd) showed low values in all three exposure routes, with all (CDI < RfD), indicating their safety when exposed. Table 7: Variables used in the Health Risk Assessment for urban soil samples for both children and adults based on (USEPA, 2017) [14] USEPA, 2016) [13] , (Qing et al., 2015) [12] . Arsenic is a toxic element that poses a danger when exposed to it, as children have been found to be exposed to higher levels of this element through ingestion compared to adults, making them more susceptible to poisoning. Copper is an essential element for the body, but excessive exposure to it can lead to health problems. However, children's exposure levels through inhalation and ingestion do not exceed safe limits compared to adults, which means that copper is not a source of danger. Chromium, on the other hand, has shown significantly higher exposure rates in children than in adults, especially through ingestion, with children's exposure to this element exceeding safe limits. Cadmium, known for its toxic effects on the kidneys and respiratory system, shows higher exposure rates in children through ingestion compared to adults, while lead, which is one of the main causes of poisoning in children, shows exposure rates through all three routes that significantly exceed safe limits. Therefore, this element is considered one of the most dangerous toxic elements, causing health problems and affecting the nervous and mental systems of children. Zinc is an essential element in the body, contributing to many vital processes, and excessive exposure to it can lead to poisoning. The results showed that children's exposure to zinc through ingestion is slightly higher than that of adults, but remains within safe limits (Vahter, 2008) [15] , (Bansal, 2023) [17] , (Al Osman et al., 2019) [27] , (Larsen & Sánchez-Triana, 2023) [16] .
| Metals | Avg | Age | CDI ing | RFD ing | CDI inh | RFD inh | CDI demal | RFD demal |
|---|---|---|---|---|---|---|---|---|
| As | 18.6 | Adult | 2.52 *10-5 | 3 * 10-4 | 3.72 * 10-9 | 3 * 10-4 | 2.97 * 10-6 | 1.23 * 10-4 |
| Child | 2.36 * 10-4 | 3 * 10-4 | 8.92 * 10-9 | 3 * 10-4 | 1.99 * 10-5 | 1.23 * 10-4 | ||
| Cu | 24.5 | Adult | 3.33 * 10-5 | 4 * 10-2 | 4.90 * 10-9 | 4 * 10-2 | 1.32 * 10-7 | 1.2 * 10-2 |
| Child | 3.11 * 10-4 | 4 * 10-2 | 1.17 * 10-8 | 4 * 10-2 | 8.57 * 10-7 | 1.2 * 10-2 | ||
| Cr | 268.9 | Adult | 3.65 * 10-4 | 3 * 10-3 | 5.37 * 10-8 | 2.86 * 10-5 | 1.45 * 10-7 | 6 * 10-5 |
| Child | 3.41 * 10-3 | 3 * 10-3 | 1.29 * 10-7 | 2.86 * 10-5 | 9.41 *10-7 | 6 * 10-5 | ||
| Cd | 1.1 | Adult | 1.49 * 10-6 | 1 * 10-3 | 2.2 * 10-10 | 1 * 10-3 | 0.59 * 10-8 | 1 * 10-5 |
| Child | 1.39 * 10-5 | 1 * 10-3 | 5.28 * 10-10 | 1 * 10-3 | 0.38 * 10-7 | 1 * 10-5 | ||
| Co | 29.5 | Adult | 4.01 * 10-5 | 2 * 10-2 | 5.90 * 10-9 | 5.71 * 10-6 | 1.59 * 10-7 | 1 * 10-5 |
| Child | 3.74 * 10-4 | 2 * 10-2 | 1.41 * 10-8 | 5.71 * 10-6 | 1.03 * 10-6 | 1 * 10-5 | ||
| Mn | 823.1 | Adult | 1.11 * 10-3 | 4.6 * 10-2 | 1.64 *10-7 | 1.43 * 10-5 | 4.44 * 10-6 | 1.84 * 10-2 |
| Child | 1.04 * 10-2 | 4.6 * 10-2 | 3.95 * 10-7 | 1.43 * 10-5 | 2.88 * 10-7 | 1.84 * 10-2 | ||
| Ni | 145.2 | Adult | 1.97 * 10-4 | 2 * 10-2 | 2.90 * 10-8 | 2 * 10-2 | 0.78 * 10-6 | 5.4 * 10-3 |
| Child | 1.84 * 10-3 | 2 * 10-2 | 6.97 * 10-8 | 2 * 10-2 | 5.08 * 10-6 | 5.4 * 10-3 | ||
| Pb | 137.9 | Adult | 1.87 * 10-4 | 3.5 * 10-3 | 2.75 *10-8 | 3.5 * 10-3 | 0.74 * 10-6 | 5.25 * 10-4 |
| Child | 1.75 * 10-3 | 3.5 * 10-3 | 6.61 * 10-8 | 3.5 * 10-3 | 4.82 * 10-6 | 5.25 * 10-4 | ||
| Zn | 76.1 | Adult | 1.03 * 10-4 | 0.30 | 1.52 * 10-8 | 0.30 | 0.41 * 10-6 | 0.06 |
| Child | 9.66 * 10-4 | 0.30 | 3.65 * 10-8 | 0.30 | 2.66 * 10-6 | 0.06 |
Table text extracted from the original PDF; superscript letters are shown inline. The original table image is below.
View original table image
Non Carcinogenic Risk Assessment
The non-carcinogenic effect is determined by calculating the hazard quotient (HQ), which expresses the ratio of chronic daily intake (CDI) via the three pathways to the reference dose (RfD) for each pathway (𝑈𝑆𝐸𝑃𝐴, 1989) [26] , as shown in the following equations (8) (9).
The results of chronic daily intake (CDI) values via three routes (ingestion, inhalation, and dermal), as well as the hazard quotient (HQ) and total health hazard index (HI = ∑HQ) for heavy metals for both adults and children Table (9).
Children are exposed to higher levels of risk than adults due to their higher absorption rates. If HQ > 1, it is considered an indicator of potential health risk. and this limit was exceeded only for chromium (Cr) in children, indicating a potential risk when exposed to this element. The rest of the heavy metals under study were within safe limits, so chromium (Cr) showed the highest HI value in children with a value of (3.43), which exceeds the safe limit (1) and indicates a health risk, while the value for adults was much lower (0.125). The reason for this may be due to their daily behaviors (such as playing on the ground and putting things in their mouths). followed by arsenic (As), which shows a high risk in children with an HI value close to 1 (0.941), especially in younger age groups. In contrast, copper and zinc recorded relatively low HQ and HI values, indicating that their potential risk is lower compared to other elements. The carcinogenic risk (CR) rating for a group of heavy metals found in urban soil in the city of Kirkuk, and the differences in risk levels between adults and children across the three routes of exposure: ingestion, inhalation, and dermal absorption. Table (11) It showed that there is a carcinogenic risk associated with arsenic (As), with the highest CR values recorded for both adults and children at (2.09𝑥10 -5 ) (3.67𝑥10 -5 ) respectively, which are close to the globally accepted upper limit (10 -4 ), This indicates a potential carcinogenic risk, especially in children. It was also found that the most exposed route is ingestion, followed by skin absorption, but chromium (Cr) recorded high values, with CR reaching (7.95𝑋10 -5 ) for childern (1.4𝑥10 -4 ) It exceeds acceptable limits, indicating a carcinogenic risk to children.
Therefore, the risk of chromium comes mainly from inhalation, which reinforces the importance of air quality as a factor in assessing health risks. On the contrary, the carcinogenic risk levels of metals such as cadmium (Cd), nickel (Ni), and lead (Pb) were lower than in the urban soil of Kirkuk.
Conclusion
The soil accumulation factor for all heavy elements was found to be uncontaminated to moderately contaminated, except for lead, which recorded moderate contamination values in some locations. This may be due to the heavy vehicle traffic in those areas. The lead element recorded values for the enrichment factor ranging from moderate to high enrichment, while most other heavy elements were moderately enriched, indicating the role of human activities.
The health risk results showed that children are more vulnerable than adults, with ingestion being the main source of exposure, followed by inhalation and then skin contact, particularly for Cr, As, and Zn. The current study found that the risk quotient and risk index were significantly higher in children than in adults, particularly for chromium and, to a lesser extent, arsenic. This may be due to children's behavior and playing in open public spaces. The carcinogenic risk index showed that children had higher levels than adults, especially for chromium, which exceeded the permissible limit through inhalation compared to ingestion and skin absorption, followed by arsenic to a lesser extent.
Figures and tables from the paper
| Igeo | — | — | — | — | — | — | — | — | — |
|---|---|---|---|---|---|---|---|---|---|
| Sample.no | Pb | As | Cd | Cr | Ni | Cu | Mn | Zn | Co |
| US1 | -0.4 | 0.2 | 0.2 | 0.6 | 0.6 | -0.5 | 0.1 | -0.4 | 0.3 |
| US2 | -0.1 | 0.3 | 0.2 | 0.4 | 0.5 | -0.1 | 0 | -0.3 | 0.2 |
| US3 | -0.2 | 0.1 | 0.2 | 0.5 | 0.5 | -0.6 | 0.1 | -0.1 | -0.1 |
| US4 | -0.3 | 0.3 | 0.3 | 0.2 | 0.5 | -0.4 | 0.1 | -0.3 | -0.1 |
| US5 | -0.3 | 0.1 | 0.3 | 0.4 | 0.6 | -0.5 | 0 | -0.3 | 0 |
| US6 | -0.3 | 0.1 | 0.2 | 0.6 | 0.2 | -0.7 | 0 | 0 | 0.2 |
| US7 | 1.2 | 0.3 | 0.2 | 0.4 | 0.5 | -0.7 | 0.1 | -0.1 | 0.4 |
| US8 | 0.3 | 0.4 | 0.3 | 0.6 | 0.6 | -0.6 | 0.1 | 0 | 0.3 |
| US9 | 0 | 0.3 | 0.3 | 0.6 | 0.6 | -0.3 | 0.1 | -0.1 | 0.2 |
| US10 | -0.1 | 0.3 | 0.3 | 0.3 | 0.5 | -0.5 | 0.1 | -0.2 | -0.6 |
| US11 | -0.1 | 0.3 | 0.3 | 0.2 | 0.6 | -0.5 | 0.1 | -0.3 | 0 |
| US12 | 0.8 | 0.1 | 0.2 | 0.5 | 0.6 | -0.6 | 0 | -0.2 | 0.5 |
| US13 | 0 | 0.1 | 0.3 | 0.3 | 0.6 | -0.3 | 0.1 | 0.1 | 0.4 |
| US14 | 0.5 | 0.2 | 0.2 | 0.6 | 0.6 | -0.5 | 0 | -0.1 | -0.7 |
| US15 | 0.2 | 0.3 | 0.3 | 0.4 | 0.5 | 0.1 | 0 | -0.1 | 0.3 |
| US16 | 1 | 0.1 | 0.3 | 0.6 | 0.4 | -0.7 | 0.1 | -0.1 | -0.1 |
| US17 | -0.2 | 0.2 | 0.3 | 0.4 | 0.5 | -0.6 | 0 | -0.1 | 0.5 |
| US18 | 0.9 | 0.3 | 0.3 | 0.3 | 0.6 | -0.4 | 0.1 | 0 | 0.5 |
| US19 | 0.2 | 0.3 | 0.3 | 0.3 | 0.5 | -0.4 | 0.1 | -0.3 | 0.4 |
| US20 | -0.1 | 0.7 | 0.3 | 0.5 | 0.5 | -0.1 | 0.1 | -0.2 | 0.4 |
| US21 | -0.1 | 0.2 | 0.3 | 0.5 | 0.5 | 0 | 0.1 | -0.3 | 0.3 |
| US22 | 1.3 | 0.2 | 0.3 | 0.6 | 0.5 | -0.5 | 0 | 0.1 | -0.8 |
| US23 | 0.6 | 0.1 | 0.2 | 0.5 | 0.3 | -0.6 | 0 | -0.3 | 0.5 |
| Mean | 0.2 | 0.2 | 0.2 | 0.5 | 0.5 | -0.4 | 0.1 | -0.2 | 0.1 |
Table text extracted from the original PDF; superscript letters are shown inline. The original table image is below.
View original table image
| Value | Class | Description |
|---|---|---|
| Igeo ≤0 | 0 | Uncontaminated |
| 0<Igeo ≤1 | 1 | Uncontaminated to Moderately Contaminated |
| 1<Igeo ≤2 | 2 | Moderately Contaminated |
| 2<Igeo ≤3 | 3 | Moderately Contaminated to Heavily Contaminated |
| 3<Igeo ≤4 | 4 | Heavily Contaminated |
| 4<Igeo ≤5 | 5 | Heavily to Extremely Contaminated |
| Igeo>5 | 6 | Extremely Contaminated |
Table text extracted from the original PDF; superscript letters are shown inline. The original table image is below.
View original table image
| EF | — | — | — | — | — | — | — | — | — |
|---|---|---|---|---|---|---|---|---|---|
| Sample.no | Pb | As | Cd | Cr | Ni | Cu | Mn | Zn | Co |
| US1 | 0.3 | 1.3 | 1.3 | 3.5 | 3 | 0.2 | 0 | 0.3 | 1.5 |
| US2 | 0.7 | 1.9 | 1.6 | 2.5 | 3.5 | 0.8 | 0 | 0.5 | 1.5 |
| US3 | 0.5 | 1 | 1.4 | 2.7 | 2.5 | 0.2 | 0 | 0.7 | 0.8 |
| US4 | 0.4 | 1.6 | 1.6 | 1.3 | 2.7 | 0.4 | 0 | 0.4 | 0.6 |
| US5 | 0.4 | 1.2 | 1.6 | 2.3 | 3.5 | 0.3 | 0 | 0.4 | 1 |
| US6 | 0.4 | 1.2 | 1.5 | 3.7 | 1.5 | 0.2 | 0 | 0.8 | 1.3 |
| US7 | 12.3 | 1.8 | 1.4 | 2.3 | 2.4 | 0.2 | 0 | 0.7 | 2.1 |
| US8 | 1.6 | 2 | 1.7 | 3.8 | 3.4 | 0.2 | 0 | 0.9 | 1.9 |
| US9 | 0.8 | 1.5 | 1.5 | 3.5 | 3.4 | 0.4 | 0 | 0.6 | 1.5 |
| US10 | 0.7 | 1.7 | 1.7 | 1.8 | 2.6 | 0.2 | 0 | 0.5 | 0.2 |
| US11 | 0.6 | 1.7 | 1.7 | 1.5 | 3.3 | 0.3 | 0 | 0.5 | 0.9 |
| US12 | 5.7 | 1.2 | 1.6 | 3.1 | 3.8 | 0.3 | 0 | 0.7 | 3.4 |
| US13 | 0.9 | 1.2 | 1.6 | 1.8 | 3.8 | 0.4 | 0 | 1.2 | 2.3 |
| US14 | 3.3 | 1.5 | 1.4 | 4 | 4.2 | 0.3 | 0 | 0.8 | 0.2 |
| US15 | 1.3 | 1.7 | 1.7 | 2.5 | 3.2 | 1.1 | 0 | 0.7 | 1.9 |
| US16 | 8.3 | 1.2 | 1.5 | 3.5 | 2.1 | 0.2 | 0 | 0.6 | 0.7 |
| US17 | 0.6 | 1.8 | 1.8 | 2.4 | 3.3 | 0.2 | 0 | 0.8 | 3 |
| US18 | 7.7 | 1.8 | 1.7 | 1.9 | 3.2 | 0.4 | 0 | 0.8 | 2.6 |
| US19 | 1.3 | 1.6 | 1.6 | 1.7 | 2.6 | 0.3 | 0 | 0.5 | 2 |
| US20 | 0.7 | 4 | 1.6 | 2.4 | 2.7 | 0.6 | 0 | 0.5 | 1.9 |
| US21 | 0.7 | 1.3 | 1.8 | 2.9 | 2.8 | 0.8 | 0 | 0.5 | 1.7 |
| US22 | 16.4 | 1.4 | 1.6 | 3.3 | 3 | 0.3 | 0 | 1.1 | 0.1 |
| US23 | 4.2 | 1.3 | 1.4 | 3.3 | 2 | 0.2 | 0 | 0.5 | 3 |
| Mean | 3 | 1.6 | 1.6 | 2.7 | 3 | 0.4 | 0 | 0.6 | 1.6 |
Table text extracted from the original PDF; superscript letters are shown inline. The original table image is below.
View original table image
| CF | — | — | — | — | — | — | — | — | — | — | — |
|---|---|---|---|---|---|---|---|---|---|---|---|
| Sample | Pb | As | Cd | Cr | Ni | Cu | Mn | Zn | Co | Cdeg | mCd |
| US1 | 0.6 | 2.4 | 2.5 | 6.6 | 5.7 | 0.4 | 1.9 | 0.6 | 2.8 | 23.6 | 2.6 |
| US2 | 1.1 | 2.9 | 2.4 | 3.8 | 5.3 | 1.3 | 1.5 | 0.7 | 2.2 | 21.2 | 2.4 |
| US3 | 1 | 1.8 | 2.4 | 4.8 | 4.4 | 0.4 | 1.8 | 1.2 | 1.3 | 19 | 2.1 |
| US4 | 0.8 | 2.7 | 2.7 | 2.3 | 4.5 | 0.6 | 1.7 | 0.7 | 1.1 | 17 | 1.9 |
| US5 | 0.7 | 2.1 | 2.7 | 3.9 | 5.9 | 0.4 | 1.7 | 0.7 | 1.6 | 19.7 | 2.2 |
| US6 | 0.7 | 2 | 2.4 | 6.3 | 2.6 | 0.3 | 1.7 | 1.4 | 2.1 | 19.5 | 2.2 |
| US7 | 21.9 | 3.2 | 2.4 | 4 | 4.3 | 0.3 | 1.8 | 1.2 | 3.7 | 42.9 | 4.8 |
| US8 | 2.7 | 3.5 | 2.9 | 6.6 | 5.9 | 0.4 | 1.8 | 1.6 | 3.3 | 28.7 | 3.2 |
| US9 | 1.4 | 2.7 | 2.7 | 6.2 | 6 | 0.8 | 1.8 | 1.1 | 2.7 | 25.1 | 2.8 |
| US10 | 1.3 | 2.9 | 2.9 | 3.1 | 4.6 | 0.4 | 1.8 | 0.9 | 0.4 | 18.4 | 2 |
| US11 | 1.1 | 2.9 | 2.9 | 2.5 | 5.6 | 0.4 | 1.7 | 0.8 | 1.6 | 19.6 | 2.2 |
| US12 | 8.5 | 1.7 | 2.4 | 4.7 | 5.7 | 0.4 | 1.5 | 1 | 5.1 | 31.2 | 3.5 |
| US13 | 1.5 | 2 | 2.7 | 3 | 6.4 | 0.7 | 1.7 | 2 | 4 | 24.1 | 2.7 |
| US14 | 5.1 | 2.3 | 2.2 | 6.3 | 6.6 | 0.4 | 1.6 | 1.2 | 0.3 | 26 | 2.9 |
| US15 | 2.1 | 2.8 | 2.7 | 4 | 5.2 | 1.8 | 1.6 | 1.2 | 3.1 | 24.4 | 2.7 |
| US16 | 14.4 | 2.1 | 2.7 | 6.2 | 3.6 | 0.3 | 1.7 | 1.1 | 1.2 | 33.3 | 3.7 |
| US17 | 0.8 | 2.7 | 2.7 | 3.6 | 4.9 | 0.4 | 1.5 | 1.1 | 4.4 | 22.1 | 2.5 |
| US18 | 13.3 | 3.1 | 2.9 | 3.2 | 5.6 | 0.7 | 1.7 | 1.4 | 4.5 | 36.5 | 4.1 |
| US19 | 2.2 | 2.8 | 2.7 | 2.9 | 4.4 | 0.6 | 1.7 | 0.8 | 3.5 | 21.5 | 2.4 |
| US20 | 1.3 | 7.2 | 2.9 | 4.4 | 5 | 1.2 | 1.8 | 0.9 | 3.5 | 28.2 | 3.1 |
| US21 | 1.2 | 2.4 | 3.2 | 5.2 | 5.1 | 1.4 | 1.8 | 0.8 | 3 | 24.1 | 2.7 |
| US22 | 27.1 | 2.3 | 2.7 | 5.4 | 5 | 0.5 | 1.7 | 1.8 | 0.2 | 46.7 | 5.2 |
| US23 | 6.5 | 2 | 2.2 | 5.1 | 3.1 | 0.3 | 1.5 | 0.7 | 4.6 | 25.9 | 2.9 |
| Mean | 5.1 | 2.7 | 2.7 | 4.5 | 5 | 0.6 | 1.7 | 1.1 | 2.6 | 26 | 2.9 |
Table text extracted from the original PDF; superscript letters are shown inline. The original table image is below.
View original table image
| Metals | Avg | Age | HQ ing | HQ inh | HQ dermal | HI=ƩHQ |
|---|---|---|---|---|---|---|
| As | 18.6 | Adult | 8.4 * 10-2 | 1.24 * 10-5 | 2.41 * 10-2 | 1.01 * 10-1 |
| Child | 7.8 * 10-1 | 2.97 * 10-5 | 1.61 * 10-1 | 9.41 * 10-1 | ||
| Cu | 24.5 | Adult | 8.32 * 10-4 | 1.25 *10 -7 | 1.1 * 10-5 | 8.43 * 10-4 |
| Child | 7.77 * 10-3 | 2.92 *10-7 | 7.14 * 10-5 | 7.84 * 10-3 | ||
| Cr | 268.9 | Adult | 1.21 * 10-1 | 1.87 * 10-3 | 2.41 * 10-3 | 1.25 * 10-1 |
| Child | 3.41 | 4.51 * 10-3 | 1.56 * 10-2 | 3.43 | ||
| Cd | 1.1 | Adult | 1.49 * 10-3 | 2.2 * 10-7 | 5.9 * 10-4 | 2.08 * 10-3 |
| Child | 1.39 * 10-2 | 5.2 * 10-7 | 3.8 * 10-3 | 1.77 * 10-2 | ||
| Co | 29.5 | Adult | 2 * 10-3 | 1.03 * 10-3 | 1.59 * 10-2 | 2 * 10-2 |
| Child | 1.87 * 10-2 | 2.46 * 10-3 | 1.03 * 10-1 | 1.24 * 10-1 |
Table text extracted from the original PDF; superscript letters are shown inline. The original table image is below.
View original table image
| Metals | Avg | Age | CDI ing | SF ing | CDI inh | SF inh | CDI demal | SF dermal |
|---|---|---|---|---|---|---|---|---|
| As | 18.6 | Adult | 1.08 * 10-5 | 1.50 | 1.65 * 10-9 | 15.1 | 1.30 * 10-6 | 3.66 |
| 18.6 | Child | 2.03 * 10-5 | 1.50 | 0.76 * 10-9 | 15.1 | 1.71 * 10-6 | 3.66 | |
| Cu | 24.5 | Adult | 1.43* 10-5 | 2.18 *10-9 | 0.57 *10-7 | |||
| 24.5 | Child | 2.68 * 10-5 | 1.00 * 10-9 | 0.73 * 10-7 | ||||
| Cr | 268.9 | Adult | 1.57 * 10-4 | 5*10-1 | 2.39 * 10-8 | 42.0 | 0.62 *10-6 | |
| 268.9 | Child | 2.94 * 10-4 | 5*10-1 | 1.10 * 10-8 | 42.0 | 0.8 * 10-6 | ||
| Cd | 1.1 | Adult | 6.4 * 10-7 | 0.09 * 10-9 | 6.3 | 0.02 *10-7 | ||
| 1.1 | Child | 1.20 * 10-6 | 0.04 * 10-9 | 6.3 | 0.03 * 10-7 | |||
| Co | 29.5 | Adult | 1.73 * 10-5 | 2.62 * 10-9 | 0.06 * 10-6 | |||
| 29.5 | Child | 3.23 * 10-5 | 1.21 * 10-9 | 0.08 * 10-6 | ||||
| Mn | 823.1 | Adult | 4.83 * 10-4 | 7.32 * 10-8 | 1.92 * 10-6 | |||
| 823.1 | Child | 9.01 * 10-4 | 3.37 * 10-8 | 2.46 * 10-6 | ||||
| Ni | 145.2 | Adult | 8.52 * 10-5 | 1.29 * 10-8 | 8.4*10-1 | 0.33 * 10-6 | ||
| 145.2 | Child | 1.59 * 10-4 | 5.95 * 10-9 | 8.4*10-1 | 0.43 * 10-6 | |||
| Pb | 137.9 | Adult | 8.09 * 10-5 | 8.50 *10-3 | 1.22 * 10-8 | 4.2*10-2 | 0.32 * 10-6 | |
| 137.9 | Child | 1.51 * 10-4 | 8.50*10-3 | 5.65 * 10-9 | 4.2*10-2 | 0.41 * 10-6 | ||
| Zn | 76.1 | Adult | 4.46 * 10-5 | 6.77 * 10-9 | 0.17 * 10-6 | |||
| 76.1 | Child | 8.33 * 10-5 | 3.12 * 10-9 | 0.22 * 10-6 |
Table text extracted from the original PDF; superscript letters are shown inline. The original table image is below.
View original table image
| Metals | Age | CDI ing | CDI inh | CDI dermal | ΣCR |
|---|---|---|---|---|---|
| As | Adult | 0.587 | 0.089 | 0.07 | 2.09 * 10-5 |
| Child | 1.095 | 0.041 | 0.092 | 3.67 * 10-5 | |
| Cu | Adult | 0.587 | 0.089 | 0.00234 | |
| Child | 1.095 | 0.041 | 0.003 | ||
| Cr | Adult | 0.587 | 0.089 | 0.00234 | 7.95 * 10-5 |
| Child | 1.095 | 0.041 | 0.003 | 1.4 * 10-4 | |
| Cd | Adult | 0.587 | 0.089 | 0.00234 | 5.6 * 10-10 |
| Child | 1.095 | 0.041 | 0.003 | 2.5 * 10-10 | |
| Co | Adult | 0.587 | 0.089 | 0.00234 | |
| Child | 1.095 | 0.041 | 0.003 | ||
| Mn | Adult | 0.587 | 0.089 | 0.00234 | |
| Child | 1.095 | 0.041 | 0.003 | ||
| Ni | Adult | 0.587 | 0.089 | 0.00234 | 5.41 * 10-8 |
| Child | 1.095 | 0.041 | 0.003 | 2.49 * 10-8 | |
| Pb | Adult | 0.587 | 0.089 | 0.00234 | 6.88 *10-7 |
| Child | 1.095 | 0.041 | 0.003 | 1.28 * 10-6 | |
| Zn | Adult | 0.587 | 0.089 | 0.00234 | |
| Child | 1.095 | 0.041 | 0.003 |
Table text extracted from the original PDF; superscript letters are shown inline. The original table image is below.
View original table image
References
31 in the original paper- El-Sharkawy M, Alotaibi MO, Li J, Du D, Mahmoud E. Heavy metal pollution in coastal environments: ecological implications and management strategies: a review. Sustainability. 2025;17(3):1-23.
- Li Y, Ye Z, Yu Y, Li Y, Jiang J, Wang L, et al. A combined method for human health risk area identification of heavy metals in urban environments. Journal of Hazardous Materials. 2023;449:131067.
- Holmes RJ, Lu Y, Lu L. Introduction: overview of the global iron ore industry. In: Iron ore: mineralogy, processing and environmental sustainability. Amsterdam: Elsevier; 2021. p. 1-12. doi:10.1016/B9780-12-820226-5.00023-9.
- Okeke OR, Nwanya KO, Ezeagwu PC, Aniobi CC, Ezejiofor CC. Effect of storage duration on the microbiological and heavy metal levels in sachet water samples consumed within Enugu metropolis. Journal of Current Research in Food Science. 2024;5(1):71-7.
- Zuo H, Ma X, Yang K, Chen Y, Chen J, Guo Y, et al. Distribution and risk assessment of metals in surface water and sediment in the upper reaches of the Yellow River, China. Soil and Sediment Contamination: An International Journal. 2016;25(8):917-940. doi:10.1080/15320383.2016.12249.
- Fu J, Zhao C, Luo Y, Liu C, Kyzas GZ, Luo Y, et al. Heavy metals in surface sediments of the Jialu River, China: their relations to environmental factors. Journal of Hazardous Materials. 2014;270:102-109. doi:10.1016/j.jhazmat.2014.01.044.
- Haghighizadeh A, Rajabi O, Nezarat A, Hajyani Z, Haghmohammadi M, Hedayatikhah S, et al. Comprehensive analysis of heavy metal soil contamination in mining environments: impacts, monitoring techniques, and remediation strategies. Arabian Journal of Chemistry. 2024;5:105777. doi:10.1016/j.arabjc.2024.105777.
- Jassim SZ, Goff JC. Geology of Iraq. 1st ed. Prague: Dolin; Brno: Moravian Museum; 2006. p.179-197.
- Sezgin N, Ozcan HK, Demir G, Nemlioglu S, Bayat C. Determination of heavy metal concentrations in street dusts in Istanbul E-5 highway. Environment International. 2004;29(7):979-985.
- Müller G. Index of geoaccumulation in sediment of Rhine River. GeoJournal. 1969;2:108-188.
- Håkanson L. An ecological risk index for aquatic pollution control: a sedimentological approach. Water Research. 1980;14(8):975-1001.
- Qing X, Yutong Z, Shenggao L. Assessment of heavy metal pollution and human health risk in urban of steel industrial city (Anshan), Liaoning, Northeast China. Ecotoxicology and Environmental Safety. 2015;120(11):377-385.
- United States Environmental Protection Agency (US EPA). Regional screening levels. Washington (DC): US EPA; 2016. Available from: http://epaprgs.ornl.gov/chemicals/index.shtml.
- United States Environmental Protection Agency (US EPA). Regional screening level (RSL) summary table. Washington (DC): US EPA; 2017. Available from: https://www.epa.gov/risk/regionalscreening-levels-rslsgeneric-tables.
- Vahter M. Health effects of early life exposure to arsenic. Basic and Clinical Pharmacology and Toxicology. 2008;102(2):204-211.
- Larsen B, Sánchez-Triana E. Global health burden and cost of lead exposure in children and adults: a health impact and economic modelling analysis. The Lancet Planetary Health. 2023;7(10):e831-e840.
- Bansal H. Heavy metal toxicity: a comprehensive review of forms, exposure routes, toxicokinetics, and effects on infants. International Journal of Medical Toxicology and Legal Medicine. 2023;26(1-2):13-24.
- Boahen E. Heavy metal contamination in urban roadside vegetables: origins, exposure pathways, and health implications. Discover Environment. 2024;2(1):145.
- Fadhel MA, Abdulhussein FM. Assessment of the contamination of Baghdad soils with lead element. The Iraqi Geological Journal. 2022;55(1):166-177.
- Sutherland RA. Bed sediment-associated trace metals in an urban stream, Oahu, Hawaii. Environmental Geology. 2000;39:611-627.
- Simex S, Helz G. Regional geochemistry of trace elements in Chesapeake Bay sediments. Environmental Geology. 1981;3(6):315-323.
- Ergin M, Saydam C, Baştürk O, Erdem E, Yoruk R. Heavy metal concentration in surface sediments from two inlets (Golden Horn Estuary and Izmit Bay) of the northeastern Sea of Marmara. Chemical Geology. 1991;91(3):269-285.
- Kabata-Pendias A. Trace elements in soils and plants. 4th ed. Boca Raton: CRC Press, Taylor & Francis Group; 2011. 534 p.
- Kelepertzis E. Investigating the sources and potential health risks of environmental contaminants in the soils and drinking waters from the rural clusters in Thiva area (Greece). Ecotoxicology and Environmental Safety. 2014;100:258-265.
- Parvez SM, Hasan SS, Moniruzzaman M, Hares A, Jahan F, Rahman M, et al. Health risk assessment of humans exposed to soil and dust trace elements from ewaste sites in Bangladesh. Journal of Environmental Exposure Assessment. 2024;3(4):NA.
- United States Environmental Protection Agency (US EPA), Office of Emergency and Remedial Response. Risk assessment guidance for superfund. Washington (DC): US EPA; 1989.
- Al Osman M, Yang F, Massey IY. Exposure routes and health effects of heavy metals on children. Biometals. 2019;32:563-573.
- Mohammed HM, Al-Jumaily HA. Geochemical and environmental evaluation of the copper element in the surface soil and its health effects in selected areas of Kirkuk Governorate. IOP Conference Series: Earth and Environmental Science. 2023;1262(8):082050.
- Al-Obeidi AH, Al-Jumaily HA. Geochemistry and environmental assessment of heavy metals in surface soil in Al-Hawija, southwest Kirkuk. The Iraqi Geological Journal. 2020;53(2C):36-61.
- Al-Jumaily HA. An evaluation performance of potential pollution of arsenic, chromium and cadmium in the roadside soil of Kirkuk City, Northern Iraq. Journal of Geoscience and Environment Protection. 2016;4(9):8094.
- Morozesk M, da C Souza I, Fernandes MN, Soares DCF. Airborne particulate matter in an iron mining city: characterization, cell uptake and cytotoxicity effects of nanoparticles from PM2.5, PM10 and PM20 on human lung cells. Environmental Advances. 2021;6:100125. doi:10.1016/j.envadv.2021.100125.