
Research article · 2025 · Full text
International Journal of Agriculture and Food ScienceDeveloping a scale to study attitude of administrative staff at Agricultural University under methodological lens
Volume 7(9) · Pages 84–88 · DOI: 10.33545/2664844x.2025.v7.i9b.734 ↗
Research areasDigitalization and Economic Development in AgricultureCentral Asia Education and CultureHigher Education Governance and Development
Abstract
Author-writtenThe primary purpose of this study is to design and validate a standardized measuring scale tailored to assess the perceptions of administrative staff at Kerala Agricultural University regarding their occupational roles and engagement with their institutional environment. The study employed mixed methodological approach of online survey with experts and personal face-to face interviews with administrative staff. An initial pool of 52 items was generated through an extensive literature review. These items were evaluated by a panel of 60 experts to determine their scale values and quartile values. Content validity was used to ensure the relevance and appropriateness of the items, resulting in the selection of 21 items for the final attitude scale. The scale's reliability was tested by administering it to 30 individuals outside the main sample group. This research explores the concept of attitude in the workplace, emphasizing its implications for organizational functioning. It also examines the development and utility of an attitude scale as a tool for assessing workforce sentiments. It ensures that the attitude scale is robust, reliable, and valid for its intended use in research or practical applications. This study broadens the understanding of workplace engagement by introducing a validated attitude scale tailored to administrative staff, extending its relevance within organizational behaviour in academic settings. This study offers original value by filling a notable gap in evaluating the attitudes of administrative personnel in academic institution, with a specific focus on Kerala Agricultural University. While much research has focused on faculty or scientific personnel, limited attention has been given to understanding the perceptions and engagement levels of administrative staff, who play a crucial role in institutional functioning
Summary
Source-checkedPlain-language reading of the full paper, prepared with AI and checked against the text. Each point links to the authors' own words.
Why it matters
- Attitude is a key psychological factor that affects how individuals behave, make decisions, and perform in an organizational setting. View evidence ↗
- There is a gap in research regarding the attitudes of administrative staff in academic institutions, as most studies focus on faculty or scientific personnel. View evidence ↗
- Standardized attitude scales are useful tools for organizations to make informed decisions about policy, staff development, and managing change. View evidence ↗
The question
- The study aims to create and validate a standardized scale to measure how administrative staff at Kerala Agricultural University perceive their roles and institutional engagement. View evidence ↗
What they did
- The process began with the creation of an initial pool of 52 items based on a literature review. View evidence ↗
- A pilot test was conducted with 30 administrative staff members who were not part of the expert panel to verify the scale's reliability. View evidence ↗
What they found
- Eleven items were removed from the initial pool because high Q values indicated they were ambiguous. View evidence ↗
- Based on the Item-level Content Validity Index (I-CVI), 9 statements were rejected, 4 were revised, and 28 were deemed appropriate. View evidence ↗
- After applying multi-rater kappa statistics, items with values below 0.74 were removed, leaving 21 items for the final scale. View evidence ↗
- The final scale was confirmed as reliable, achieving a Cronbach's alpha value of 0.90, indicating high internal consistency. View evidence ↗
What it means
- The authors conclude that the validated scale is a valuable tool for both academic research and policymakers to improve performance in similar academic environments. View evidence ↗
Visual summary
1 visualsIllustrations explain the paper; charts are replotted from the paper's own table values.
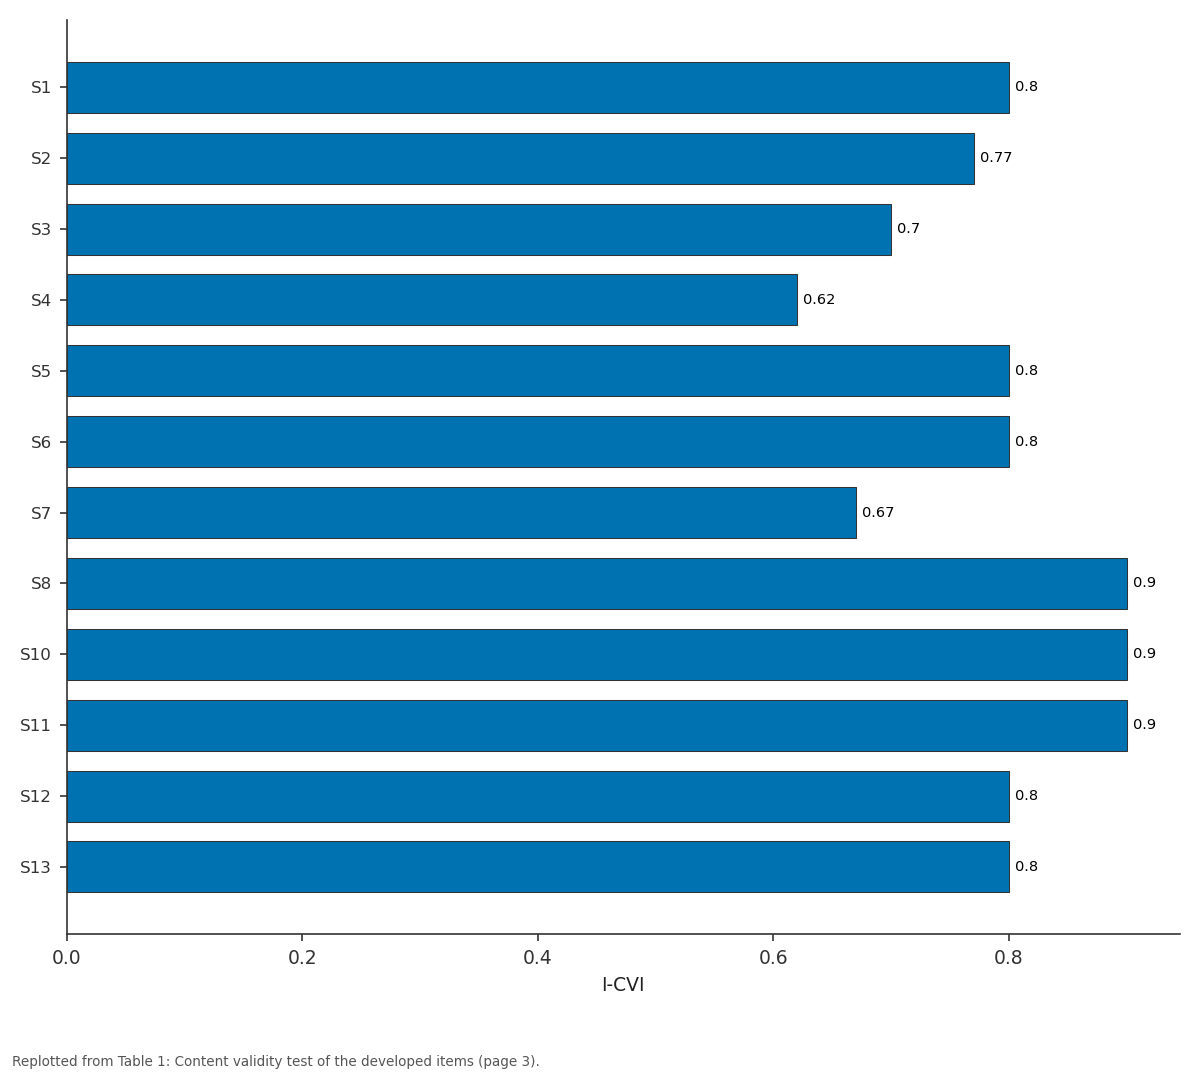
I-CVI: S1 vs S2 vs S3 vs S4 vs S5
Replotted from Table 1 (page 3) of the original paper. Every bar is the paper's own table value.
View source evidence ↗Figures & tables
From the original paper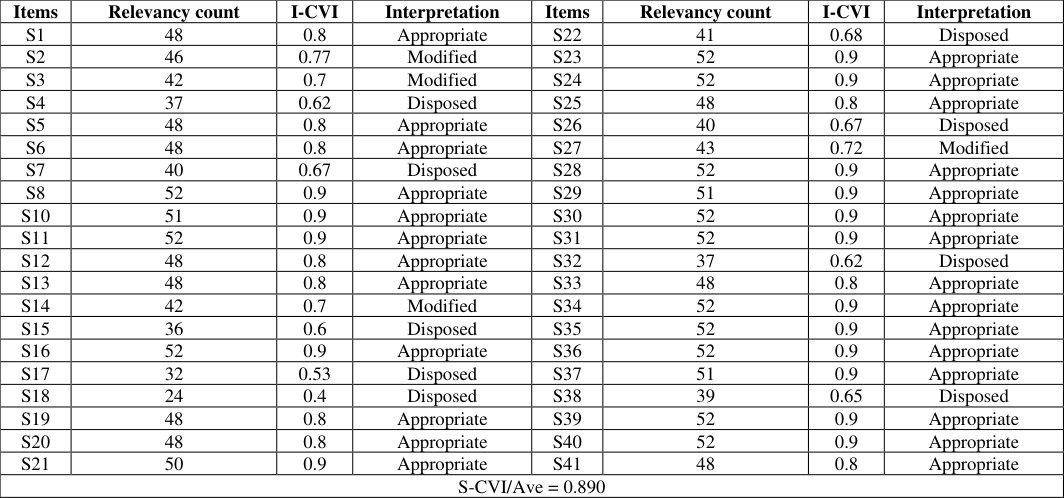 Table 1
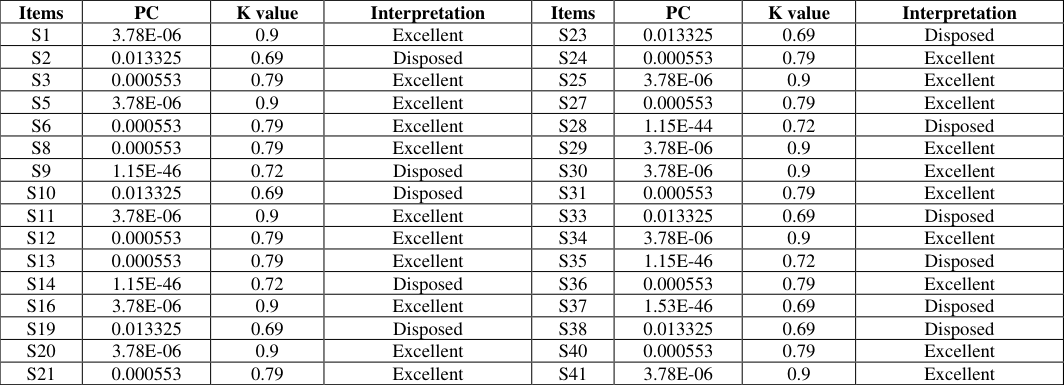 Table 2
Introduction
Attitude is a fundamental psychological construct that significantly influences individual behaviour, decision-making, and performance within organizations. As a psychological construct, attitude encompasses an individual's thoughts, and feelings toward various aspects of their work environment including tasks, colleagues, leadership, and organizational policies. Understanding employees' attitudes is essential for fostering a positive organizational climate, enhancing job satisfaction, and promoting productivity. It reflects an individual's evaluations, feelings, and tendencies toward various elements of their work environment, including roles, colleagues, supervisors, and institutional values (Robbins and Judge, 2019) [4] . In academic and professional environment, positive attitudes are often associated with enhanced job satisfaction, organizational commitment, and overall productivity (Luthans, 2011) [2] . To effectively understand and manage these attitudinal variables, organizations increasingly rely on standardized measurement tools such as attitude scales. These instruments help quantify subjective perceptions, offering valuable insights into the collective mindset of employees (Oppenheim, 2000) [3] . Through systematic assessment, attitude scales facilitate informed decision-making in areas such as staff development, policy formulation, and change management (Schriesheim and Tsui, 1980) [5] . Furthermore, they serve as diagnostic tools that can highlight potential areas of dissatisfaction or resistance, enabling proactive interventions that support a healthier organizational culture (Ajzen, 2001) [1] . [6] .
Item collection:
A preliminary pool of statements relevant to the study was developed from literature, previous studies, and expert consultations. These statements were refined based on established criteria for attitude statements recommended by Edwards (1957) [7] , Thurstone and Chave (1929) [8] , Wang (1932) [9] , Likert (1932) [10] , Bird (1940) [11] , and Edwards and Kilpatrick (1948) [12] . 4. Item analysis: The items were evaluated using a fivepoint response scale ranging from 'Most Relevant (MOR)', 'More Relevant (MR)', 'Relevant (R)', 'Less Relevant (LR)', and 'Not Relevant (NR)' assigning a score of 4,3,2,1 and 0 respectively by a panel of experts through postal correspondence, Google Forms, and inperson interactions. This screening process was designed to eliminate weak or irrelevant content. Evaluators were also encouraged to suggest modifications, additions, or deletions to improve the quality of the statements.
Determination of scale value and quartile value:
Based on the ratings, the median and Q value were computed for each statement, with the median serving as the scale value assigned to that statement. The scale value was worked out with the help of formula:
Where, S -median or scale value of the statement 끫뢲 -the lower limit of the interval in which the median falls ∑끫뢆 끫뢞 -the sum of the proportions below the interval in which the median falls 끫뢆 끫룈 -the proportion within the interval in which the median falls 끫뢬 -the width of the interval and is assumed to be equal to one The inter quartile range or Q value for each statement was worked out by the formula: Q = C 75 -C 25 C 75 was the 75 th centile and calculated by the formula:
where, l -the lower limit of the interval in which the 75 th centile falls 끫뢞 -the sum proportion below the interval in which the 75th centile falls 끫뢺 끫룈 -the proportion within the interval in which the 75th centile falls 25 was the 25 th centile and estimated by the formula:
where, l -the lower limit of the interval in which the 25 th centile falls ∑끫뢆 끫뢞 -the sum proportion below the interval in which the 25th centile falls 끫뢺 끫룈 -the proportion within the interval in which the 25th centile falls A higher Q value suggests that a statement was ambiguous or difficult to rate. Therefore, statements with high Q values were generally considered for elimination. In cases where multiple statements had the same scale value, preference was given to those with lower Q values, indicating higher clarity and reliability.
Standardization of the scale: Reliability and validity were key factors in scale construction, ensuring the tool consistently and accurately measured the concept it was designed to assess.
Validity test of the scale:
The Item-level Content Validity Index (I-CVI) was used to assess the relevance of individual scale items by calculating the proportion of experts who rated each item as relevant. The I-CVI ranged from 0 to 1, with higher values indicating stronger agreement (Abdollahpour et al., 2010) [13] . Items with an I-CVI below 0.7 were considered for elimination, those scoring between 0.7 and 0.79 required revision, and items with an I-CVI above 0.79 were deemed suitable for inclusion in the study. The Scale-level CVI (S-CVI/Ave) was obtained by averaging the I-CVIs across all items. An S-CVI/Ave of 0.9 or above reflected excellent content validity, indicating strong expert consensus on item relevance.
To address potential limitations of CVI, (Wynd et al., 2003) [14] recommended supplementing it with multi-rater kappa statistics, which account for chance agreement and provide a more accurate measure of inter-rater reliability. For the estimation of modified kappa value, each items probability of chance agreements was calculated by the formula:
where, N -number of experts in a panel A -number of panelists who agree that the item is relevant. Finally, kappa value is estimated by formula:
where, I-CVI -item level content validity index P C -probability of chance agreement.
Kappa statistic values were interpreted as follows: 0.40 to 0.59 indicated fair agreement, 0.60 to 0.74 signified good agreement, and values above 0.74 were considered excellent. Items falling within the good to excellent range were retained for further analysis.
Reliability test of the scale:
To statistically verify the reliability of the scale, a pilot test was conducted with 30 administrative staff who were not part of the main study sample. Participants rated each statement on a five-point Likert scale, ranging from "strongly agree" (5) to "strongly disagree" (1) for positive items, with reverse scoring applied to negative items. Reliability was measured using Cronbach's alpha, as proposed by (Cronbach, 1951) [15] , to assess the internal consistency of the scale. This coefficient ranges from 0 to 1, with higher values indicating greater reliability. The Cronbach's alpha was computed using the following formula:
where, N -number of items 끫롬 ̅ -average covariance between item pairs 끫뢒 � -average variance. The proposed scale containing statements were presented to the selected respondents. Those statements with Cronbach's alpha value greater than 0.7 is acceptable and excellent whereas those with less than 0.7 is poor and thus rejected.
Finalizing the scale: The attitude scale was developed using the Scale Product Method, originally introduced by (Eysenck and Crown, 1949.) [16] , which integrates Likert's method with Thurstone's Equal Appearing Interval Scale for item selection. This statistical technique is commonly employed in psychological research to analyse personality traits. In this method, individual scores are calculated by multiplying the Likert response value by the scale value determined through Thurstone's approach for each item. The sum of these products across all items provides a quantitative measure of a respondent's attitude. Based on the scores obtained by the respondents, they were categorized into low, medium and high attitude.
Result and discussion: A set of 52 distinct statements was initially developed and distributed to 100 subject-matter experts. However, only 60 judges responded within the given timeframe. Using the relevancy scores provided, scale values and quartile (Q) values were calculated for each statement. Eleven statements with high Q values and scale values were identified and subsequently excluded due to ambiguity. The remaining 41 statements advanced to the next stage of screening. These statements then underwent a standardization process, including a content validity assessment at both the item level (I-CVI) and the scale level (S-CVI/Ave). 1., shows that 9 statements having I-CVI value less than 0.70 were rejected, 4 statements having value between 0.70 and 0.79 were revised and 28 statements having value greater than 0.79 were found to be appropriate for the scale. Therefore, 32 statements were retained for the scale development. Since, the S-CVI/Ave score greater than 0.89, it indicates that the scale's overall content validity is high. To overcome the restrictions in content validity, multirater kappa statistics value was estimated. The result of Kappa value in Table 2. shows that those items with kappa value greater than 0.74 were excellent and those items with kappa value less than 0.74 were removed. Thus 21 items were retained in the scale construction. For checking the reliability of the constructed scale, the 21 statements were subjected for a pilot testing in 30 nonsample respondents i.e., administrative staff. The statements were presented to respondents using a five-point continuum: Strongly Agree (SA), Agree (A), Undecided (UD), Disagree (D), and Strongly Disagree (SD), assigned scores of 4, 3, 2, 1, and 0, respectively for positive statements, and 0, 1, 2, 3, and 4, respectively for negative statements. Cronbach's alpha method was used to test reliability of the constructed scale. The Cronbach's alpha value obtained for the scale was 0.90, which had higher internal consistency of the scale. Thus, the scale was confirmed as reliable.
| Items | PC | K value | Interpretation | Items | PC | K value | Interpretation |
|---|---|---|---|---|---|---|---|
| S1 | 3.78E-06 | 0.9 | Excellent | S23 | 0.013325 | 0.69 | Disposed |
| S2 | 0.013325 | 0.69 | Disposed | S24 | 0.000553 | 0.79 | Excellent |
| S3 | 0.000553 | 0.79 | Excellent | S25 | 3.78E-06 | 0.9 | Excellent |
| S5 | 3.78E-06 | 0.9 | Excellent | S27 | 0.000553 | 0.79 | Excellent |
| S6 | 0.000553 | 0.79 | Excellent | S28 | 1.15E-44 | 0.72 | Disposed |
| S8 | 0.000553 | 0.79 | Excellent | S29 | 3.78E-06 | 0.9 | Excellent |
| S9 | 1.15E-46 | 0.72 | Disposed | S30 | 3.78E-06 | 0.9 | Excellent |
| S10 | 0.013325 | 0.69 | Disposed | S31 | 0.000553 | 0.79 | Excellent |
| S11 | 3.78E-06 | 0.9 | Excellent | S33 | 0.013325 | 0.69 | Disposed |
| S12 | 0.000553 | 0.79 | Excellent | S34 | 3.78E-06 | 0.9 | Excellent |
| S13 | 0.000553 | 0.79 | Excellent | S35 | 1.15E-46 | 0.72 | Disposed |
| S14 | 1.15E-46 | 0.72 | Disposed | S36 | 0.000553 | 0.79 | Excellent |
| S16 | 3.78E-06 | 0.9 | Excellent | S37 | 1.53E-46 | 0.69 | Disposed |
| S19 | 0.013325 | 0.69 | Disposed | S38 | 0.013325 | 0.69 | Disposed |
| S20 | 3.78E-06 | 0.9 | Excellent | S40 | 0.000553 | 0.79 | Excellent |
| S21 | 0.000553 | 0.79 | Excellent | S41 | 3.78E-06 | 0.9 | Excellent |
Table text extracted from the original PDF; superscript letters are shown inline. The original table image is below.
View original table image
Conclusion
The development of the attitude scale marks a significant step toward understanding the work-related attitudes of administrative staff within Kerala Agricultural University. By employing a structured methodological approach such as combining expert judgment, item analysis, and validity and reliability testing, the study resulted in a refined set of scale items that accurately capture key dimensions of job perception and institutional involvement. This scale not only contributes to academic research but also offers practical value for administrative staffs and policymakers aiming to assess and improve performance across similar academic settings.
Agree (SA), Agree (A), Neutral (N), Disagree (D), Strongly Disagree (SD)]
Figures and tables from the paper
| Items | Relevancy count | I-CVI | Interpretation | Items | Relevancy count | I-CVI | Interpretation |
|---|---|---|---|---|---|---|---|
| S1 | 48 | 0.8 | Appropriate | S22 | 41 | 0.68 | Disposed |
| S2 | 46 | 0.77 | Modified | S23 | 52 | 0.9 | Appropriate |
| S3 | 42 | 0.7 | Modified | S24 | 52 | 0.9 | Appropriate |
| S4 | 37 | 0.62 | Disposed | S25 | 48 | 0.8 | Appropriate |
| S5 | 48 | 0.8 | Appropriate | S26 | 40 | 0.67 | Disposed |
| S6 | 48 | 0.8 | Appropriate | S27 | 43 | 0.72 | Modified |
| S7 | 40 | 0.67 | Disposed | S28 | 52 | 0.9 | Appropriate |
| S8 | 52 | 0.9 | Appropriate | S29 | 51 | 0.9 | Appropriate |
| S10 | 51 | 0.9 | Appropriate | S30 | 52 | 0.9 | Appropriate |
| S11 | 52 | 0.9 | Appropriate | S31 | 52 | 0.9 | Appropriate |
| S12 | 48 | 0.8 | Appropriate | S32 | 37 | 0.62 | Disposed |
| S13 | 48 | 0.8 | Appropriate | S33 | 48 | 0.8 | Appropriate |
| S14 | 42 | 0.7 | Modified | S34 | 52 | 0.9 | Appropriate |
| S15 | 36 | 0.6 | Disposed | S35 | 52 | 0.9 | Appropriate |
| S16 | 52 | 0.9 | Appropriate | S36 | 52 | 0.9 | Appropriate |
| S17 | 32 | 0.53 | Disposed | S37 | 51 | 0.9 | Appropriate |
| S18 | 24 | 0.4 | Disposed | S38 | 39 | 0.65 | Disposed |
| S19 | 48 | 0.8 | Appropriate | S39 | 52 | 0.9 | Appropriate |
| S20 | 48 | 0.8 | Appropriate | S40 | 52 | 0.9 | Appropriate |
| S21 | 50 | 0.9 | Appropriate | S41 | 48 | 0.8 | Appropriate |
| S-CVI/Ave = 0.890 |
Table text extracted from the original PDF; superscript letters are shown inline. The original table image is below.
View original table image
References
16 in the original paper- Ajzen I. Nature and operation of attitudes. Annu Rev Psychol. 2001;52(1):27-58.
- Luthans F. Organizational behavior: An evidence-based approach. 12th ed. New York: McGraw-Hill Education; 2011.
- Oppenheim AN. Questionnaire design, interviewing and attitude measurement. London: Continuum; 2000.
- Robbins SP, Judge TA. Organizational behaviour. 18th ed. London: Pearson Education; 2019.
- Schriesheim CA, Tsui AS. Development and validation of a short satisfaction instrument for use in survey feedback interventions. Group Organ Stud. 1980;5(4):437-46.
- Meenambigai J, Lokeshwaran D, Durairaj S. Attitude scale construction methodology in extension education research. In: Recent trends in agricultural extension research. 1st ed. Chapter 8. 2023. p. 66-79.
- Edwards AL. Techniques of attitude scale construction. New York: Appleton Century Crofts Inc.; 1957.
- Thurstone LL, Chave EG. The measurement of attitude. Chicago: University of Chicago Press; 1929. p. 39-40.
- Wang KA. Suggested criteria for writing attitude statements. J Soc Psychol. 1932;3:367-73.
- Likert RA. A technique for the measurement of attitude. Arch Psychol. 1932;22(140):44-53.
- Bird C. Social psychology. New York: Appleton Century Crofts Inc.; 1940. 155 p.
- Edwards AL, Kilpatrick FP. A technique for construction of attitude scale. J Appl Psychol. 1948;32:374-84.
- Abdollahpour E, Nejat S, Nourozian M, Majdzadeh R. The process of content validity in instrument development. Iran J Epidemiol. 2010;6(4):66-74.
- Wynd CA, Schmidt B, Schaefer MA. Two quantitative approaches for estimating content validity. West J Nurs Res. 2003;25(5):508-18.
- Cronbach LJ. Coefficient alpha and the internal structure of tests. Psychometrika. 1951;16:297-334.
- Eysenck HJ, Crown S. An experimental study in opinion attitude methodology. Int J Opin Attitude Res. 1949;3:47-86.