
Research article · 2025 · Full text
International Journal of Agriculture and Food ScienceStudy on genetic diversity in rice (oryza sativa L.) Germplasm
Volume 7(9) · Pages 01–08 · DOI: 10.33545/2664844x.2025.v7.i9a.724 ↗
Research areasGABA and Rice Research
Abstract
Author-writtenIn 2024, the present investigation Study on Genetic Diversity in Rice (Oryza sativa L.) Germplasm. Five plants selected at random from every genotype were examined for 13 yield- related traits. ANOVA results for all traits identified considerable genetic heterogeneity favourable for fostering yield improvement through breeding. These high-yielding genotypes SHUATS DHAN-1, INDRANI, AK DHAN, D DHAN-39, and JARAVA were characterized by pronounced genetic progress, elevated heritability, and pronounced variability. Their adaptation to a variety of conditions was highlighted by the clear genetic differences found in variations in phenotypic traits, including as blooming time, maturity, plant height, and yield components. Other promising lines KHAYAM DHAN, FALGUNA, KRISHNA HAMSA, and HMT displayed outstanding performance in vital yield-related traits and are therefore recommended for direct selection and incorporation into breeding programs. Cluster analysis further emphasised the genetic diversity, noting that Cluster II possesses considerable yield potential and considerable separation from other clusters most notably from Cluster VI indicating abundant opportunity for heterotic hybrid development.
Summary
Source-checkedPlain-language reading of the full paper, prepared with AI and checked against the text. Each point links to the authors' own words.
Why it matters
- Rice is a critical crop for India's economy and is the primary food source for nearly two-thirds of the population. View evidence ↗
- In Uttar Pradesh, rice productivity is currently 2.7 t/ha, creating an urgent need for high-yielding hybrid varieties to increase output. View evidence ↗
- The expected growth of India's population from 120 crores to nearly 150 crores by 2025 necessitates the development of high-yielding rice varieties. View evidence ↗
The question
- The study aimed to investigate the genetic diversity within rice (Oryza sativa L.) germplasm. View evidence ↗
What they did
- The experiment was conducted during the 2024 kharif season at the Sam Higginbottom University of Agriculture, Technology and Sciences in Prayagraj, Naini. View evidence ↗
- The researchers used 42 different rice genotypes as their experimental material. View evidence ↗
- The study used a randomized block design with three replicates, maintaining 15 cm spacing between plants and 20 cm between rows. View evidence ↗
- The researchers measured 13 yield-related traits, averaging data from fifteen plants per genotype across replicates. View evidence ↗
What they found
- Analysis of variance showed that all 13 traits were highly significant (p < 0.01), indicating substantial genetic heterogeneity among the 42 genotypes. View evidence ↗
- The highest grain yields were observed in SHUATS DHAN-1 (22.36 g), followed by INDRANI (17.61 g), AK DHAN (16.80 g), D DHAN-39 (16.48 g), and JARAVA (15.13 g). View evidence ↗
- High genotypic coefficients of variation (GCV) were found for grain yield per hill (27.41%), harvest index (26.57%), and test weight (24.34%), suggesting strong genetic control over these traits. View evidence ↗
- Traits such as days to maturity (99.56%), test weight (99.45%), and days to 50% flowering (98.50%) showed very high heritability, making them suitable for early selection. View evidence ↗
- The highest genetic advance as percent mean (GAM) was recorded for grain yield per hill (53.39%) and test weight (50.01%). View evidence ↗
- The greatest genetic distance was found between Cluster II and Cluster VI (6.321), indicating high diversity between these groups. View evidence ↗
- Days to Maturity was the primary driver of genetic diversity, contributing 56.80% to the total divergence. View evidence ↗
What it means
- The authors recommend SHUATS DHAN-1, KHAYAM DHAN, D DHAN-39, FALGUNA, KRISHNA HAMSA, and HMT for use in breeding programs due to their superior yield traits. View evidence ↗
- The authors conclude that high-yielding hybrids can be developed by crossing parents from Clusters II and VI due to their significant genetic divergence. View evidence ↗
Visual summary
2 visualsIllustrations explain the paper; charts are replotted from the paper's own table values.
Genetic Clustering of Rice Genotypes
AI-generated conceptual illustration (rice plants (Oryza sativa L.)). It explains the idea and does not show study data.
View source evidence ↗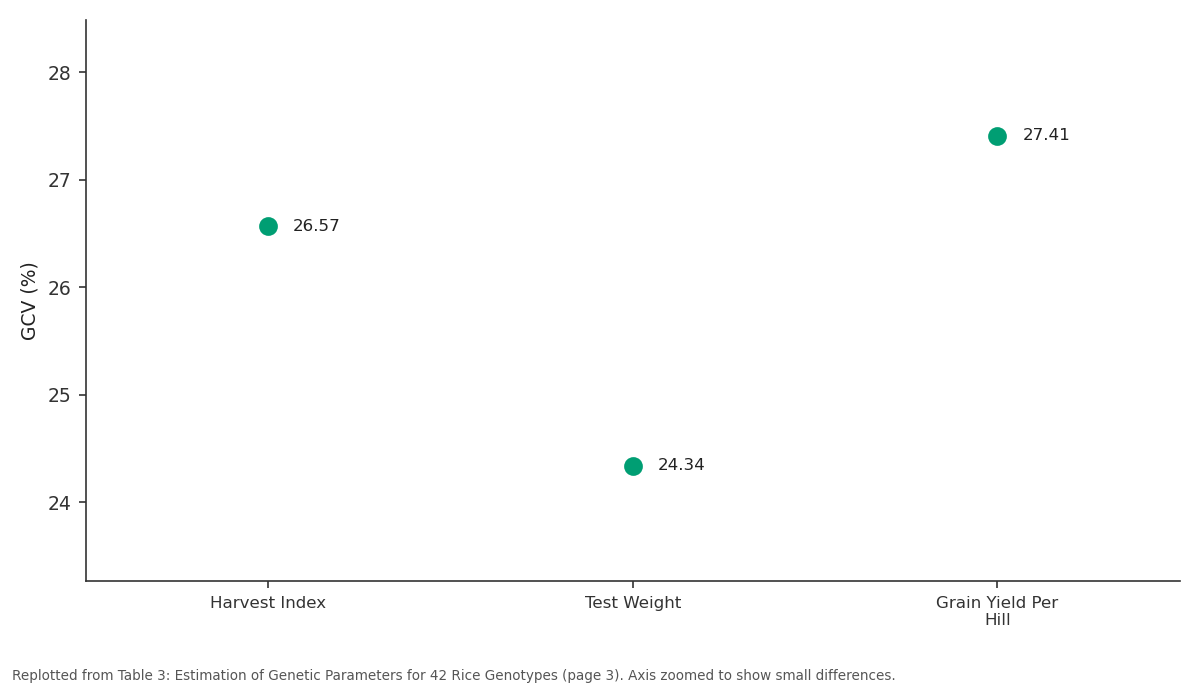
GCV: Harvest Index vs Test Weight vs Grain Yield Per Hill
Replotted from Table 3 (page 3) of the original paper. Every bar is the paper's own table value.
View source evidence ↗Figures & tables
From the original paper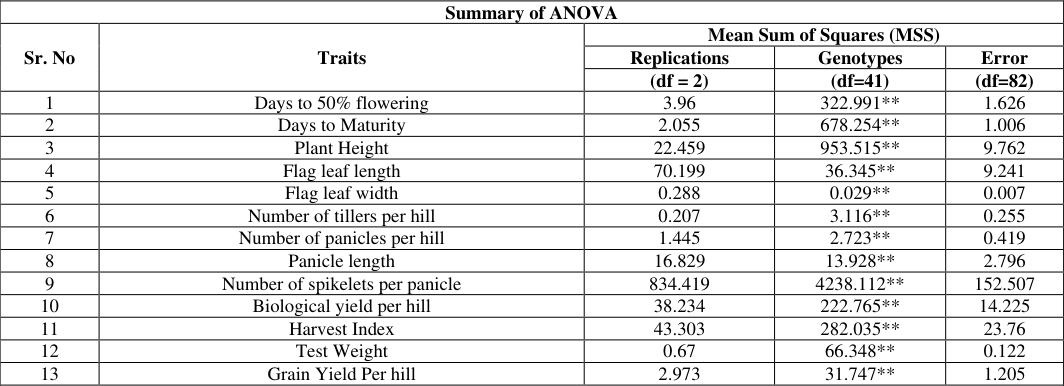 Table 1
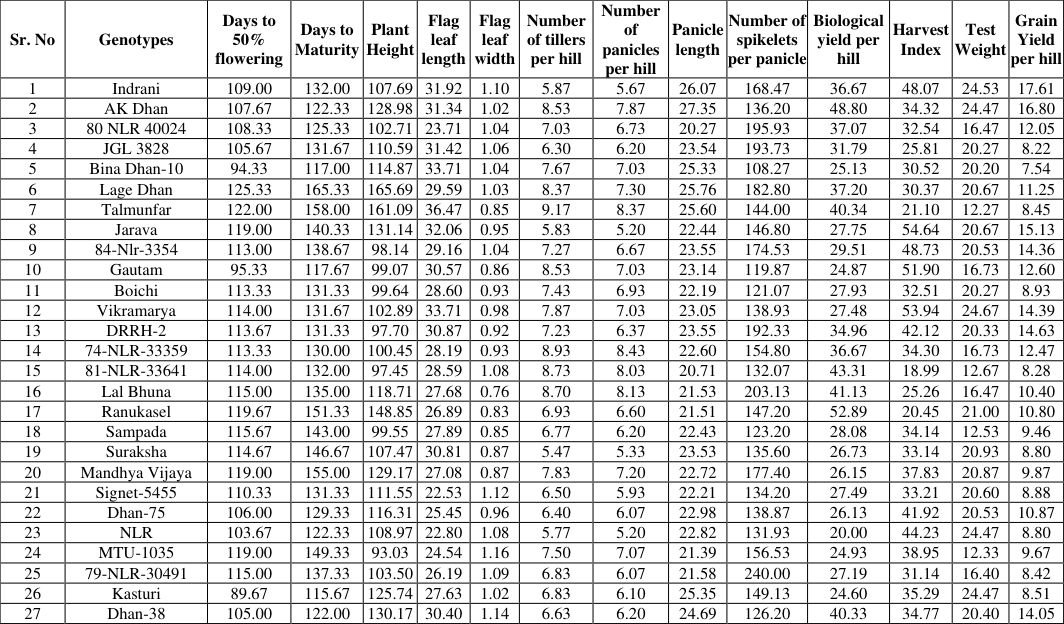 Table 2
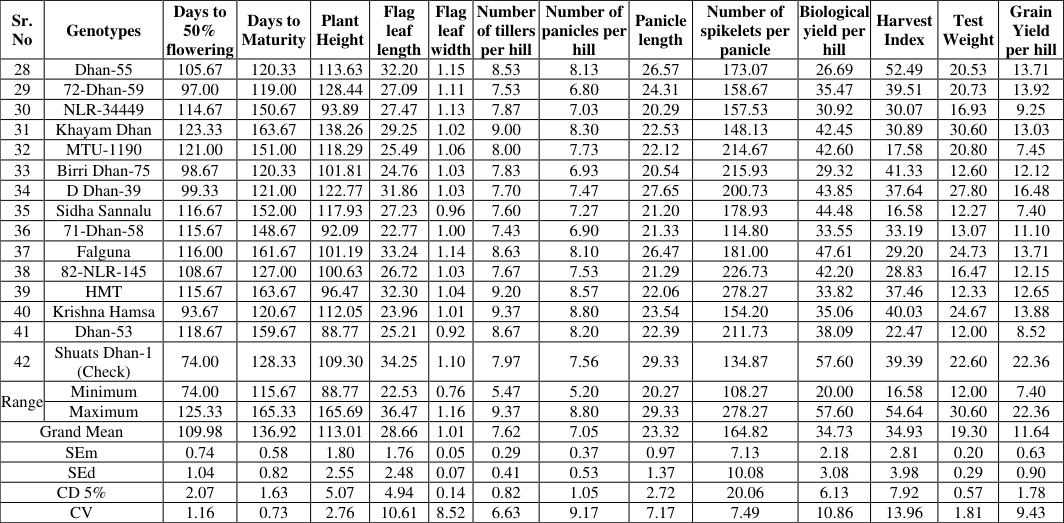 Table 2
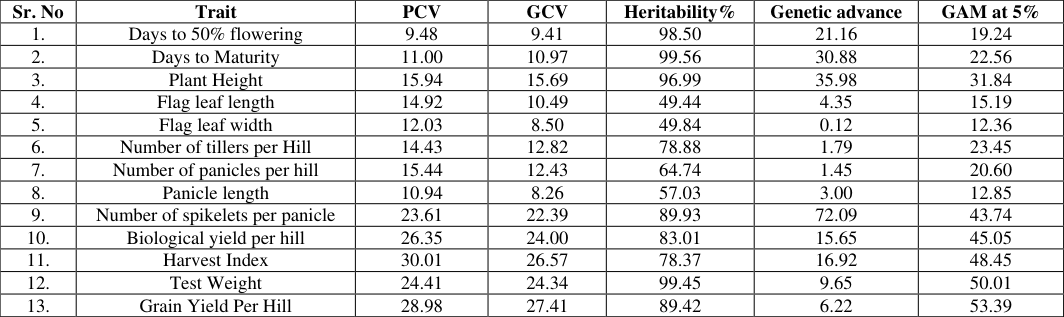 Table 3
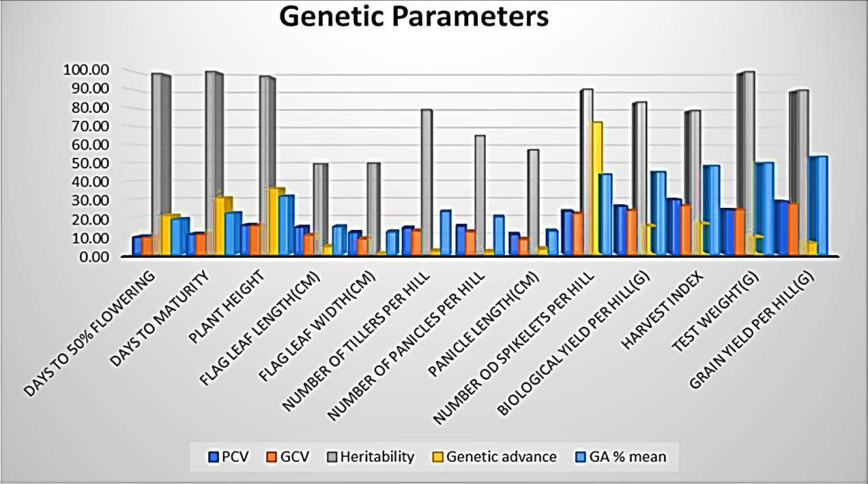 Figure 1
 Table 4
 Table 5
 Table 6
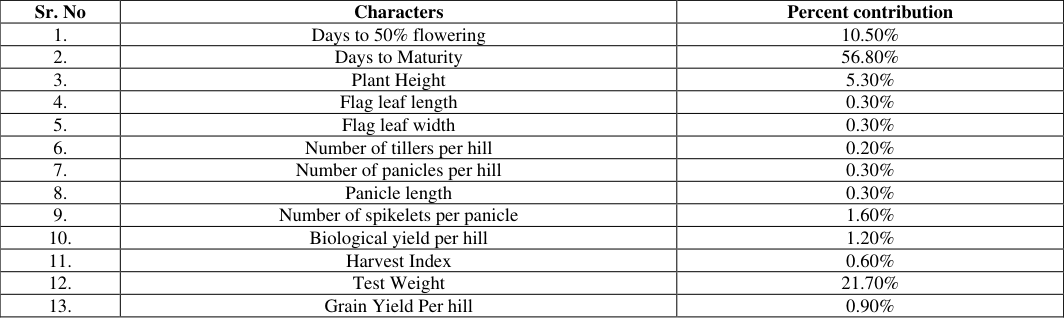 Table 7
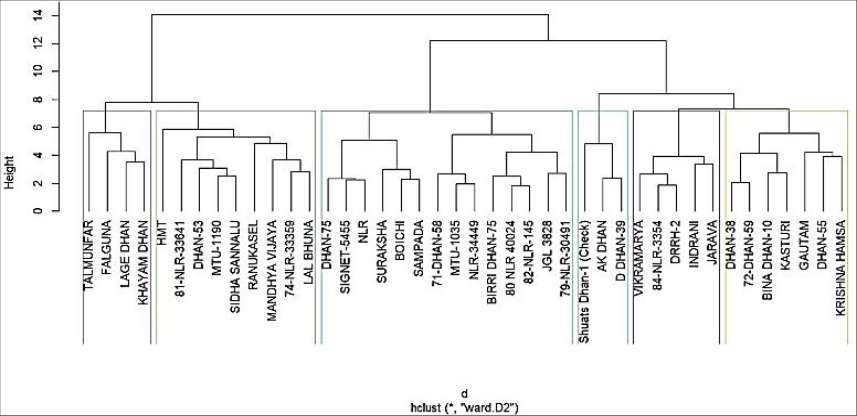 Figure 2
Introduction
Rice (Oryza sativa L.), a true diploid that carries 2n=24 chromosomes, has been cultivated by humankind for more than 10,000 years. Cultivated varieties are cataloged into three subspecies indica, japonica, and javanica (Vinoth et al. 2016) [30] and (Vivek et al. 2005) [31] . Indica cultivar is propagated in tropical and subtropical regions worldwide, japonica across the entire temperate zone, and javanica chiefly within Indonesia by (Veludandi Sumanth et al. 2017) [29] and (Singh et al. 2011) [22] . Rice, a day-neutral autogamous crop chiefly consumed by almost two-thirds of India's populace, plays a pivotal role in the country's economy by (Burton & Devane 1953) [5] and (Kumar et al. 2017) [13] . Rice's nutritional composition consists of mostly carbohydrates (80%) alongside 7-8% protein (an amino-acid spectrum revealing high concentrations of glutamic and aspartic acids, with lysine the highest quality amino acid in cereal proteins present at 3.8% (Juliano et al. 1985) [35] . Rice cultivation in Uttar Pradesh occupies roughly 5.9 million hectares. The cropping intensity stands at 153%. In production, the state captures the top position nationally by (Islam et al. 2015) [10] and (Sujitha et al. 2020) [27] . With production and productivity standing at respective levels of 12.27 mt and 2.7 t/ha, it becomes evident that Uttar Pradesh's rice cultivation urgently requires amplifying productivity a goal that will be fulfilled solely by cultivating high-yielding hybrid varieties (Agriculture at a Glance, 2022) [2] . India's population presently stands at 120 crores. By 2025, the population is expected to reach close to 150 crores. Accordingly, there is a necessity to create high-yielding varieties [36] .
The area experiences heavy rainfall, with most precipitation falling in the months of June to September. A considerable share of the rainfall arrives under the south-west monsoon, chiefly during July and August. Soil PH values lay between 7.3 and 7.6, whereas the aggregated rainfall amounted to 732.40 mm. The experiment had 3 replicates and employed a randomized block design (RBD). The amount of space between plants was measured to be 15 cm and the row spacing was 20 cm. Information was collected on a number of characteristics. Days to ripeness and 50% blooming Flag leaf width (cm), length (cm), and height (cm) of the plant Data from fifteen plants of each genotype were averaged replication-wise, and the data was used for statistical analysis. The data included a total number of tillers per hill, number of panicles per hill, panicle length (cm), spikelets per panicle, test weight (g), harvest index (%), biological yield per hill (g), and grain yield per hill (g).
Experiment Materials
In this study, the experimental material was 42 rice genotypes of the Department of Genetics and Plant Breeding, SHUATS Prayagraj. 1. The 42 distinct rice genotypes' mean sum of squares for the 13 distinct traits were highly significant at the 0.01 level of significance, suggesting that the genotypes differ greatly in terms of genetic makeup. The data in Table 1 indicates that there is enough room in the current gene pool to choose lines with promising yield and component characteristics. The results showed that there was significant genetic variation between genotypes, highlighting the importance of genotype differences in plant breeding.
| Summary of ANOVA | — | — | — | — |
|---|---|---|---|---|
| Sr. No | Traits | Mean Sum of Squares (MSS) | ||
| Replications | Genotypes | Error | ||
| (df = 2) | (df=41) | (df=82) | ||
| 1 | Days to 50% flowering | 3.96 | 322.991** | 1.626 |
| 2 | Days to Maturity | 2.055 | 678.254** | 1.006 |
| 3 | Plant Height | 22.459 | 953.515** | 9.762 |
| 4 | Flag leaf length | 70.199 | 36.345** | 9.241 |
| 5 | Flag leaf width | 0.288 | 0.029** | 0.007 |
| 6 | Number of tillers per hill | 0.207 | 3.116** | 0.255 |
| 7 | Number of panicles per hill | 1.445 | 2.723** | 0.419 |
| 8 | Panicle length | 16.829 | 13.928** | 2.796 |
| 9 | Number of spikelets per panicle | 834.419 | 4238.112** | 152.507 |
| 10 | Biological yield per hill | 38.234 | 222.765** | 14.225 |
| 11 | Harvest Index | 43.303 | 282.035** | 23.76 |
| 12 | Test Weight | 0.67 | 66.348** | 0.122 |
| 13 | Grain Yield Per hill | 2.973 | 31.747** | 1.205 |
Table text extracted from the original PDF; superscript letters are shown inline. The original table image is below.
View original table image
Results and Discussion
Because it provides a solid foundation for choosing superior genetic compositions, this variability explains upcoming efforts to create breeding material. The findings corroborate some of the research. The findings are in line with some of the earlier research by (Vinoth and colleagues 2016), (Dhanwani and colleagues 2013) [7] , (Sandeep and colleagues 2018) [19] , and (Satturu and colleagues 2023) [20] , which revealed significant genetic variation in each of the estimated attributes described. 2019) [1] , (Rani et al. 2019) [17] , (Sudeepthi et al. 2020) [26] , (Guptha et al. 2020) [8] , (Singh et al. 2021) [23] , (Akshay et al. 2022) [42] , and (Sravani et al. 2022) [24] reported similar results. [34] and (Yadav et al. 2024) [35] .
Heritability
Heritability
Genetic Advance
The greatest genetic advance (GA) was detected for spikelets per panicle (72.09), with plant height (35.98) and days to maturity (30.88) came next, followed by days to 50% flowering (21.16) and harvest index (16.92). Significant GA were likewise recorded for biological yield (15.65), test weight (9.65), and grain yield (6.22) evidence of a favourable response to selection and a predominance of additive genetic control. For panicle length (3.00), flag leaf length (4.35), number of tillers per hill (1.79), and number of panicles per hill (1.45), GA was comparatively lower, while the smallest GA was registered for flag leaf width (0.12), implying that limited selection opportunity arises from modest genetic variation or substantial environmental effects. [37] , (Sudeepthi et al. 2020) [26] , (Lingaiah et al. 2020) [38] , (Bhor et al. 2020) [39] , (Lakshmi et al. 2021) [40] , (Akshay et al. 2022) [42] , and (Sravani et al. 2022) [27] Yada24v. [3] and Burton (1952) [4] .
Genetic Advance as Percent Mean
Genetic Advance as Percent Mean
Intra and Inter Cluster Average Divergence (D2)
The six rice genotype clusters' average intra and inter cluster distances (D 2 ) are displayed in [18] , (Neeraja et al. 2015) [41] , (Praveen et al. 2015) [16] , (Chandramohan et al. 2016) [6] , (Sridhar et al. 2016) [25] , (Tejaswini et al. 2016) [28] , (Guru et al. 2017) [9] , (Sujitha et al. 2020) [27] , (Kumar et al. 2014) [12] , (Shaili et al, 2022) [21] and (Kumari et al. 2021) [15] also document.
Contribution of individual characters towards total divergence
The analysis of trait-based genetic divergence among 42 rice genotypes ( [18] , (Neeraja et al. 2015) [41] , (Praveen et al. 2015) [16] , (Chandramohan et al. 2016) [6] , (Sridhar et al. 2016) [25] , (Tejaswini et al. 2016) [28] , (Guru et al. 2017) [9] , (Sujitha et al. 2020) [27] , (Kumar et al. 2014) [12] , (Shaili et al, 2022) [21] and (Kumari et al. 2021) [15] also document.
Conclusion
Based on the current examination, it was determined that all of the characters had significant variation according to the analysis of variance. Due to their high heritability and genetic variability, traits including grain yield, test weight, harvest index, and biological yield identified as key markers for genetic improvement were shown to exhibit considerable genetic diversity among the rice genotypes. Marked variability in yield attributes, plant height, maturity, and flowering period all attest to the genotypes' environmental adaptability. Suggested for breeding schemes are the genotypes SHUATS DHAN-1, KHAYAM DHAN, D DHAN-39, FALGUNA, KRISHNA HAMSA, and HMT, all distinguished by their superior yield traits. Cluster II exhibited the greatest yield potential, and the cluster analysis confirmed this variety. Owing to the pronounced genetic divergence between Clusters II and VI, highyielding hybrids may be developed. The findings furnish the genetic backbone on which climate-resilient, high-yielding rice varieties can be developed.
Figures and tables from the paper
| Sr. No | Genotypes | Days to 50% flowering | Days to Maturity | Plant Height | Flag leaf length | Flag leaf width | Number of tillers per hill | Number of panicles per hill | Panicle length | Number of spikelets per panicle | Biological yield per hill | Harvest Index | Test Weight | Grain Yield per hill |
|---|---|---|---|---|---|---|---|---|---|---|---|---|---|---|
| 1 | Indrani | 109.00 | 132.00 | 107.69 | 31.92 | 1.10 | 5.87 | 5.67 | 26.07 | 168.47 | 36.67 | 48.07 | 24.53 | 17.61 |
| 2 | AK Dhan | 107.67 | 122.33 | 128.98 | 31.34 | 1.02 | 8.53 | 7.87 | 27.35 | 136.20 | 48.80 | 34.32 | 24.47 | 16.80 |
| 3 | 80 NLR 40024 | 108.33 | 125.33 | 102.71 | 23.71 | 1.04 | 7.03 | 6.73 | 20.27 | 195.93 | 37.07 | 32.54 | 16.47 | 12.05 |
| 4 | JGL 3828 | 105.67 | 131.67 | 110.59 | 31.42 | 1.06 | 6.30 | 6.20 | 23.54 | 193.73 | 31.79 | 25.81 | 20.27 | 8.22 |
| 5 | Bina Dhan-10 | 94.33 | 117.00 | 114.87 | 33.71 | 1.04 | 7.67 | 7.03 | 25.33 | 108.27 | 25.13 | 30.52 | 20.20 | 7.54 |
| 6 | Lage Dhan | 125.33 | 165.33 | 165.69 | 29.59 | 1.03 | 8.37 | 7.30 | 25.76 | 182.80 | 37.20 | 30.37 | 20.67 | 11.25 |
| 7 | Talmunfar | 122.00 | 158.00 | 161.09 | 36.47 | 0.85 | 9.17 | 8.37 | 25.60 | 144.00 | 40.34 | 21.10 | 12.27 | 8.45 |
| 8 | Jarava | 119.00 | 140.33 | 131.14 | 32.06 | 0.95 | 5.83 | 5.20 | 22.44 | 146.80 | 27.75 | 54.64 | 20.67 | 15.13 |
| 9 | 84-Nlr-3354 | 113.00 | 138.67 | 98.14 | 29.16 | 1.04 | 7.27 | 6.67 | 23.55 | 174.53 | 29.51 | 48.73 | 20.53 | 14.36 |
| 10 | Gautam | 95.33 | 117.67 | 99.07 | 30.57 | 0.86 | 8.53 | 7.03 | 23.14 | 119.87 | 24.87 | 51.90 | 16.73 | 12.60 |
| 11 | Boichi | 113.33 | 131.33 | 99.64 | 28.60 | 0.93 | 7.43 | 6.93 | 22.19 | 121.07 | 27.93 | 32.51 | 20.27 | 8.93 |
| 12 | Vikramarya | 114.00 | 131.67 | 102.89 | 33.71 | 0.98 | 7.87 | 7.03 | 23.05 | 138.93 | 27.48 | 53.94 | 24.67 | 14.39 |
| 13 | DRRH-2 | 113.67 | 131.33 | 97.70 | 30.87 | 0.92 | 7.23 | 6.37 | 23.55 | 192.33 | 34.96 | 42.12 | 20.33 | 14.63 |
| 14 | 74-NLR-33359 | 113.33 | 130.00 | 100.45 | 28.19 | 0.93 | 8.93 | 8.43 | 22.60 | 154.80 | 36.67 | 34.30 | 16.73 | 12.47 |
| 15 | 81-NLR-33641 | 114.00 | 132.00 | 97.45 | 28.59 | 1.08 | 8.73 | 8.03 | 20.71 | 132.07 | 43.31 | 18.99 | 12.67 | 8.28 |
| 16 | Lal Bhuna | 115.00 | 135.00 | 118.71 | 27.68 | 0.76 | 8.70 | 8.13 | 21.53 | 203.13 | 41.13 | 25.26 | 16.47 | 10.40 |
| 17 | Ranukasel | 119.67 | 151.33 | 148.85 | 26.89 | 0.83 | 6.93 | 6.60 | 21.51 | 147.20 | 52.89 | 20.45 | 21.00 | 10.80 |
| 18 | Sampada | 115.67 | 143.00 | 99.55 | 27.89 | 0.85 | 6.77 | 6.20 | 22.43 | 123.20 | 28.08 | 34.14 | 12.53 | 9.46 |
| 19 | Suraksha | 114.67 | 146.67 | 107.47 | 30.81 | 0.87 | 5.47 | 5.33 | 23.53 | 135.60 | 26.73 | 33.14 | 20.93 | 8.80 |
| 20 | Mandhya Vijaya | 119.00 | 155.00 | 129.17 | 27.08 | 0.87 | 7.83 | 7.20 | 22.72 | 177.40 | 26.15 | 37.83 | 20.87 | 9.87 |
| 21 | Signet-5455 | 110.33 | 131.33 | 111.55 | 22.53 | 1.12 | 6.50 | 5.93 | 22.21 | 134.20 | 27.49 | 33.21 | 20.60 | 8.88 |
| 22 | Dhan-75 | 106.00 | 129.33 | 116.31 | 25.45 | 0.96 | 6.40 | 6.07 | 22.98 | 138.87 | 26.13 | 41.92 | 20.53 | 10.87 |
| 23 | NLR | 103.67 | 122.33 | 108.97 | 22.80 | 1.08 | 5.77 | 5.20 | 22.82 | 131.93 | 20.00 | 44.23 | 24.47 | 8.80 |
| 24 | MTU-1035 | 119.00 | 149.33 | 93.03 | 24.54 | 1.16 | 7.50 | 7.07 | 21.39 | 156.53 | 24.93 | 38.95 | 12.33 | 9.67 |
| 25 | 79-NLR-30491 | 115.00 | 137.33 | 103.50 | 26.19 | 1.09 | 6.83 | 6.07 | 21.58 | 240.00 | 27.19 | 31.14 | 16.40 | 8.42 |
| 26 | Kasturi | 89.67 | 115.67 | 125.74 | 27.63 | 1.02 | 6.83 | 6.10 | 25.35 | 149.13 | 24.60 | 35.29 | 24.47 | 8.51 |
| 27 | Dhan-38 | 105.00 | 122.00 | 130.17 | 30.40 | 1.14 | 6.63 | 6.20 | 24.69 | 126.20 | 40.33 | 34.77 | 20.40 | 14.05 |
Table text extracted from the original PDF; superscript letters are shown inline. The original table image is below.
View original table image
| Sr. No | Genotypes | Days to 50% flowering | Days to Maturity | Plant Height | Flag leaf length | Flag leaf width | Number of tillers per hill | Number of panicles per hill | Panicle length | Number of spikelets per panicle | Biological yield per hill | Harvest Index | Test Weight | Grain Yield per hill |
|---|---|---|---|---|---|---|---|---|---|---|---|---|---|---|
| 28 | Dhan-55 | 105.67 | 120.33 | 113.63 | 32.20 | 1.15 | 8.53 | 8.13 | 26.57 | 173.07 | 26.69 | 52.49 | 20.53 | 13.71 |
| 29 | 72-Dhan-59 | 97.00 | 119.00 | 128.44 | 27.09 | 1.11 | 7.53 | 6.80 | 24.31 | 158.67 | 35.47 | 39.51 | 20.73 | 13.92 |
| 30 | NLR-34449 | 114.67 | 150.67 | 93.89 | 27.47 | 1.13 | 7.87 | 7.03 | 20.29 | 157.53 | 30.92 | 30.07 | 16.93 | 9.25 |
| 31 | Khayam Dhan | 123.33 | 163.67 | 138.26 | 29.25 | 1.02 | 9.00 | 8.30 | 22.53 | 148.13 | 42.45 | 30.89 | 30.60 | 13.03 |
| 32 | MTU-1190 | 121.00 | 151.00 | 118.29 | 25.49 | 1.06 | 8.00 | 7.73 | 22.12 | 214.67 | 42.60 | 17.58 | 20.80 | 7.45 |
| 33 | Birri Dhan-75 | 98.67 | 120.33 | 101.81 | 24.76 | 1.03 | 7.83 | 6.93 | 20.54 | 215.93 | 29.32 | 41.33 | 12.60 | 12.12 |
| 34 | D Dhan-39 | 99.33 | 121.00 | 122.77 | 31.86 | 1.03 | 7.70 | 7.47 | 27.65 | 200.73 | 43.85 | 37.64 | 27.80 | 16.48 |
| 35 | Sidha Sannalu | 116.67 | 152.00 | 117.93 | 27.23 | 0.96 | 7.60 | 7.27 | 21.20 | 178.93 | 44.48 | 16.58 | 12.27 | 7.40 |
| 36 | 71-Dhan-58 | 115.67 | 148.67 | 92.09 | 22.77 | 1.00 | 7.43 | 6.90 | 21.33 | 114.80 | 33.55 | 33.19 | 13.07 | 11.10 |
| 37 | Falguna | 116.00 | 161.67 | 101.19 | 33.24 | 1.14 | 8.63 | 8.10 | 26.47 | 181.00 | 47.61 | 29.20 | 24.73 | 13.71 |
| 38 | 82-NLR-145 | 108.67 | 127.00 | 100.63 | 26.72 | 1.03 | 7.67 | 7.53 | 21.29 | 226.73 | 42.20 | 28.83 | 16.47 | 12.15 |
| 39 | HMT | 115.67 | 163.67 | 96.47 | 32.30 | 1.04 | 9.20 | 8.57 | 22.06 | 278.27 | 33.82 | 37.46 | 12.33 | 12.65 |
| 40 | Krishna Hamsa | 93.67 | 120.67 | 112.05 | 23.96 | 1.01 | 9.37 | 8.80 | 23.54 | 154.20 | 35.06 | 40.03 | 24.67 | 13.88 |
| 41 | Dhan-53 | 118.67 | 159.67 | 88.77 | 25.21 | 0.92 | 8.67 | 8.20 | 22.39 | 211.73 | 38.09 | 22.47 | 12.00 | 8.52 |
| 42 | Shuats Dhan-1 (Check) | 74.00 | 128.33 | 109.30 | 34.25 | 1.10 | 7.97 | 7.56 | 29.33 | 134.87 | 57.60 | 39.39 | 22.60 | 22.36 |
| Range | Minimum | 74.00 | 115.67 | 88.77 | 22.53 | 0.76 | 5.47 | 5.20 | 20.27 | 108.27 | 20.00 | 16.58 | 12.00 | 7.40 |
| Maximum | 125.33 | 165.33 | 165.69 | 36.47 | 1.16 | 9.37 | 8.80 | 29.33 | 278.27 | 57.60 | 54.64 | 30.60 | 22.36 | |
| Grand Mean | 109.98 | 136.92 | 113.01 | 28.66 | 1.01 | 7.62 | 7.05 | 23.32 | 164.82 | 34.73 | 34.93 | 19.30 | 11.64 | |
| SEm | 0.74 | 0.58 | 1.80 | 1.76 | 0.05 | 0.29 | 0.37 | 0.97 | 7.13 | 2.18 | 2.81 | 0.20 | 0.63 | |
| SEd | 1.04 | 0.82 | 2.55 | 2.48 | 0.07 | 0.41 | 0.53 | 1.37 | 10.08 | 3.08 | 3.98 | 0.29 | 0.90 | |
| CD 5% | 2.07 | 1.63 | 5.07 | 4.94 | 0.14 | 0.82 | 1.05 | 2.72 | 20.06 | 6.13 | 7.92 | 0.57 | 1.78 | |
| CV | 1.16 | 0.73 | 2.76 | 10.61 | 8.52 | 6.63 | 9.17 | 7.17 | 7.49 | 10.86 | 13.96 | 1.81 | 9.43 |
Table text extracted from the original PDF; superscript letters are shown inline. The original table image is below.
View original table image
| Sr. No | Trait | PCV | GCV | Heritability% | Genetic advance | GAM at 5% |
|---|---|---|---|---|---|---|
| 1. | Days to 50% flowering | 9.48 | 9.41 | 98.50 | 21.16 | 19.24 |
| 2. | Days to Maturity | 11.00 | 10.97 | 99.56 | 30.88 | 22.56 |
| 3. | Plant Height | 15.94 | 15.69 | 96.99 | 35.98 | 31.84 |
| 4. | Flag leaf length | 14.92 | 10.49 | 49.44 | 4.35 | 15.19 |
| 5. | Flag leaf width | 12.03 | 8.50 | 49.84 | 0.12 | 12.36 |
| 6. | Number of tillers per Hill | 14.43 | 12.82 | 78.88 | 1.79 | 23.45 |
| 7. | Number of panicles per hill | 15.44 | 12.43 | 64.74 | 1.45 | 20.60 |
| 8. | Panicle length | 10.94 | 8.26 | 57.03 | 3.00 | 12.85 |
| 9. | Number of spikelets per panicle | 23.61 | 22.39 | 89.93 | 72.09 | 43.74 |
| 10. | Biological yield per hill | 26.35 | 24.00 | 83.01 | 15.65 | 45.05 |
| 11. | Harvest Index | 30.01 | 26.57 | 78.37 | 16.92 | 48.45 |
| 12. | Test Weight | 24.41 | 24.34 | 99.45 | 9.65 | 50.01 |
| 13. | Grain Yield Per Hill | 28.98 | 27.41 | 89.42 | 6.22 | 53.39 |
Table text extracted from the original PDF; superscript letters are shown inline. The original table image is below.
View original table image
| Cluster | No. of Genotypes | Genotypes |
|---|---|---|
| I | 4 | Talmunfar, falguna, lage dhan, khayam dhan |
| II | 9 | Mtu-81, nlr-33641, dhan-53, mtu-1190, sidha sannalu, ranukasel, mandhya vijaya, 74-nlr-33359, lal bhuna |
| III | 14 | Dhan-75, nlr, signet-5455, suraksha, boichi, sampada, 71- dhan-58, mtu-1035, nlr-34449, birri dhan-75, 80-nlr- 40024, 82- nlr-145, jgl-3828, 79-nlr-30491 |
| IV | 3 | Shuats dhan-1 (check), ak dhan, ddhan-39, |
| V | 5 | Vikramarya, 84-nlr-3354, drrh-2, indrani, jaravia |
| VI | 7 | Dhan-38, 72-dhan-59, bina dhan-10, kasturi, gautam, dhan-55, krishna hamsa |
Table text extracted from the original PDF; superscript letters are shown inline. The original table image is below.
View original table image
| Cluster | I | II | III | IV | V | VI |
|---|---|---|---|---|---|---|
| I | 3.007 | |||||
| II | 4.926 | 3.672 | ||||
| III | 3.863 | 6.303 | 3.586 | |||
| IV | 3.767 | 4.416 | 3.943 | 3.872 | ||
| V | 5.317 | 5.459 | 5.509 | 5.364 | 4.461 | |
| VI | 5.072 | 6.321 | 3.889 | 4.975 | 4.288 | 4.034 |
Table text extracted from the original PDF; superscript letters are shown inline. The original table image is below.
View original table image
| Group | Days to 50% flowering | Days to Maturity | Plant Height | Flag leaf length | Flag leaf width | Number of tillers per hill | Number of panicles per hill | Panicle length | Number of spikelets per panicle | Biological yield per hill | Harvest Index | Test Weight | Grain Yield Per hill |
|---|---|---|---|---|---|---|---|---|---|---|---|---|---|
| C I | 113.73 | 134.8 | 107.51 | 31.54 | 0.996 | 6.81 | 6.19 | 23.73 | 164.21 | 31.28 | 49.5 | 22.15 | 15.23 |
| C II | 99.39 | 129.06 | 114.65 | 31.14 | 1.075 | 8.46 | 7.99 | 26.82 | 163.35 | 43.27 | 38.85 | 24.13 | 16.16 |
| C III | 101.46 | 123.54 | 118.33 | 27.63 | 1.064 | 6.7 | 6.19 | 23.9 | 142.63 | 28.87 | 35.66 | 21.46 | 10.1 |
| C IV | 120.25 | 153.92 | 137.25 | 28.71 | 0.923 | 8.2 | 7.61 | 22.87 | 174.53 | 40.9 | 25.01 | 19.37 | 9.83 |
| C V | 109.75 | 134.67 | 101.43 | 29.47 | 0.878 | 7.05 | 6.38 | 22.82 | 124.93 | 26.9 | 37.92 | 17.62 | 9.95 |
| C VI | 112.88 | 140.36 | 97.34 | 26.4 | 1.042 | 7.97 | 7.41 | 21.31 | 189.48 | 34.28 | 31.75 | 14.36 | 10.61 |
Table text extracted from the original PDF; superscript letters are shown inline. The original table image is below.
View original table image
| Sr. No | Characters | Percent contribution |
|---|---|---|
| 1. | Days to 50% flowering | 10.50% |
| 2. | Days to Maturity | 56.80% |
| 3. | Plant Height | 5.30% |
| 4. | Flag leaf length | 0.30% |
| 5. | Flag leaf width | 0.30% |
| 6. | Number of tillers per hill | 0.20% |
| 7. | Number of panicles per hill | 0.30% |
| 8. | Panicle length | 0.30% |
| 9. | Number of spikelets per panicle | 1.60% |
| 10. | Biological yield per hill | 1.20% |
| 11. | Harvest Index | 0.60% |
| 12. | Test Weight | 21.70% |
| 13. | Grain Yield Per hill | 0.90% |
Table text extracted from the original PDF; superscript letters are shown inline. The original table image is below.
View original table image
References
41 in the original paper- Abigail Seneega TV, Gnanamala RP, Parameswari C, Vellaikumar S, Priyanka AR. Genetic variability and association studies in F₂ generation of rice (Oryza sativa L.). Electron J Plant Breed. 2019;10(2):512-517.
- Directorate of Economics and Statistics, Department of Agriculture and Cooperation, Ministry of Agriculture and Farmers Welfare, Government of India. Agriculture statistics at glance. New Delhi: Directorate of Economics and Statistics, Department of Agriculture and Cooperation, Ministry of Agriculture and Farmers Welfare, Government of India; 2022.
- Al-Jibouri HA, Miller PA, Robinson HF. Genotypic and environmental variances and covariances in an upland cotton cross of interspecific origin. Agron J. 1958;50(10):633-636.
- Burton GW. Quantitative inheritance of grasses. In: Proceedings of the 6th International Grassland Congress. Volume 1. 1952. p. 277-283.
- Burton GW, Devane EM. Estimation of heritability in tall fescue (Festuca arundinacea) from replicated clonal material. Agron J. 1953;45(2):478-481.
- Chandramohan Y, Srinivas B, Thippeswamy S, Padmaja D. Diversity and variability analysis for yield parameters in rice (Oryza sativa L.) genotypes. Indian J Agric Res. 2016;50(6):609-613.
- Dhanwani RK, Sarawgi AK, Solanki A, Tiwari JK. Genetic variability analysis for various yield attributing and quality traits in rice (Oryza sativa L.). The Bioscan. 2013;8(4):1403-1407.
- Gupta S, Upadhyay S, Koli GK, Rathi SR, Bisen P, Loitongbam B, Sinha B. Trait association and path analysis studies of yield attributing traits in rice (Oryza sativa L.) germplasm. Int J Bio-resource Stress Manage. 2020;11(6):508-513.
- Guru T, Padma V, Reddy DVV, Rao PR, Rao DS, Ramesh T, Radhakrishna KV. Genetic diversity analysis for yield attributing traits in rice genotypes. Res Crops. 2017;18(2):311-315.
- Islam MJ, Raffi SA, Hossain MA, Hasan AK. Analysis of genetic variability, heritability and genetic advance for yield and yield associated traits in some promising advanced lines of rice. Progressive Agriculture. 2015;26(1):26-31.
- Johnson HW, Robinson HE, Comstock RE. Estimates of genetic and environmental variability in soybeans. Agron J. 1955; 47:314-318.
- Kumar B, Gupta BB, Singh B. Genetic diversity for morphological and quality traits in rice (Oryza sativa L.). The Bioscan. 2014;9(4):1759-1762.
- Kumar B, Kour A, Laxami J. Genetic diversity for agro-morphological traits in rice germplasm. Electron J Plant Breed. 2017;8(4):1216-1222.
- Kumari BK, Kumar BR, Jyothula D, Rao NM. Diversity analysis in rice breeding lines for yield and its components using principal component analysis. J Pharmacogn Phytochem. 2021;10(1):905-909.
- Praveen KU, Suresh BG, Ankit K, Swamy M. Genetic divergence among advanced breeding lines of medium duration rice (Oryza sativa L.). Int J Sci Res. 2015;4(7):2585-2587.
- Rani S, Reddy PR, Rao PS. Evaluation of genetic variability, heritability, and genetic advance for yield and yield contributing traits in rice (Oryza sativa L.) landraces. Int J Agric Environ Biotechnol. 2019;12(3):229-236.
- Rashid MM, Hassan L, Das B, Begum SN. Correlation and path coefficient analysis of yield and yield contributing traits in rice. Int J Sustainable Crop Prod. 2017;12(2):1-6.
- Sandeep K, Reddy PR, Rao PS. Genetic variation, heritability, and genetic advance studies in two hundred rice genotypes (Oryza sativa L.). J Agric Res. 2018;56(2):150-159.
- Satturu V, Lakshmi VGI, Sreedhar M. Genetic variability, association and multivariate analysis for yield parameters in cold tolerant rice (Oryza sativa L.) genotypes. Vegetos. 2023; 36:1465-1474.
- Shaili MR, Kumar GV, Lal GM, Lavanya GR. Assessment of genetic diversity in rice (Oryza sativa L.) genotypes for grain yield characters. Int J Environ Clim Change. 2022;12(11):1113-1122.
- Singh SK, Singh CM, Lal GM. Assessment of genetic variability for yield and its component characters in rice (Oryza sativa L.). Res Plant Biol. 2011;1(4):73-76.
- Singh P, Singh SK, Korada M, Khaire A, Singh DK, Habde SV, et al. Exploring variability and genetic diversity among rice genotypes in Eastern Uttar Pradesh. Electron J Plant Breed. 2021;12(4):1367-1374.
- Sravani B, Reddy PR, Kumar CR, Rao PS. Genetic variability, heritability, and genetic advance studies in 50 rice genotypes (Oryza sativa L.). J Plant Breed Genet. 2022;10(2):45-53.
- Sridhar TC, Kumar BD, Mani BR, Nishanth GK. Genetic diversity, variability and association analysis for yield traits in traditional rice cultivars of Southern Karnataka. Green Farming. 2016;7(4):774-778.
- Sudeepthi K, Srinivas TVSR, Kumar BR, Jyothula DPB, Umar SN. Assessment of genetic variability, character association and path analysis for yield and yield component traits in rice (Oryza sativa L.). Electron J Plant Breed. 2020;11(1):144-148.
- Sujitha R, Arumugam Pillai M, Kannan R, Shoba D. Genetic diversity and association studies in rice (Oryza sativa L.). J Pharmacogn Phytochem. 2020;9(6):487492.
- Tejaswini KLY, Manukonda S, Rao PR, Kumar BR, Mohammad LA, Raju SK. Cluster analysis studies in rice (Oryza sativa L.) using Ward's minimum variance method. J Agric Crop Res. 2016;4(9):129-139.
- Veludandi Sumanth SBG, Jalandhar Ram B, Srujana G. Estimation of genetic variability, heritability and genetic advance for grain yield components in rice (Oryza sativa L.). J Pharmacogn Phytochem. 2017;6(4):1437-1439.
- Vinoth R, Shivramakrishnan R, Sivaji M, Tamilkumar P, Kumar B, Marker S. Genetic analysis and correlation studies for grain yield in rice (Oryza sativa L.) under the Allahabad agro climatic region. Int J for Crop Improve. 2016;7(1):93-100.
- Vivek S, Singh S, Singh SK, Singh H. Estimation of genetic variability, heritability and genetic advance in rice (Oryza sativa L.). Agric Sci Defeasance. 2005;25(3):207-209.
- Ward JH Jr. Hierarchical grouping to optimize an objective function. J Am Stat Assoc. 1963; 58:236-244.
- Yadav KK, Kumari J, Mamatha A, Kumar V, Gantait A, Maxton A. Study of Genetic Variability and Path Analysis for Yield in Greengram (Vigna radiata L. Wilczek). J Exp Agric Int. 2024;46(9):130-141.
- Yadav M, Kumari J, Gantait A, Kumar V, Maxton A. Assessment of Genetic Diversity for Yield Component Traits and Grain Yield of Blackgram [Vigna mungo (L.) Hepper]. J Exp Agric Int. 2024;46(9):426-433.
- Brown PJ, Juliano RL. Selective inhibition of fibronectin-mediated cell adhesion by monoclonal antibodies to a cell-surface glycoprotein. Science. 1985 Jun 21;228(4706):1448-51.
- Sibara S, Jha A, Yadav H, Dixit S, Singh H, Ram S. Assessment of genetic diversity for qualitative and quantitative traits in pumpkin (Cucurbita moschata). Int. J. Adv. Biochem. Res. 2024;8(8):36-38.
- Kishore N, Pindi PK, Ram Reddy S. Phosphatesolubilizing microorganisms: a critical review. Plant Biology and Biotechnology: Volume I: Plant Diversity, Organization, Function and Improvement. 2015:307-33.
- Lingaiah G, Sridhar K. Experimental Investigation on Novel Parabolic Trough Collector. Distributed Generation & Alternative Energy Journal. 2020:237-48.
- Rizio AA, Bhor M, Lin X, McCausland KL, White MK, Paulose J, Nandal S, Halloway RI, Bronté-Hall L. The relationship between frequency and severity of vaso-occlusive crises and health-related quality of life and work productivity in adults with sickle cell disease. Quality of Life Research. 2020 Jun;29(6):1533-47.
- Akhil D, Lakshmi D, Senthil Kumar P, Vo DV, Kartik A. Occurrence and removal of antibiotics from industrial wastewater. Environmental chemistry letters. 2021 Apr;19(2):1477-507.
- Umapathy V, Manikandan A, Antony SA, Ramu P, Neeraja P. Structure, morphology and opto-magnetic properties of Bi2MoO6 nano-photocatalyst synthesized by sol-gel method. Transactions of Nonferrous Metals society of china. 2015 Oct 1;25(10):3271-8.
- Akshay Kumaar M, Samiayya D, Vincent PD, Srinivasan K, Chang CY, Ganesh H. A hybrid framework for intrusion detection in healthcare systems using deep learning. Frontiers in Public Health. 2022 Jan 12;9:824898.
Cited by 1
From OpenAlex, OpenCitations and reference lists read by Scinovex
- Multi-trait index-based delineation and selection of promising rice genotypes for yield and nutritional quality ↗
Dubbala Prshanthi Divya Vani, Gopal Wasudeo Narkhede · Vegetos · 2026
❝ 0