
Research article · 2025 · Full text
International Journal of Agriculture and Food ScienceInfluence of environmental modifications and fertility levels on growth and yield of quality protein maize (QPMH-1)
Volume 7(8) · Pages 1408–1422 · DOI: 10.33545/2664844x.2025.v7.i8n.718 ↗
Research areasCrop Yield and Soil Fertility
Abstract
Author-writtenThe present research was undertaken at Agronomy Research Farm of Division of Agronomy, Faculty of Agriculture, SKUAST-K, Wadura, Sopore during Kharif 2023 with the objectives of studying the effect of sowing dates and fertility levels on growth parameters, yield attributes, yield, of Quality Protein Maize. The experiment comprised of three Standard Meteorological Week viz, 16th week, 19th week, 22nd week assigned to main plots and four fertility levels including control, 75% RDF, 100% RDF and 125% RDF assigned to sub plots and replicated thrice. The variety tested was Shalimar QPMH-1 and the experiment was laid out in split plot design. The results of the experiment revealed that the different sowing dates and fertility levels had a significant impact on growth, yield parameters, yield of Shalimar QPMH-1. Among the three Standard Meteorological Week, 19th week sowing recorded significantly higher values of growth characteristics, yield attributing characters Significantly higher values of grain yield (5.39 t/ha), Stover yield (6.46 t/ha), biological yield (11.85 t/ha), harvest index (45.33%) and shelling percentage (62.47%) was recorded in 19th week sowing as compared to other sowing dates. All the fertility levels enhanced the growth parameters and yield of the crop compared to control treatment. Among the fertility levels, F3 (125% RDF) treatment recorded significantly higher values of growth characteristics and yield attributing characters. Application of NPK @ 125% RDF recorded significantly higher values of grain yield (5.61 t/ha), Stover yield (6.83 t/ha), biological yield (12.44 t/ha), harvest index (45.04%) and shelling percentage (61.8%) as compared to other fertility levels and control. Significantly lowest values of growth characteristics, yield contributing characters and yield was recorded in control treatment. Therefore, from the present study it can be concluded that sowing of QPM on 19th week with the application of 125% RDF is promising for achieving higher productivity in quality protein maize under temperate conditions of Kashmir valley.
Summary
Source-checkedPlain-language reading of the full paper, prepared with AI and checked against the text. Each point links to the authors' own words.
Why it matters
- Maize is a critical global cereal crop used for both human consumption and livestock feed. View evidence ↗
- Quality Protein Maize (QPM) is a variety enriched with essential proteins and provides nearly double the essential amino acids, like lysine and tryptophan, compared to regular maize. View evidence ↗
- Maize productivity is often limited by factors such as declining soil quality and inefficient or outdated fertilizer recommendations. View evidence ↗
The question
- The study aimed to evaluate how different sowing dates and fertility levels affect the growth, yield attributes, and overall yield of Quality Protein Maize. View evidence ↗
What they did
- The research was conducted during the Kharif 2023 season at the Agronomy Research Farm of SKUAST-K in Wadura, Sopore. View evidence ↗
- Using a split plot design with three replications, the study tested the Shalimar QPMH-1 variety across three sowing dates (16th, 19th, and 22nd Standard Meteorological Weeks) and four fertility levels (Control, 75%, 100%, and 125% Recommended Dose of Fertilizer). View evidence ↗
What they found
- Sowing in the 19th Standard Meteorological Week (SWM) resulted in the tallest plants at maturity (200.87 cm), while the 22nd SWM produced the shortest (180.59 cm). View evidence ↗
- The 125% RDF fertility level produced the maximum plant height at maturity (205.1 cm), significantly higher than the control treatment (176.8 cm). View evidence ↗
- Dry matter accumulation (DMA) was highest for the 19th SWM sowing (103.41 q ha⁻¹) and lowest for the 22nd SWM sowing (91.62 q ha⁻¹) at maturity. View evidence ↗
- The 125% RDF treatment led to the highest dry matter accumulation at maturity (103.28 q ha⁻¹), compared to the control (91.68 q ha⁻¹). View evidence ↗
- The highest shelling percentage (62.47%) was achieved with 19th SWM sowing, while the 22nd SWM sowing had the lowest (56.72%). View evidence ↗
What it means
- The authors recommend sowing QPM in the 19th SWM with 125% RDF application to achieve optimal productivity and profitability in the Kashmir valley. View evidence ↗
Visual summary
3 visualsIllustrations explain the paper; charts are replotted from the paper's own table values.
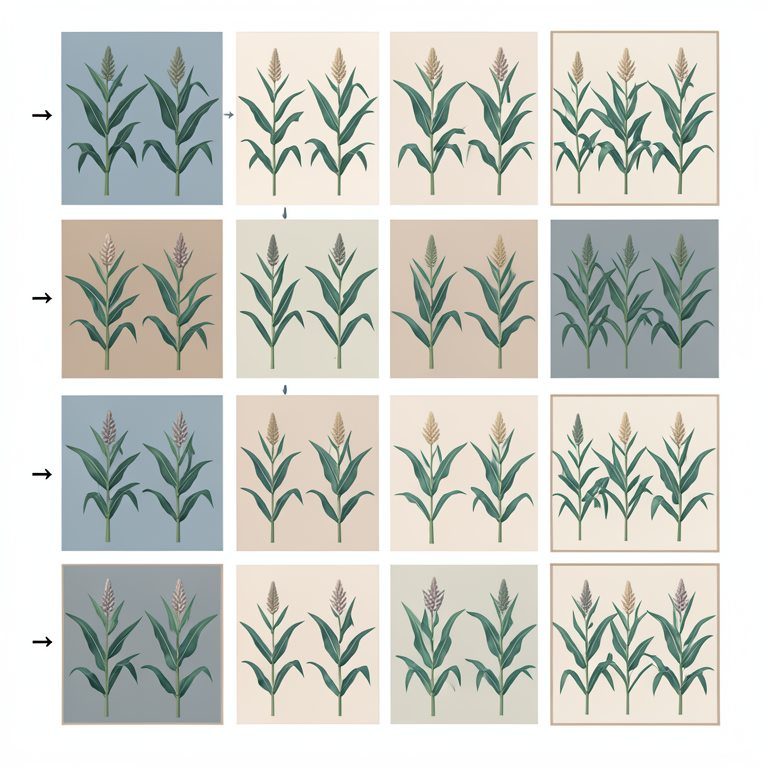
Experimental Setup
AI-generated conceptual illustration (Quality protein maize plants (QPMH-1) in an agricultural field). It explains the idea and does not show study data.
View source evidence ↗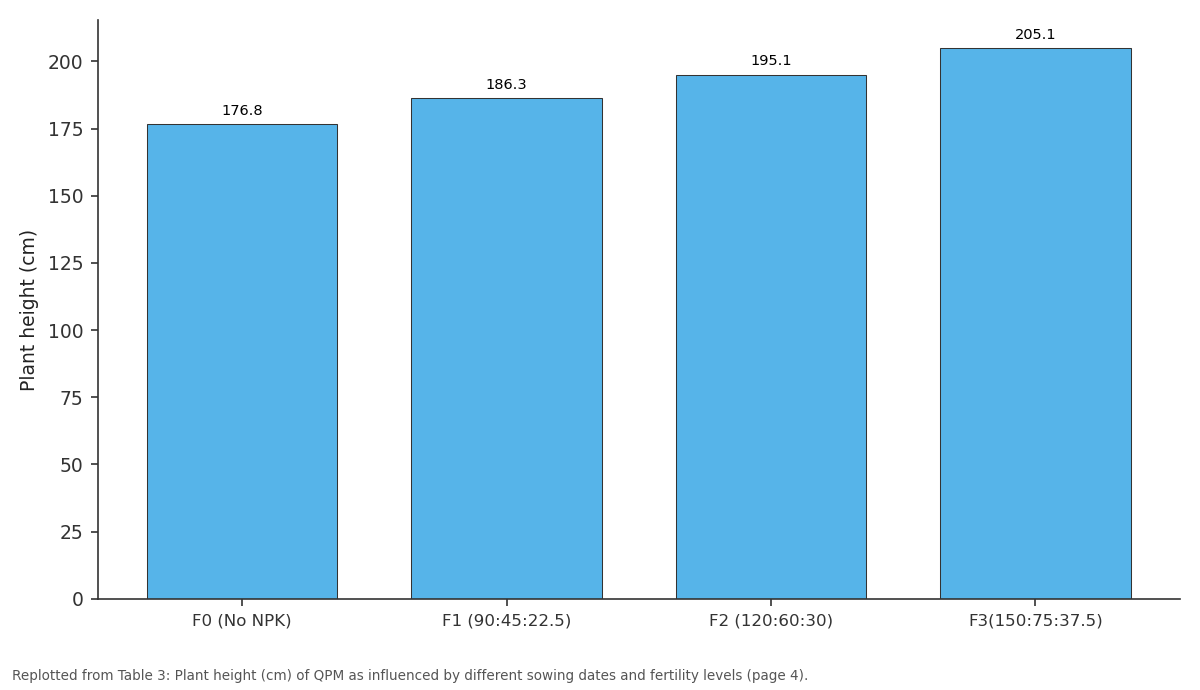
Harvest: F0 (No NPK) vs F1 (90:45:22.5) vs F2 (120:60:30) vs F3(150:75:37.5)
Replotted from Table 3 (page 4) of the original paper. Every bar is the paper's own table value.
View source evidence ↗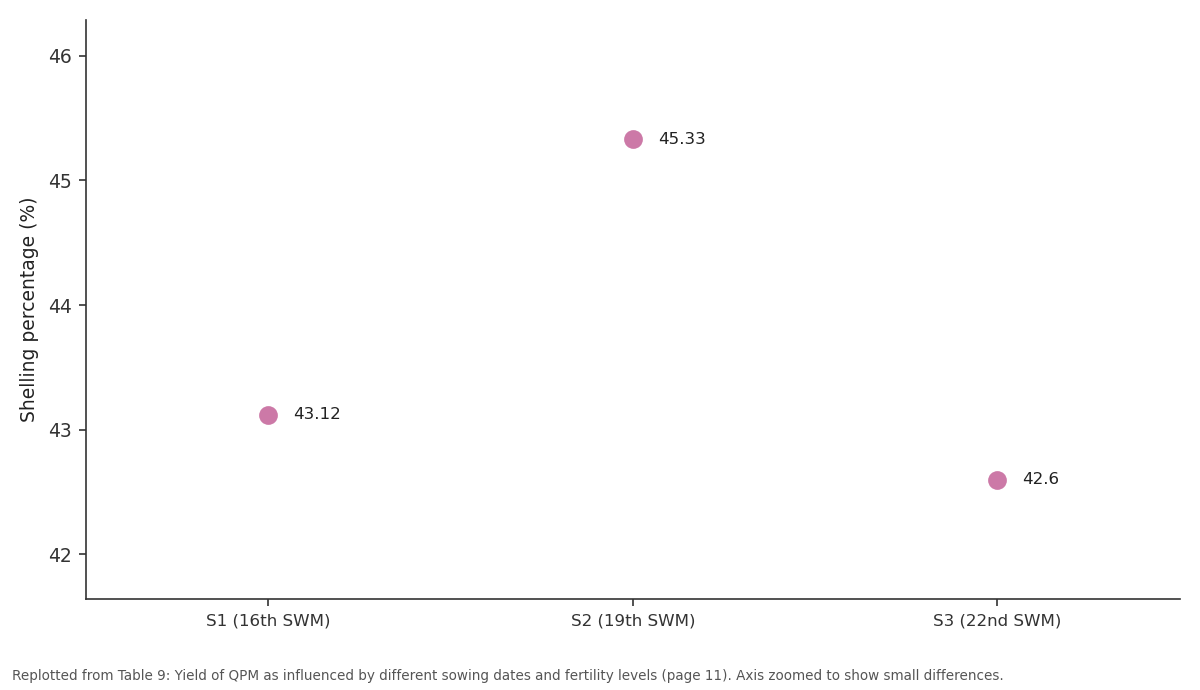
Harvest index (%): S1 (16th SWM) vs S2 (19th SWM) vs S3 (22nd SWM)
Replotted from Table 9 (page 11) of the original paper. Every bar is the paper's own table value.
View source evidence ↗Figures & tables
From the original paper Table 1Page 2
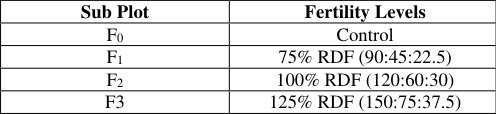 Table 2Page 2
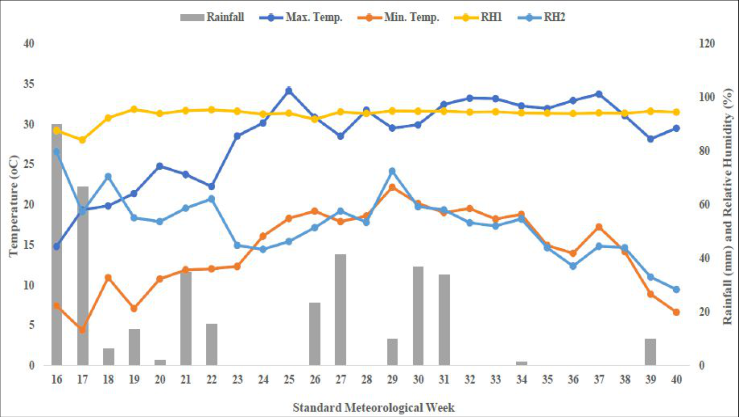 Figure 1Page 3
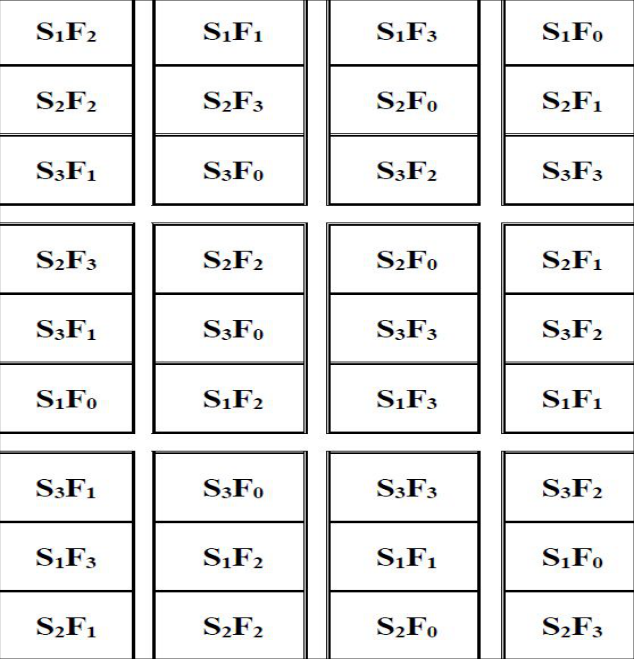 Figure 2Page 3
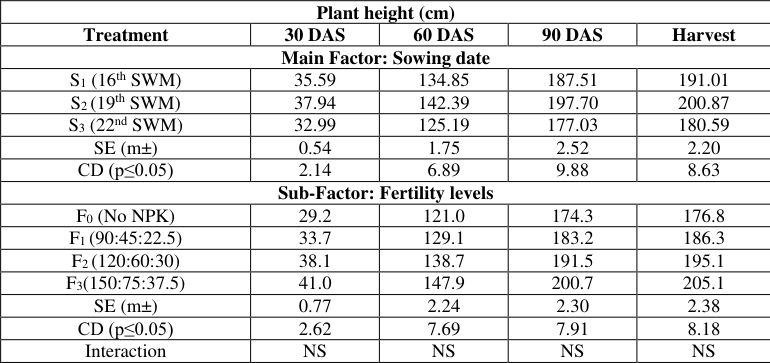 Table 3Page 4
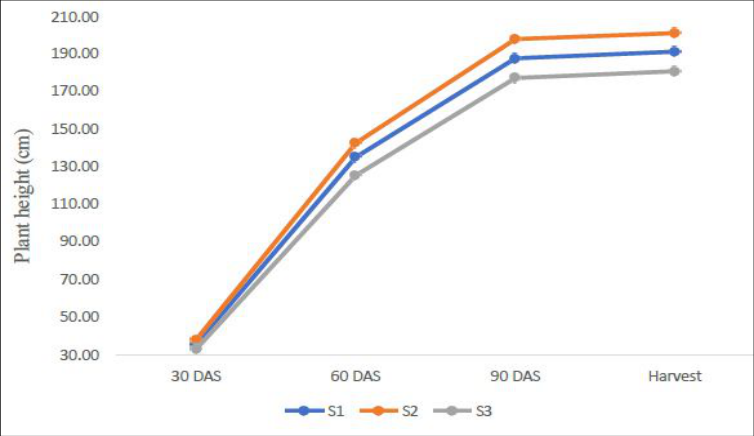 Figure 3Page 4
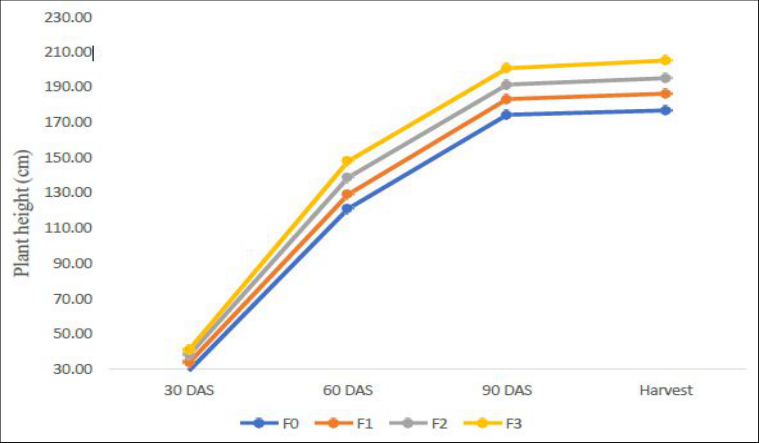 Figure 4Page 4
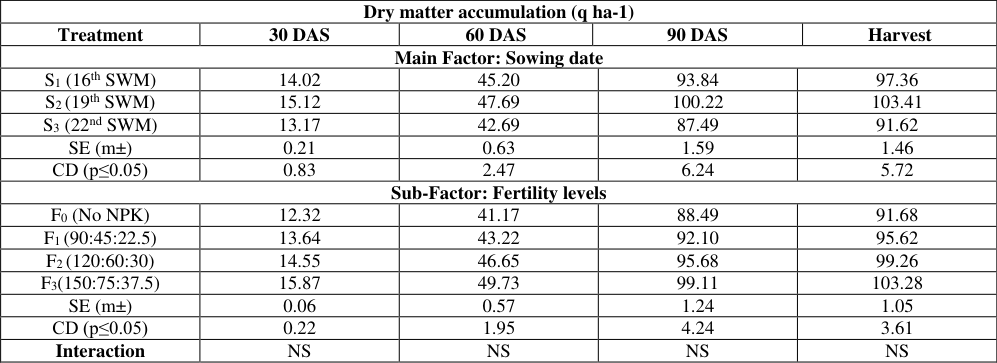 Table 4Page 5
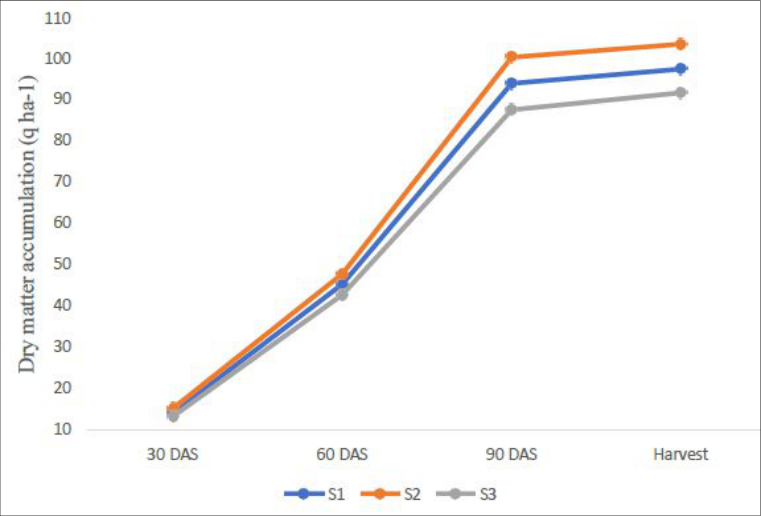 Figure 5Page 5
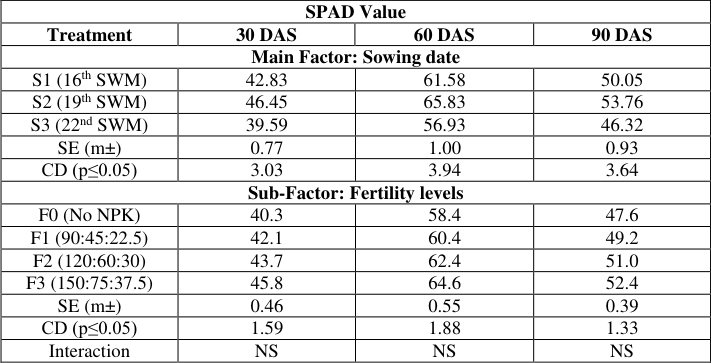 Table 5Page 6
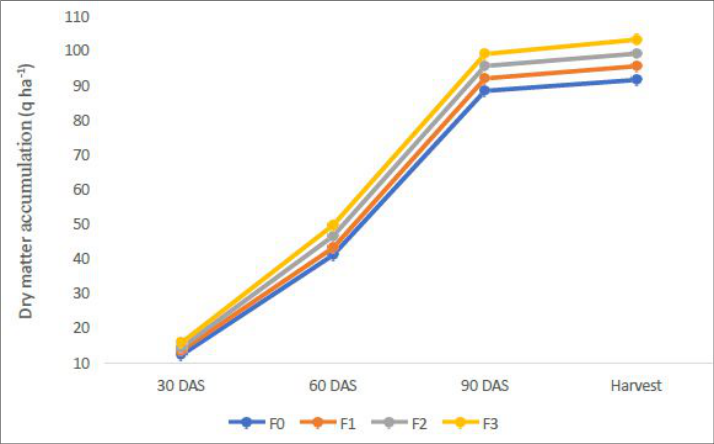 Figure 6Page 6
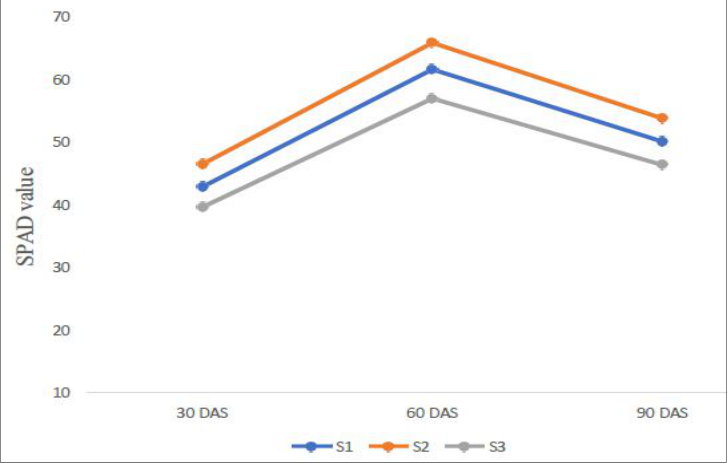 Figure 7Page 6
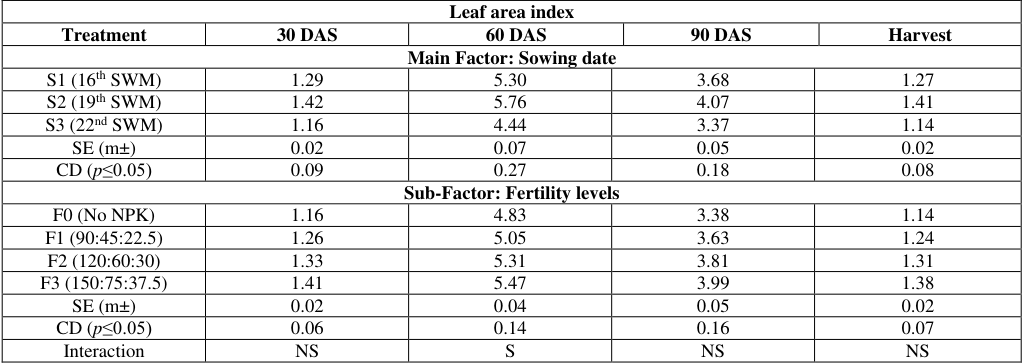 Table 6Page 7
 Table 6Page 7
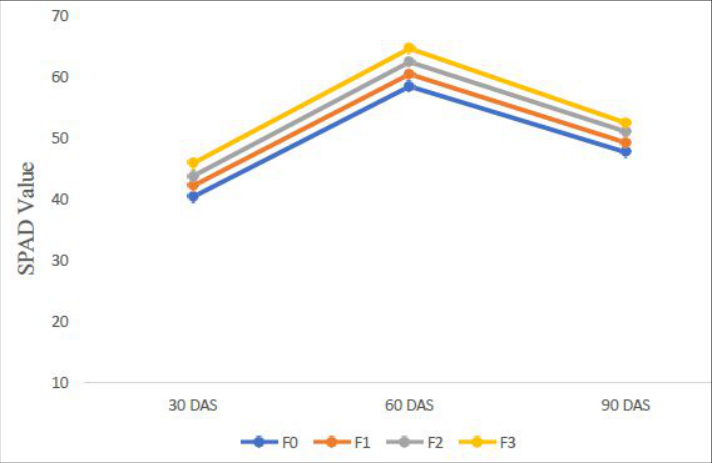 Figure 8Page 7
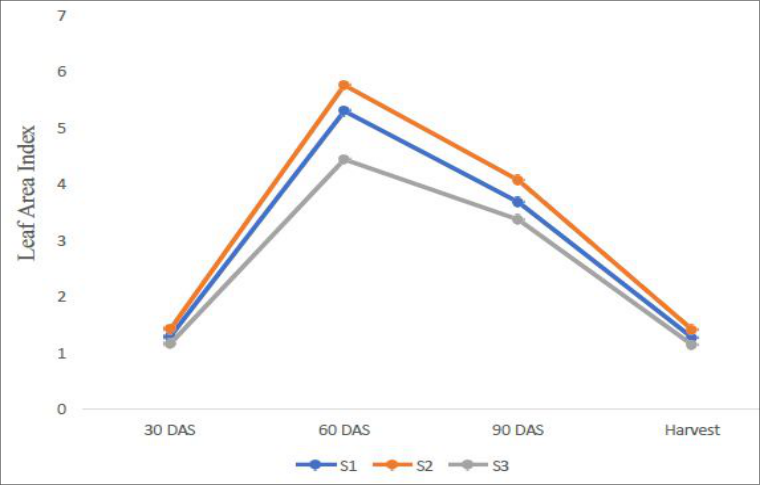 Figure 9Page 8
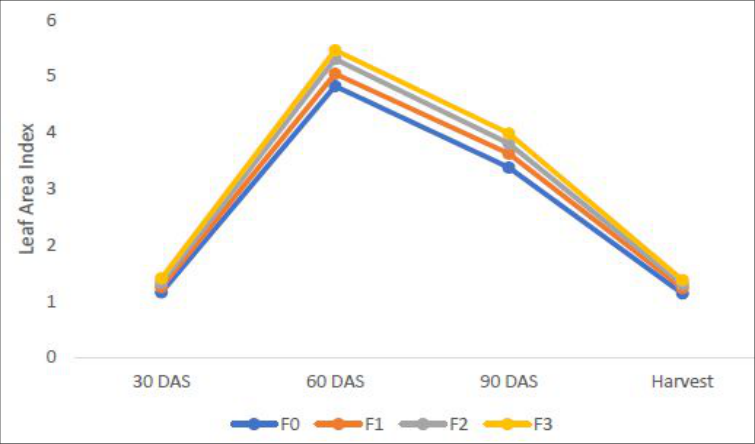 Figure 10Page 8
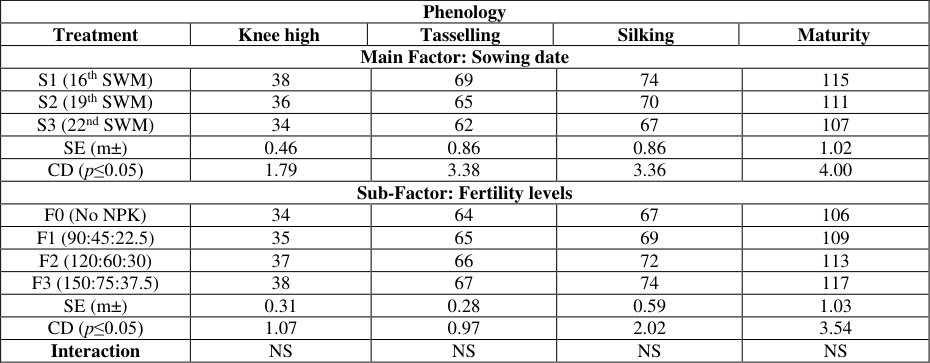 Table 7Page 9
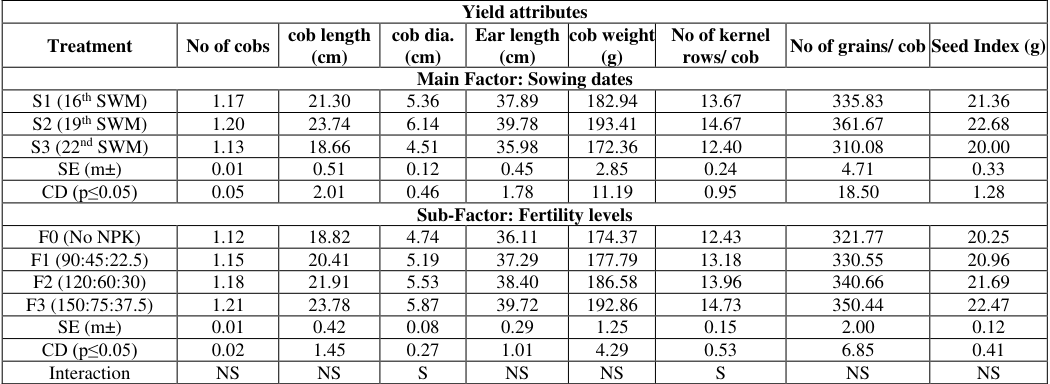 Table 8Page 10
 Table 8Page 10
 Table 8Page 10
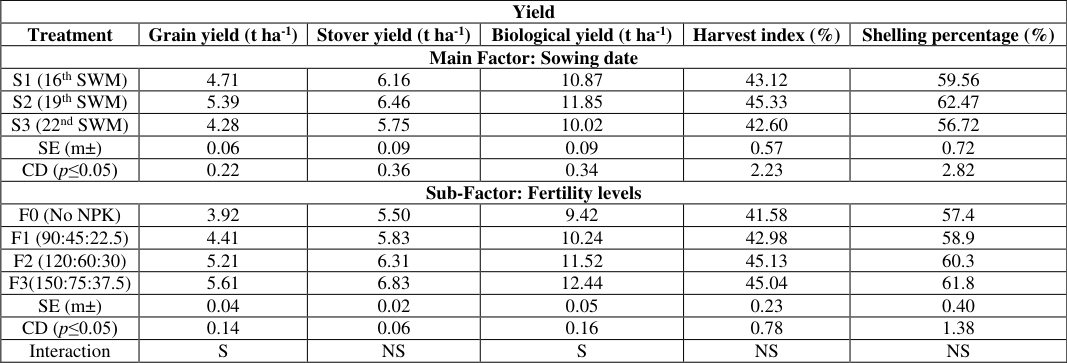 Table 9Page 11
 Table 9Page 12
 Table 9Page 12
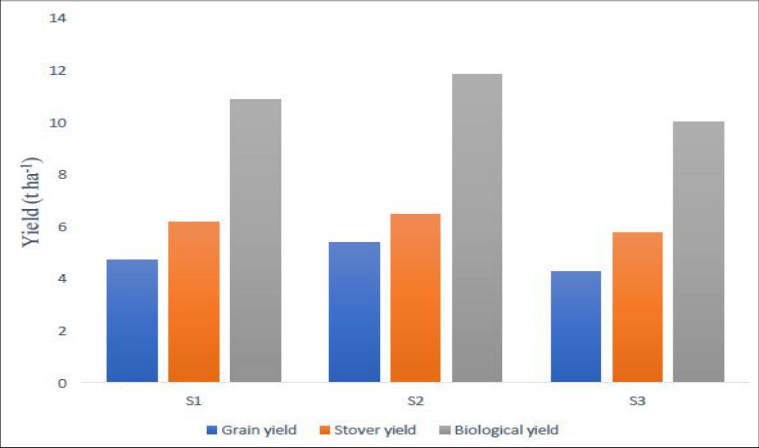 Figure 11Page 12
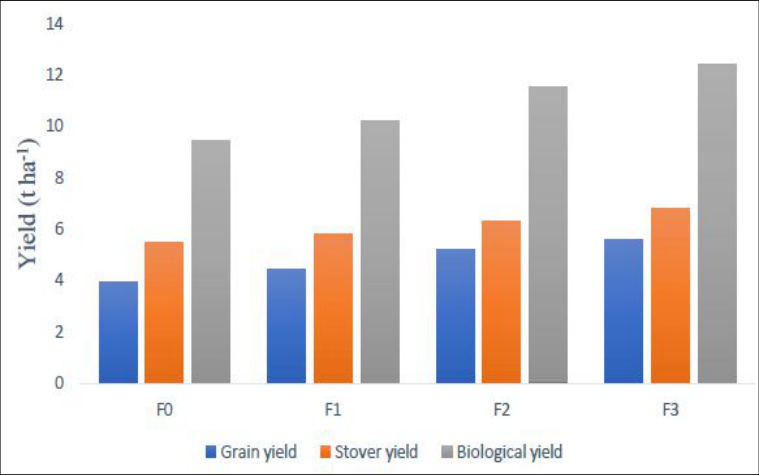 Figure 12Page 12
Introduction
Critical cereal crop, maize (Zea mays L.) globally, serving as both human food and livestock forage. It is often referred to as the "Queen of cereals" due to its significant role in diets, maize is grown on approximately 140 million hectares worldwide across diverse climates. In India, maize covers 9.47 million hectares, yielding 28.64 million tonnes with an average productivity of 29.45 q ha-1 (DES, 2020) [5] . In Jammu and Kashmir, maize is grown on 2.6 lakh hectares (DES, 2020) [5] . Achieving a typical yield of 5.75 t ha -1 , more than 170 nations currently produce 1147.7 million MT of maize on 193.7 million hectares (FAO STAT, 2020) [7] . The maize variety enriched with essential proteins and favorable agronomic traits is known as Quality Protein Maize (QPM) (Pandey et al., 2016 [28] ; Messing and Rutgers, 2017) [20] . QPM was created following research carried out at CIMMYT, which features higher yield potential, improved protein content, and a balanced amino acid profile. In more than 23 developing nations, QPM cultivars have been provided for large-scale production, covering more than 2.5 million hectares (Sofi et al., 2009) [38] . QPM has a hard endosperm and enhanced nutritional value, yet its yield is comparable to that of regular maize (Nuss and Tanumihardjo, 2011) [24] . The biological value of QPM is approximately 80%, whereas regular maize ranges from 40% to 57%, due to the improved digestibility and nitrogen uptake in QPM (Bressani, 1992) [3] . QPM looks and tastes similar to normal maize but offers nearly twice the amount of essential amino acids, such as lysine and tryptophan. Moreover, QPM has the utmost biological worth among all food grains. While all cereals, except QPM, lack lysine and other essential amino acids, pulses are generally deficient in methionine, another essential amino acid (Yadav and Chippa, 2005) [43] . Maize productivity is constrained by low fertilizer efficiency, outdated fertilizer recommendations, neglect of nutrients beyond N, P, and K, and declining soil quality. Fertilizers remain the key agricultural input for achieving food production goals in the country, contributing 50-60% of the increase in agricultural output. Yield improvements are expected through the optimization of crop management, as the response of major cereals to fertilizers often falls short of their potential yields. Hybrid maize, in particular, requires high amounts of nutrients, especially nitrogen, phosphorus, and potassium, to enhance and maintain productivity (Banerjee et al., 2014) [1] . Therefore, utilizing increased quantities of NPK fertilizer is crucial for boosting hybrid maize yields. However, the dosage of NPK fertilizer applied should be carefully managed to secure economic benefits while limiting environmental harm (Timsina et al., 2010) [39] . Potassium plays a role in maintaining cellular organization by regulating membrane permeability, keeping the protoplasm properly hydrated, stabilizing the emulsion of colloidal particles, maintaining turgor pressure, and preventing water imbalances in plants (Singh et al., 2003) [37] . Maize is a nutrient-demanding crop, requiring substantial amounts of nitrogen during key growth stages, particularly 30 days after planting and during the pretasselling stage (40 DAS) for optimal productivity. Nitrogen is essential for boosting crop yield because it is a key element of protoplasm and chlorophyll, and is involved in the activity of every living cell. Similarly, phosphorus plays a vital role in energy storage and transfer within the plant, and is an essential component of nucleic acids, phytins, phospholipids, and enzymes. Numerous studies have demonstrated the positive effects of NPK fertilization on maize productivity (Mehta et al., 2005) [19] . Research indicates that postponing sowing reduces seed yield, mostly as a result of shorter plant growth cycles and a decreased Leaf Area Index caused by environmental factors such as high temperatures and a short growing season (Fard et al., 2018). Research also indicates that late planting results in lower seed and dry matter yields compared to ontime planting (Ara et al., 2011). In maize, it has been discovered that delayed seeding lowers the no. of ears, grains per ear, and total grain production (Contarero et al., 2000) [4] . Additionally, postponing the planting date leads to fewer grain rows and fewer grains per row in maize (Khan et al., 2002) [13] . The critical importance of sowing time has been extensively examined across various countries, consistently showing that peak yields are reached when sowing is done at the earliest suitable date for a given location. Delaying the planting date consistently leads to reduced maize grain yields (Panahi et al., 2010) [27] . Identifying the optimal planting date for different environments is crucial for achieving the maximum yield potential of crops. Given the current rainfall patterns, climatic fluctuations, and the availability of high-yielding hybrids, there is a pressing need to research the optimal sowing window and appropriate NPK fertility levels to improve the output of Quality Protein Maize (QPM) under Kashmir conditions. In this context, the present study was undertaken with the objective to find out the response of Influence of Environmental modifications and fertility levels on growth and yield of Quality Protein Maize (QPMH-1).
Materials and Methods
Materials and Methods
Experimental site
The trial was executed with success at the Agronomy Research Farm, FoA, SKUAST-K, Wadura, Sopore, J & K the season of Kharif, 2023. The site featured well-drained soil and consistent topography.
Climate and weather
Wadura is geographically located at a latitude of 34° 34' N and a longitude of 74° 40' E, with a 1580 meters altitude distance from sea level. The weather data recorded at the local Meteorological Observatory of the Kharif season of 2023, is detailed in Appendix I. During this period, the weekly minimum temperatures ranged from 4.49 ℃ to 22.21 °C, while the maximum temperatures varied from 14.86 °C to 34.17 °C (see Fig. 1). The cumulative precipitation documented over the cultivation period of the crop amounted to 386.80 mm.
Physio-chemical properties of soil
Soil samples were randomly sourced from multiple sections in the research area, reaching a depth of 0-15 cm at the outset of the experiment. After sampling, the composite soil was air-dried on paper, then processed by coning and quartering, grinding, and sieving through a 2 mm mesh. The prepared samples were examined for physical and chemical properties, as detailed in Table 1. The analysis revealed that the soil had a neutral pH, a silty clay loam texture, medium organic carbon content, normal electrical conductivity (EC), and medium levels of available nitrogen, phosphorus, and potassium.
| Main Plot | Environmental Modifications |
|---|---|
| S1 | 17th April (16th SMW) |
| S2 | 12th May (19th SMW) |
| S3 | 3rd June (22nd SMW) |
Table text extracted from the original PDF; superscript letters are shown inline. The original table image is below.
View original table image
Experimental details
The experiment included 12 treatments, repeated 3 times, and was arranged using a Split Plot design (Figure 1) SQPMH-1 variety of maize was grown using the spacing of (75 x 20) cm in 36 plots appropriate standard and uniform agronomical / cultural practices and plant protection measures were adopted for raising healthy crop. The various treatments and Fertility levels with their symbols are presented in Table 1 and Table 2 respectively.
| Sub Plot | Fertility Levels |
|---|---|
| F0 | Control |
| F1 | 75% RDF (90:45:22.5) |
| F2 | 100% RDF (120:60:30) |
| F3 | 125% RDF (150:75:37.5) |
Table text extracted from the original PDF; superscript letters are shown inline. The original table image is below.
View original table image
Results
Results
The data on plant height under different treatments, measured at 30-day intervals (Table 3) and illustrated in Fig. 3 and Figure 4. Analysis showed that planting dates and fertility levels significantly affected plant height. Plant height increased rapidly up to 90 days after sowing (DAS), then continued to increase at a slower rate until maturity. Among the sowing dates, the 19 th SWM sowing (S 2 ) resulted in a noticeably greater plant height as opposed to the 16 th SWM (S 1 ) and 22 nd SWM (S 3 ) sowings. The highest plant height of 200.87 cm upon reaching maturity was detected in the 19 th SWM sowing (S 2 ). At the same time, the least height of 180.59 cm was recorded for the 22 nd SWM sowing (S 3 ) at maturity. The data further confirmed that varying fertility levels exerted a significant influence on maize plant height throughout the growing season. The application of 125% RDF (F3) resulted in the highest plant height, significantly exceeding the other fertility levels. Specifically, 125% RDF (F3) achieved a plant height of 205.1 cm at maturity, followed by 100% RDF (F2), which recorded a height of 195.1 cm. The control treatment (F0) registered the fewest plant height at 176.8 cm at maturity. Dry matter accumulation (q ha -1 ) Data on the accumulation of dry matter under varied treatments, recorded at 30-day intervals (Table 4) and illustrated in Fig. 5 and Fig. 6. Interpretation of the data indicates that both sowing dates and fertility levels exerted a profound effect on dry matter accumulation. The accumulation increased rapidly up to 90 days after sowing (DAS), after which it continued to increase at a slower rate until maturity. Among the sowing dates, the 19 th SWM sowing (S2) unveiled a considerably higher DMA When contrasted with the 16 th SWM (S1) and 22 nd SWM (S3) sowings. The 19 th SWM sowing (S2) achieved the utmost DMA of 103.41 q ha⁻¹ at maturity, while the 22 nd SWM sowing (S3) recorded the lowest accumulation of 91.62 q ha⁻¹ at maturity. Further examination of the data exposed that those various levels of fertility exerted a major influence on maize dry matter accumulation throughout the growing season. The application of 125% RDF (F3) resulted in the highest dry matter accumulation, significantly surpassing other fertility levels. Specifically, 125% RDF (F3) recorded an accumulation of 103.28 q ha⁻¹ at maturity, followed by 100% RDF (F2), which recorded 99.26 q ha⁻¹. The lowest dry matter accumulation of 91.68 q ha⁻¹ was apparent within the control (F0) at maturity. The interaction effect of sowing dates and fertility levels on DMA were uncovered to be non-significant throughout the crop growing season.
| Dry matter accumulation (q ha-1) | — | — | — | — |
|---|---|---|---|---|
| Treatment | 30 DAS | 60 DAS | 90 DAS | Harvest |
| Main Factor: Sowing date | ||||
| S1 (16th SWM) | 14.02 | 45.20 | 93.84 | 97.36 |
| S2 (19th SWM) | 15.12 | 47.69 | 100.22 | 103.41 |
| S3 (22nd SWM) | 13.17 | 42.69 | 87.49 | 91.62 |
| SE (m±) | 0.21 | 0.63 | 1.59 | 1.46 |
| CD (p≤0.05) | 0.83 | 2.47 | 6.24 | 5.72 |
| Sub-Factor: Fertility levels | ||||
| F0 (No NPK) | 12.32 | 41.17 | 88.49 | 91.68 |
| F1 (90:45:22.5) | 13.64 | 43.22 | 92.10 | 95.62 |
| F2 (120:60:30) | 14.55 | 46.65 | 95.68 | 99.26 |
| F3(150:75:37.5) | 15.87 | 49.73 | 99.11 | 103.28 |
| SE (m±) | 0.06 | 0.57 | 1.24 | 1.05 |
| CD (p≤0.05) | 0.22 | 1.95 | 4.24 | 3.61 |
| Interaction | NS | NS | NS | NS |
Table text extracted from the original PDF; superscript letters are shown inline. The original table image is below.
View original table image
| Plant height (cm) | — | — | — | — |
|---|---|---|---|---|
| Treatment | 30 DAS | 60 DAS | 90 DAS | Harvest |
| Main Factor: Sowing date | ||||
| S1 (16th SWM) | 35.59 | 134.85 | 187.51 | 191.01 |
| S2 (19th SWM) | 37.94 | 142.39 | 197.70 | 200.87 |
| S3 (22nd SWM) | 32.99 | 125.19 | 177.03 | 180.59 |
| SE (m±) | 0.54 | 1.75 | 2.52 | 2.20 |
| CD (p≤0.05) | 2.14 | 6.89 | 9.88 | 8.63 |
| Sub-Factor: Fertility levels | ||||
| F0 (No NPK) | 29.2 | 121.0 | 174.3 | 176.8 |
| F1 (90:45:22.5) | 33.7 | 129.1 | 183.2 | 186.3 |
| F2 (120:60:30) | 38.1 | 138.7 | 191.5 | 195.1 |
| F3(150:75:37.5) | 41.0 | 147.9 | 200.7 | 205.1 |
| SE (m±) | 0.77 | 2.24 | 2.30 | 2.38 |
| CD (p≤0.05) | 2.62 | 7.69 | 7.91 | 8.18 |
| Interaction | NS | NS | NS | NS |
Table text extracted from the original PDF; superscript letters are shown inline. The original table image is below.
View original table image
SPAD reading
The data on SPAD values under various treatments, recorded at 30-day intervals, is presented in Table 5 and illustrated in Fig. 7 and Fig. 8. Among the different sowing dates, the 19 th SWM sowing (S2) resulted in a pronounced SPAD readings increase as against the 16 th SWM (S1) and 22 nd SWM (S3) sowings. The 19 th SWM sowing (S2) achieved the highest SPAD value of 53.76 at maturity, while the lowest SPAD value of 46.32 was recorded for the 22 nd SWM sowing (S3) at 90 DAS. Regarding fertility levels, the application of 125% RDF (F3) produced an appreciably higher SPAD readings unlike to other fertility levels. Specifically, 125% RDF (F3) recorded the highest SPAD value of 52.4, followed by 100% RDF.
| SPAD Value | — | — | — |
|---|---|---|---|
| Treatment | 30 DAS | 60 DAS | 90 DAS |
| Main Factor: Sowing date | |||
| S1 (16th SWM) | 42.83 | 61.58 | 50.05 |
| S2 (19th SWM) | 46.45 | 65.83 | 53.76 |
| S3 (22nd SWM) | 39.59 | 56.93 | 46.32 |
| SE (m±) | 0.77 | 1.00 | 0.93 |
| CD (p≤0.05) | 3.03 | 3.94 | 3.64 |
| Sub-Factor: Fertility levels | |||
| F0 (No NPK) | 40.3 | 58.4 | 47.6 |
| F1 (90:45:22.5) | 42.1 | 60.4 | 49.2 |
| F2 (120:60:30) | 43.7 | 62.4 | 51.0 |
| F3 (150:75:37.5) | 45.8 | 64.6 | 52.4 |
| SE (m±) | 0.46 | 0.55 | 0.39 |
| CD (p≤0.05) | 1.59 | 1.88 | 1.33 |
| Interaction | NS | NS | NS |
Table text extracted from the original PDF; superscript letters are shown inline. The original table image is below.
View original table image
The interaction effect of sowing dates and fertility levels on SPAD value was non-significant throughout the crop growing season.
Leaf Area Index (LAI)
Leaf Area Index (LAI) under various treatments, recorded at 30-day intervals, is presented in Table 6 and illustrated in Figures 9 and10. The analysis shows that both sowing dates and fertility levels significantly affected the LAI. The LAI increased rapidly up to 60 DAS, followed by a decline until the maturity stage. Among the sowing dates, the 19 th SWM sowing (S2) resulted in a significantly greater values of Leaf Area Index compared to the 16 th SWM (S1) and 22 nd SWM (S3) sowings. The highest LAI of 1.41 at maturity was recorded for the 19 th SWM sowing (S2), while the lowest LAI of 1.14 was observed in the 22 nd SWM sowing (S3) at maturity. Additionally, the results showed that throughout the growth season, the LAI of maize was significantly impacted by varying levels of fertility. The application of 125% RDF (F3) produced the highest LAI, significantly exceeding other fertility levels. Specifically, 125% RDF (F3) recorded an LAI of 1.38, followed by 100% RDF (F2) with an LAI of 1.31 at maturity. The lowest LAI of 1.14 was found in the control treatment (F0) at maturity. The interaction effect of sowing dates and fertility levels on LAI was significant at 60DAS. Significantly higher LAI (5.92) was observed in S2F3 (19 th SWM, 125%RDF) treatment combination and lowest LAI (3.77) was observed in the treatment combination of S3F0 (22 nd SWM, Control). 7 lists the number of days needed to attain each phenological stage. The number of days required to achieve these phenological stages showed marked variation based on the fertility level and sowing date, according to the data analysis. Among the sowing dates, the 16 th SWM (S1) sowing took the longest time to reach the knee-high stage (38.0 days), tasselling stage (69.0 days), silking stage (74.0 days), and maturity (115.0 days). In contrast, the 22 nd SWM (S3) sowing required the shortest time to reach the kneehigh stage (34.0 days), tasselling stage (62.0 days), silking stage (67.0 days), and maturity (107.0 days). Additionally, the data showed that different fertility levels had a significant impact on days required to reach the various phenological stages in maize. Among the fertility levels, the application of 125% RDF (F3) resulted in the longest time to reach the knee-high stage (38.0 days), tasselling stage (67.0 days), silking stage (74.0 days), and maturity (117.0 days). Conversely, the control treatment (F0) required the fewest days to reach the knee-high stage (34.0 days), tasselling stage (64.0 days), silking stage (67.0 days), and maturity (106.0 days). The interaction effect of sowing dates and fertility levels on days taken to reach different phenological stages was nonsignificant. The lowest cob number per plant (1.12) was observed in the control treatment (F0). Number of cobs plant-1 was not significantly altered by the interaction among planting dates and fertility levels.
| (Main x Sub plots) | S1 (16th SWM) | S2 (19th SWM) | S3 (22nd SWM) |
|---|---|---|---|
| F0 (No NPK) | 5.02 | 5.70 | 3.77 |
| F1 (90:45:22.5) | 5.34 | 5.65 | 4.17 |
| F2 (120:60:30) | 5.36 | 5.78 | 4.80 |
| F3 (150:75:37.5) | 5.48 | 5.92 | 5.02 |
| Factor (B) at same, Level of A | SE (m±) CD (p≤0.05) | 0.13 0.28 | |
| Factor (A) at same, Level of B | SE (m±) CD (p≤0.05) | 0.09 0.34 |
Table text extracted from the original PDF; superscript letters are shown inline. The original table image is below.
View original table image
| Leaf area index | — | — | — | — | — |
|---|---|---|---|---|---|
| Treatment | 30 DAS | 60 DAS | 90 DAS | Harvest | |
| Main Factor: Sowing date | |||||
| S1 (16th SWM) | 1.29 | 5.30 | 3.68 | 1.27 | |
| S2 (19th SWM) | 1.42 | 5.76 | 4.07 | 1.41 | |
| S3 (22nd SWM) | 1.16 | 4.44 | 3.37 | 1.14 | |
| SE (m±) | 0.02 | 0.07 | 0.05 | 0.02 | |
| CD (p≤0.05) | 0.09 | 0.27 | 0.18 | 0.08 | |
| Sub-Factor: Fertility levels | |||||
| F0 (No NPK) | 1.16 | 4.83 | 3.38 | 1.14 | |
| F1 (90:45:22.5) | 1.26 | 5.05 | 3.63 | 1.24 | |
| F2 (120:60:30) | 1.33 | 5.31 | 3.81 | 1.31 | |
| F3 (150:75:37.5) | 1.41 | 5.47 | 3.99 | 1.38 | |
| SE (m±) | 0.02 | 0.04 | 0.05 | 0.02 | |
| CD (p≤0.05) | 0.06 | 0.14 | 0.16 | 0.07 | |
| Interaction | NS | S | NS | NS |
Table text extracted from the original PDF; superscript letters are shown inline. The original table image is below.
View original table image
The data related to cob length without husk is presented in Table 8. The analysis shows that both sowing dates and fertility levels significantly affected cob length. Among the sowing dates, the 19 th SWM sowing (S2) produced a significantly longer cob length without husk compared to the 16 th SWM (S1) and 22 nd SWM (S3) sowings. The 19 th SWM sowing (S2) recorded the maximum cob length (23.74 cm) without husk, while the minimum cob length (18.66 cm) was without husk was observed in the 22 nd SWM sowing (S3). Regarding fertility levels, applying 125% RDF (F3) resulted in a significantly longer cob length (23.78 cm) without husk compared to 100% RDF (F2), 75% RDF (F1), and the control (F0). The shortest cob length (18.82 cm) without husk was noted in the control treatment (F0). The study did not uncover a significant link between the dates of sowing and the fertility levels with respect to cob length.
| (Main x Sub plots) | S1 (16th SWM) | S2 (19th SWM) | S3 (22nd SWM) |
|---|---|---|---|
| F0 (No NPK) | 12.77 | 12.92 | 11.61 |
| F1 (90:45:22.5) | 13.00 | 14.14 | 12.41 |
| F2 (120:60:30) | 14.29 | 14.98 | 12.62 |
| F3 (150:75:37.5) | 14.62 | 16.63 | 12.95 |
| Factor (B) at same SE (m±) 0.48 | |||
| Level of A CD (p≤0.05) 1.06 | |||
| Factor (A) at same SE (m±) 0.35 | |||
| Level of B CD (p≤0.05) 1.24 |
Table text extracted from the original PDF; superscript letters are shown inline. The original table image is below.
View original table image
| (Main x Sub plots) | S1 (16th SWM) | S2 (19th SWM) | S3 (22nd SWM) |
|---|---|---|---|
| F0 (No NPK) | 4.85 | 5.18 | 4.20 |
| F1 (90:45:22.5) | 5.21 | 5.95 | 4.42 |
| F2 (120:60:30) | 5.37 | 6.58 | 4.66 |
| F3 (150:75:37.5) | 5.99 | 6.87 | 4.77 |
| Factor (B) at same level of A | SE (m±) CD (p≤0.05) | 0.23 0.54 | |
| Factor (A) at same level of B | SE (m±) CD (p≤0.05) | 0.23 0.54 |
Table text extracted from the original PDF; superscript letters are shown inline. The original table image is below.
View original table image
| Yield attributes | — | — | — | — | — | — | — | — |
|---|---|---|---|---|---|---|---|---|
| Treatment | No of cobs | cob length (cm) | cob dia. (cm) | Ear length (cm) | cob weight (g) | No of kernel rows/ cob | No of grains/ cob | Seed Index (g) |
| Main Factor: Sowing dates | ||||||||
| S1 (16th SWM) | 1.17 | 21.30 | 5.36 | 37.89 | 182.94 | 13.67 | 335.83 | 21.36 |
| S2 (19th SWM) | 1.20 | 23.74 | 6.14 | 39.78 | 193.41 | 14.67 | 361.67 | 22.68 |
| S3 (22nd SWM) | 1.13 | 18.66 | 4.51 | 35.98 | 172.36 | 12.40 | 310.08 | 20.00 |
| SE (m±) | 0.01 | 0.51 | 0.12 | 0.45 | 2.85 | 0.24 | 4.71 | 0.33 |
| CD (p≤0.05) | 0.05 | 2.01 | 0.46 | 1.78 | 11.19 | 0.95 | 18.50 | 1.28 |
| Sub-Factor: Fertility levels | ||||||||
| F0 (No NPK) | 1.12 | 18.82 | 4.74 | 36.11 | 174.37 | 12.43 | 321.77 | 20.25 |
| F1 (90:45:22.5) | 1.15 | 20.41 | 5.19 | 37.29 | 177.79 | 13.18 | 330.55 | 20.96 |
| F2 (120:60:30) | 1.18 | 21.91 | 5.53 | 38.40 | 186.58 | 13.96 | 340.66 | 21.69 |
| F3 (150:75:37.5) | 1.21 | 23.78 | 5.87 | 39.72 | 192.86 | 14.73 | 350.44 | 22.47 |
| SE (m±) | 0.01 | 0.42 | 0.08 | 0.29 | 1.25 | 0.15 | 2.00 | 0.12 |
| CD (p≤0.05) | 0.02 | 1.45 | 0.27 | 1.01 | 4.29 | 0.53 | 6.85 | 0.41 |
| Interaction | NS | NS | S | NS | NS | S | NS | NS |
Table text extracted from the original PDF; superscript letters are shown inline. The original table image is below.
View original table image
The data on ear length is presented in Table 8, and analysis indicated that both sowing dates and fertility levels had a significant impact on ear length. Among the sowing dates, the 19 th The connection between the fertility levels and the planting dates had no discernible effect on ear length.
The data analysis revealed that cob diameter was affected significantly by sowing dates and fertility levels (Table 8). Among the sowing dates, the 19 th SWM sowing (S2) resulted in the largest cob diameter of 6.14 cm, whereas the 22 nd SWM sowing (S3) had the smallest cob diameter of 4.51 cm. For fertility levels, the application of 125% RDF (F3) produced a significantly larger cob diameter of 5.87 cm compared to 100% RDF (F2), 75% RDF (F1), and the control (F0). The control treatment (F0) had the smallest cob diameter of 4.74 cm. The sowing date and fertility level interaction effect also had a substantial impact on cob diameter (Table 8.1). The maximum cob diameter (6.87 cm) was noted in the treatment comprising 19 th SWM sowing with 125% RDF (S2F3), while the minimum cob diameter (4.20 cm) was noted in 22 nd SWM sowing with the control (S3F0) treatment combination.
The data on cob weight is presented in Table 8. Analysis shows that both sowing dates and fertility levels significantly affected cob weight. Among the sowing dates, the 19 th SWM sowing (S2) achieved a significantly higher cob weight of 193.41 g compared to the 22 nd SWM sowing (S3), which had a cob weight of 172.36 g. The 16 th SWM sowing (S1) was statistically comparable to both the 22 nd SWM (S3) and 19 th SWM (S2) sowings in recording cob weight. As far as fertility levels are concerned, the application of 125% RDF (F3) resulted in a significantly greater cob weight of 192.86 g compared to 100% RDF (F2), 75% RDF (F1), and the control (F0). The lowest cob weight (174.37 g) was noted in control (F0). The interaction impact of sowing dates and fertility levels on cob weight came out to be non-significant.
Number of kernel rows per cob
The number of kernel rows cob-1, as shown in
Number of grains per cob
The data pertaining to number of grains cob-1 as indicated in Table 8, indicated that both sowing dates and fertility levels considerably affected this metric. Among the three sowing dates, the 19 th SWM sowing (S2) produced notably higher grain number cob-1, averaging 361.67, whereas, 22 nd SWM sowing (S3) had the lowest average of 310.08 grains per cob. Regarding fertility levels, applying 125% RDF (F3) resulted in a higher grain cob-1, averaging 350.44, compared to 100% RDF (F2), 75% RDF (F1), and the control (F0). The control treatment (F0) recorded the lowest grains cob-1 (321.77).
No notable interaction occurred between the number of grains cob-1 and the planting dates and fertility levels.
The data on seed index, shown in Table 8, reveals that both sowing dates and fertility levels significantly influenced seed index. The 19 th SWM sowing (S2) generated the highest seed index figure of 22.68 g, while the 22 nd SWM sowing (S3) had the lowest seed index at 20.0 g. Regarding fertility levels, applying 125% RDF (F3) produced the highest seed index (22.47 g), followed by 100% RDF (F2), 75% RDF (F1), and the control (F0). A seed index (20.25 g), the minimum observed, was acquired in the F0 treatment. The interaction between sowing dates and fertility levels had no valuable effect on the seed index. The data in Table 9 and illustrated in Figures 11 and12 indicated that both sowing dates and fertility levels markedly changed grain yield. Among different sowing dates, the 19 th SWM sowing (S2) achieved maximum grain yield (5.39 t ha -1 ), significantly outperforming the 16 th SWM sowing (S1) and the 22 nd SWM sowing (S3), which had the lowest yield of 4.28 t ha -1 . Different fertility levels also had a significant impact on maize grain yield. The application of 125% RDF (F3) resulted in maximum grain yield (5.61 t ha - 1 ), surpassing all other fertility levels. This was followed by 100% RDF (F2) with a grain yield of 5.21 t ha -1 . The control treatment (F0) produced the lowest grain yield of 3.92 t ha -1 . Significant interaction of sowing dates and fertility levels was observed on grain yield (Table 9.1). Significantly highest grain yield (6.29 t ha -1 ) was observed in the treatment combination of S2F3 (19 th SWM, 125%RDF) and lowest grain yield (3.60 t ha -1 ) was observed in treatment combination of S3F0 (22 nd SWM, Control).
| (Main x Sub plots) | S1 (16th SWM) | S2 (19th SWM) | S3 (22nd SWM) |
|---|---|---|---|
| F0 (No NPK) | 9.29 | 10.24 | 8.75 |
| F1 (90:45:22.5) | 10.19 | 11.12 | 9.43 |
| F2 (120:60:30) | 11.55 | 12.57 | 10.46 |
| F3 (150:75:37.5) | 12.45 | 13.44 | 11.46 |
| Factor (B) at SE (m±) 0.17 | |||
| Same level of A CD (p≤0.05) 0.32 | |||
| Factor (A) at SE (m±) 0.11 | |||
| Same level of A CD (p≤0.05) 0.42 |
Table text extracted from the original PDF; superscript letters are shown inline. The original table image is below.
View original table image
| (Main x Sub plots) | S1 (16th SWM) | S2 (19th SWM) | S3 (22nd SWM) |
|---|---|---|---|
| F0 (No NPK) | 3.78 | 4.39 | 3.60 |
| F1 (90:45:22.5) | 4.28 | 4.97 | 3.98 |
| F2 (120:60:30) | 5.19 | 5.90 | 4.55 |
| F3 (150:75:37.5) | 5.59 | 6.29 | 4.98 |
| Factor (B) at SE (m±) 0.11 | |||
| Same level of A CD (p≤0.05) 0.28 | |||
| Factor (A) at SE (m±) 0.09 | |||
| Same level of A CD (p≤0.05) 0.31 |
Table text extracted from the original PDF; superscript letters are shown inline. The original table image is below.
View original table image
| Yield | — | — | — | — | — |
|---|---|---|---|---|---|
| Treatment | Grain yield (t ha-1) | Stover yield (t ha-1) | Biological yield (t ha-1) | Harvest index (%) | Shelling percentage (%) |
| Main Factor: Sowing date | |||||
| S1 (16th SWM) | 4.71 | 6.16 | 10.87 | 43.12 | 59.56 |
| S2 (19th SWM) | 5.39 | 6.46 | 11.85 | 45.33 | 62.47 |
| S3 (22nd SWM) | 4.28 | 5.75 | 10.02 | 42.60 | 56.72 |
| SE (m±) | 0.06 | 0.09 | 0.09 | 0.57 | 0.72 |
| CD (p≤0.05) | 0.22 | 0.36 | 0.34 | 2.23 | 2.82 |
| Sub-Factor: Fertility levels | |||||
| F0 (No NPK) | 3.92 | 5.50 | 9.42 | 41.58 | 57.4 |
| F1 (90:45:22.5) | 4.41 | 5.83 | 10.24 | 42.98 | 58.9 |
| F2 (120:60:30) | 5.21 | 6.31 | 11.52 | 45.13 | 60.3 |
| F3(150:75:37.5) | 5.61 | 6.83 | 12.44 | 45.04 | 61.8 |
| SE (m±) | 0.04 | 0.02 | 0.05 | 0.23 | 0.40 |
| CD (p≤0.05) | 0.14 | 0.06 | 0.16 | 0.78 | 1.38 |
| Interaction | S | NS | S | NS | NS |
Table text extracted from the original PDF; superscript letters are shown inline. The original table image is below.
View original table image
It was evident from the data in Table 9 that sowing dates and fertility levels significantly affected Stover yield. The 19 th SWM sowing (S2) achieved a significantly higher Stover yield of 6.46 t ha -1 compared to the 22 nd SWM sowing (S3), which had a Stover yield of 5.75 t ha -1 . However, the 16 th SWM sowing (S1) was rated equally with 19 th SWM (S2). Regarding fertility levels, the application of 125% RDF (F3) resulted in a significantly higher Stover yield of 6.83 t ha -1 compared to 100% RDF (F2), 75% RDF (F1), and the control (F0). The control treatment (F0) had the lowest Stover yield of 5.50 t ha -1 . The interaction effect of sowing dates and fertility levels on cob weight came out to be non-significant.
The data in Table 9 indicated significant differences in biological yield among various sowing dates and fertility levels. The 19 th SWM sowing (S2) achieved highest biological yield (11.85 t ha -1 ) surpassed significantly the yields from the 16 th SWM (S1) and 22 nd SWM (S3) sowings. The lowest biological yield of 10.02 t ha -1 was recorded for the 22 nd SWM sowing (S3). Pertaining to fertility levels, applying 125% RDF (F3) attained the top biological yield (12.44 t ha -1 ), significantly surpassing the other fertility levels. This was followed by 100% RDF (F2), which produced a biological yield of 11.52 t ha -1 . The control treatment (F0) yielded the lowest biological yield, at 9.42 t ha -1 . The interaction of sowing dates and fertility levels was noted to be significant on biological yield (Table 9.2). Significantly highest biological yield (13.44 t ha -1 ) was apparent in the S2F3 (19 th SWM, 125% RDF) treatment combination and lowest biological yield (8.75 t ha -1 ) was observed in treatment combination of S3F0 (22 nd SWM, Control).
The data on harvest index, presented in Table 9, shows that both sowing dates and fertility levels significantly influenced the harvest index. The 19 th SWM sowing (S2) achieved a significantly higher harvest index of 45.33%, compared to the 22 nd SWM sowing (S3), which had a harvest index of 42.60%. However, 16 th SWM (S1) was found to be at par with 22 nd SWM (S3) and 19 th SWM (S2). Among fertility levels, the application of 125% RDF (F3) resulted in a significantly higher harvest index of 45.04% compared to 100% RDF (F2), 75% RDF (F1), and the control (F0). The control treatment (F0) had the lowest harvest index, at 41.58%. The interaction effect of sowing dates and fertility levels on harvest index was determined to have negligible impact.
The data in Table 9 revealed that shelling percentage was heavily impacted by both sowing dates and fertility levels. Among the sowing dates, the 19 th SWM sowing (S2) achieved the highest shelling percentage of 62.47%, significantly higher than the 16 th SWM (S1) and 22 nd SWM sowings (S3), recorded lowest shelling percentage of 56.72%. Additional findings exposed that different fertility levels significantly impacted shelling percentage. Applying 125% RDF (F3) resulted in the highest shelling percentage of 61.8%, surpassing 100% RDF (F2), which had a shelling percentage of 60.3%. The lowest shelling percentage of 57.4% was reflected in the F0 treatment (control). The harvest index did not disclose a significant interaction between the planting dates and fertility levels.
Research findings indicated that the height of maize plants is greatly influenced by both the dates of sowing and the fertility levels. The height of maize plants was significantly influenced by sowing dates and fertility levels. Sowing on 19 th SWM (S2) produced the tallest plants, followed by 16 th SWM (S1), while the shortest plants were recorded with 22 nd SWM (S3), likely due to unfavourable late-season conditions. These results are supported by Moosavi et al. (2012) [16] . These findings align with the observations of Moosavi et al. (2012) [16] , who reported a significant reduction in plant height with delayed maize sowing. Among fertility treatments, 125% RDF (F3) resulted in maximum plant height, attributed to better nutrient availability and balanced nutrition. The control (F0) produced the shortest plants due to nutrient deficiency, highlighting the adverse effects of nutrient deficiency on plant growth and reduced biomass. Equivalent results have been documented by Paradkar and Sharma (1994) [25] , Roongtanakiat et al. (2000), Dutta and Singh (2002) [6] , Kumar et al. (2005) [14] , and Jat et al. (2006) [10] . The statistical analysis found no notable impact from the combined effects of sowing dates and fertilizer amounts on height of plant during all phases of crop development.
Sowing on 19 th SWM (S2) led to the highest dry matter accumulation due to favourable weather during key growth stages, while the lowest was recorded with the 22 nd SWM (S3) sowing. These findings are consistent with Girijesh et al. (2011) [8] . Fertility level F3 (125% RDF) significantly enhanced dry matter accumulation, indicating the importance of nutrient availability. The lowest accumulation was under the control (F0), highlighting the negative impact of nutrient deficiency. These results align with Verma et al. (2011) [42] . No significant interaction was recorded.
SPAD reading
SPAD values were significantly affected by both sowing dates and fertility levels. The highest SPAD was recorded under 19 th SWM (S2), indicating better chlorophyll content and plant health, while the lowest was observed in the 22 nd SWM (S3) sowing. These observations support what Mir et al. (2023) [21] found when they worked with direct drumseeded rice. Fertility level F3 (125% RDF) resulted in the highest SPAD value due to enhanced chlorophyll synthesis, while the control (F0) recorded the lowest. Like findings were noted by Varvel et al. (1997) [40] also demonstrated that N fertilizer significantly increased SPAD readings. No interaction effect was observed.
Leaf area index (LAI)
Sowing on 19 th SWM (S2) recorded the highest LAI, followed by S1, while the lowest was observed under S3. Higher LAI at S2 indicates better growing conditions for leaf expansion. These results agree with Moosavi et al. (2012) [16] . Fertility level F3 (125% RDF) produced the maximum LAI, while F 0 recorded the lowest. These results were supported by Verma & Joshi (1998) [41] and Shivay & Singh (2000) [33] , who noted improvements in LAI with increased nitrogen levels.
Days required to reach various phenological stages
Sowing date significantly influenced the duration of phenological stages. Maize sown on 16 th SWM (S1) took longer to reach each stage, while the 22 nd SWM (S3) sowing matured faster due to higher temperatures. These results are supported by Khan et al. (2002) [13] and Kim et al. (1999) [12] . Under 125% RDF (F3), phenological stages were delayed due to vigorous growth, whereas the shortest duration was recorded under the control (F0). These findings are in agreement with Mohammadi et al. (2014) [17] and Sendra et al. (1993) [35] . No significant interaction was observed. [13] , Namaka et al. (2008), and Hassan et al. (1998) [9] . Fertility level F3 (125% RDF) produced the best results for all yield attributes, while the control (F0) recorded the lowest. These results align with findings from Rizwan et al. (2003) [29] . Additionally, it was discovered by Sabir et al. (2000) [31] and Mehmood et al. (2001) [18] that greater nitrogen rates led to a considerable increase in the no. of grains per cob, while Shanti et al. (1997) [32] also observed significant improvements in yield attributes such as cob length, cob girth, and 1000-grain weight with increased nitrogen application.
Yield of QPM as influenced by different sowing dates and fertility levels
Grain yield, Stover yield, biological yield, harvest index, and shelling percentage were significantly influenced by sowing dates and fertility levels. Maximum values were observed for the 19 th SWM (S2) sowing due to optimal growing conditions, while the 22 nd SWM (S3) sowing yielded the lowest due to reduced crop duration and environmental stress. These observations are supported by Jaliya et al. (2008) [11] , Namaka et al. (2008), and Khan et al. (2002) [13] . Among fertility levels, F3 (125% RDF) significantly enhanced all yield components. The lowest values were recorded under the control (F0), highlighting the negative impact of nutrient stress. These findings are in agreement with Mungai et al. (1999) [22] , Singh et al. (2000) [33] , and Parmar & Sharma (2001) [26] . A significant interaction was observed for grain and biological yield under the S2F3 combination.
Conclusion
The study concluded that sowing Quality Protein Maize (QPM) on 19 th SWM yielded superior results compared to earlier (16 th SWM) and later (22 nd SWM) sowing dates pertaining to growth characteristics (plant height, dry matter accumulation, SPAD value, and LAI), yield attributes, overall yield, protein content, nutrient uptake, and nutrient use efficiencies. Results showed that the greatest level of improvement was attained with 125% RDF (150:75:37.5) enhancing crop growth characteristics, yield-contributing factors, overall yield, protein content, nutrient uptake, and agro-meteorological indices, indicating better nutrient utilization by the crop. Therefore, sowing QPM on 19 th SWM with 125% RDF application is recommended for optimal productivity (5.39 and 5.61 t ha -1 ) and profitability (BCR of 1.94) in the temperate conditions of the Kashmir valley.
Figures and tables from the paper
| Phenology | — | — | — | — |
|---|---|---|---|---|
| Treatment | Knee high | Tasselling | Silking | Maturity |
| Main Factor: Sowing date | ||||
| S1 (16th SWM) | 38 | 69 | 74 | 115 |
| S2 (19th SWM) | 36 | 65 | 70 | 111 |
| S3 (22nd SWM) | 34 | 62 | 67 | 107 |
| SE (m±) | 0.46 | 0.86 | 0.86 | 1.02 |
| CD (p≤0.05) | 1.79 | 3.38 | 3.36 | 4.00 |
| Sub-Factor: Fertility levels | ||||
| F0 (No NPK) | 34 | 64 | 67 | 106 |
| F1 (90:45:22.5) | 35 | 65 | 69 | 109 |
| F2 (120:60:30) | 37 | 66 | 72 | 113 |
| F3 (150:75:37.5) | 38 | 67 | 74 | 117 |
| SE (m±) | 0.31 | 0.28 | 0.59 | 1.03 |
| CD (p≤0.05) | 1.07 | 0.97 | 2.02 | 3.54 |
| Interaction | NS | NS | NS | NS |
Table text extracted from the original PDF; superscript letters are shown inline. The original table image is below.
View original table image
References
43 in the original paper- Banerjee H, Goswami R, Chakraborty S, Dutta S, Majumdar K, Satyanarayana T, et al. Understanding biophysical and socio-economic determinants of maize (Zea mays L.) yield variability in eastern India. NJAS Wagening J Life Sci. 2014;70-71:79-93.
- Birun Ara A, Shekari F, Hassanpouraghdam MB, Khorshidi MB, Esfandyari E. Effects of water deficit stress on yield, yield components and phenology of canola (Brassica napus L.) at different growth stages. J Food Agric Environ. 2011;9(3-4):506-509.
- Bressani R. Biological Value and Digestibility of Quality Protein Maize (QPM) Compared to Regular Maize. J Nutr Sci. 1992;20(3):123-135.
- Contarero MG, Luque MG, Rubiolo OJ. Effect of sowing date and planting densities on grain number and yield of maize. Agric Sci. 2000;17(1):3-10.
- DES. Agriculture statistics at glance. Directorate of Economics and Statistics; 2020.
- Dutta D, Singh S. Integrated use of Azotobacter inoculation, FYM and nitrogen in composite maize. Agron Digest. 2002;2:45-47.
- FAO. Statistical data. Food and Agricultural Organisation of United Nations; 2020. http://www.fao.org/faostat/en
- Girijesh GK, Kumaraswamy AS, Sridhara SD, Kumar MD, Vageesh TS, Nataraju SP. Heat use efficiency and helio-thermal units for maize genotypes as influenced by dates of sowing under southern transitional zone of Karnataka state. Int J Sci Nat. 2011;2(3):529-533.
- Hassan KH. Response of some maize cultivar to early planting dates under saline conditions at Siwa Oasis. Ann Agric Sci. 1998;43:391-401.
- Jat V. Effect of fertilizer levels with different dates of sowing on growth, yield and quality of sweet corn (Zea mays Saccharata S.). [M.Sc. Thesis]. MPKV, Rahuri; 2006.
- Jaliya MM, Falaki AM, Mahmud M, Sani YA. Effect of sowing date and NPK fertilizer rate on yield and yield components of quality protein maize (Zea mays L.). Agric Biol Sci. 2008;3(2):23-29.
- Kim JD, Kim DA, Park HS, Kim SG. Effect of planting dates and hybrid on forage yield and quality of corn for silage. Korean Soc Grassland Sci. 1999;19:211-220.
- Khan N, Qasim M, Ahmad F, Naz F, Khan R, Khanzada SA, et al. Effect of sowing dates on yield of maize under agroclimatic condition of Kaghan Valley. Asian J Plant Sci. 2002;1(2):146-147.
- Kumar A, Gautam RC, Singh ST, Rana KS. Growth, yield and economics of maize-wheat cropping sequence as influenced by integrated nutrient management. Indian J Agric Sci. 2005;75(11):709-711.
- Ma GS, Xue JQ, Lu HD, Zhang RH, Tai SJ, Ren JH. Effects of planting date and density on population physiological indices of summer corn (Zea mays L.) in central Shaanxi irrigation area. Ying Yong Sheng Tai Xue Bao. 2007;18(6):1247-1253.
- Moosavi SG, Seghatoleslami MJ, Moazeni A. Effect of planting date and plant density on morphological traits, LAI and forage corn yield. Int Res J Appl Basic Sci. 2012;3(1):57-63.
- Mohammadi GR, Koohi Y, Ghobadi M, Najaphy A. Effects of seed priming, planting density and row spacing on seedling emergence and some phenological indices of corn (Zea mays L.). Philipp Agric Sci. 2014;97(3):300-306.
- Mehmood MT, Maqsood M, Awan TH, Sarwar R, Hussain HI. Effect of different level of nitrogen and intra row plant spacing on yield components of maize. Pak J Agric Sci. 2001;38:48.
- Mehta YK, Shakhawat MS, Singhi SM. Influence of sulphur, phosphorus and farmyard manure on yield attributes and yield of maize (Zea mays L.) in southern Rajasthan conditions. Indian J Agron. 2005;50:203-205.
- Messing J, Rutgers B. Development and Advancements in Quality Protein Maize (QPM). J Agric Res. 2017;32(3):45-56.
- Mir MS, Singh P, Bhat TA, Kanth RH, Nazir A, AlAshkar I, et al. Influence of sowing time and weed management practices on the performance and weed dynamics of direct drum seeded rice. ACS Omega. 2023;8(29):25861-25876.
- Mungai NW, Macharia CN, Kamau AW. The effect of organic and inorganic phosphorus and time of split application of nitrogen on maize in Kenya; 1999.
- Namakka A, Abubakar IU, Sadik IA, Sharifia AI, Hassan AH. Effect of sowing date and nitrogen level on the yield and yield components of two extra early maize varieties in Sudan Savanna of Nigeria. ARPN J Agric Biol Sci. 2008;3(2):1-5.
- Nuss ET, Tanumihardjo SA. Quality protein maize for Africa: closing the protein inadequacy gap in vulnerable populations. Adv Nutr. 2011;2:217-224.
- Paradkar VK, Sharma RK. Response of winter maize + pea intercropping to fertilizers. Indian J Agron. 1994;39(3-4):379-381.
- Parmar DK, Sharma V. Nitrogen requirement of single hybrid maize wheat system under rainfed conditions. Indian J Agric Sci. 2001;71:252-254.
- Panahi M, Nsaeri R, Soleimani R. Efficiency of some sweet corn hybrids at two sowing dates in central Iran. Middle-East J Sci Res. 2010;6(1):51-55.
- Pandey R, Sharma S, Singh S. Quality Protein Maize (QPM): An Overview of Essential Protein and Agronomic Traits. J Crop Improv. 2016;43(2):123-135.
- Rizwan M, Maqsood M, Rafiq M, Saeed M, Ali Z. Maize (Zea mays L.) Response to split application of nitrogen. Int J Agric Biol. 2003;5(1):19-21.
- Roongtanakiar N, Chairoj P, Chookhoo SN. Fertility Improvement of sandy soil by Vetiver grass mulching and compost. Kasetsart J Nat Sci. 2000;34(3):332-338.
- Sabir MR, Ahmad I, Shazad MA. Effect of nitrogen and phosphorus on yield and quality of two hybrids of maize. J Agric Res. 2000;38:339.
- Shanti K, Rao VP, Reddy MR, Reddy MS, Sharma PS. Response of hybrid and composite maize to different levels of nitrogen. Indian J Agric Sci. 1997;67:326-327.
- Singh DP, Rana NS, Singh RP. Dry matter production and nitrogen uptake in winter maize (Zea mays) based intercropping system under different levels of nitrogen. Indian J Agron. 2000;45:676-680.
- Saeid H, Darbandi MH. Effects of nitrogen fertilizer on chlorophyll content and other leaf indicate in three cultivars of maize (Zea mays L.). World Appl Sci J. 2011;15(12):1806-1811.
- Sendra J, Carreres R, Pomares F, Estela M, Tarazona F. Effect of nitrogen, phosphorus and potassium fertilizer on yield and vegetative development of rice in Valencia. Investig Agrasica Prod Prot Veg. 1993;8(2):221-234.
- Shivay YS, Singh RP. Growth, yield attributes, yields and nitrogen uptake of maize (Zea mays) as influenced by cropping systems and nitrogen levels. Ann Agric Res. 2000;21(4):494-498.
- Singh RN, Sulatiya R, Ghata KR. Effect of higher application of nitrogen and potassium over recommended level on growth, yield and yield attribute of late sown winter maize (Zea mays L.). Crop Res. 2003;26(1):71-74.
- Sofi PA, Shafiq AW, Rather AG, Shabir HW. Quality protein maize (QPM): Genetic manipulation for the nutritional fortification of maize. J Plant Breed Crop Sci. 2009;1(6):244-253.
- Timsina J, Jat ML, Majumdar K. Rice-maize systems in South Asia: Current status, future prospects and research priorities for nutrient management. Plant Soil. 2010;335:65-82.
- Varvel GE, Schepers JS, Francis DD. Ability for in season correction of nitrogen deficiency in using chlorophyll meters. Soil Sci Soc J. 1997;61:1233-1239.
- Verma S, Joshi Y. Effect of nitrogen and seed rate on leaf area index, nitrogen content, nitrogen uptake and dry matter yield of Teosinte xxi (Euchlaena mexicana Schrad) at different growth stages. Forage Res. 1998;24(1):45-47.
- Verma NK. Integrated nutrient management in winter maize (Zea mays L.) sown at different dates. J Plant Breed Crop Sci. 2011;3(8):161-167.
- Yadav KK, Chippa BR. Effect of organic and inorganic soil amendments on yield and nutrient uptake of wheat irrigated with high RSC water. Curr Agric. 2005;29(12):87-90.