
Research article · 2025 · Full text
International Journal of Agriculture and Food ScienceAssessment of genetic variability in chickpea (Cicer arietinum L.)
Volume 7(8) · Pages 1390–1395 · DOI: 10.33545/2664844x.2025.v7.i8n.715 ↗
Research areasGenetic and Environmental Crop StudiesAgricultural pest management studiesBotanical Research and Chemistry
Abstract
Author-writtenThe present investigation conducted to evaluate forty-four diverse chickpea genotypes to estimate genetic variability, heritability and genetic advance, correlation coefficient, path analysis during Rabi season, 2023-2024. Results showed that there were highly significant differences among genotypes for all the traits. On combined analysis of all genotypes it was found that estimations for all the characters genotypic coefficients of variation (GCV) were lower than those for their phenotypic coefficients of variation (PCV. Highest value of GCV and PCV for the seed yield per plant, number of primary branches and secondary branches showed high degree of variability for those two traits. Heritability is a good indicator of character transmission from parents to offspring (Falconer, 1981). The current study showed high heritability for the majority of characteristics in chickpea. High estimate of genetic advance as percent of mean was seen in seed yield per plant, followed by 100 seed weight, harvest index, number of secondary branches and number of pods per plant. Seed yield per plant exhibited positive and significant correlation with, Pods per plant, seed per pod, number of primary branches, number of secondary branches, 100 seed weight and harvest index at genotypic and phenotypic level. The results of a path coefficient analysis reported that the 100 seed weight and harvest index had the most favourable direct effects on yield. The Mahalanobis D2 cluster analysis categorized the forty four genotypes into seven distinct clusters, indicating genetic diversity in genotypes. Cluster III and VI exhibited particularly high inter cluster distances. Results confirms that genotypes NDG 22-10, Phule G 1521-12-2, BG 4047, Phule Vikram in cluster IV performing better traits.
Summary
Source-checkedPlain-language reading of the full paper, prepared with AI and checked against the text. Each point links to the authors' own words.
Why it matters
- Chickpea is one of the most widely grown and oldest legume crops globally. View evidence ↗
- India is the world's leading producer of chickpea, producing 115.76 lakh tonnes from 104.74 lakh hectares. View evidence ↗
- The success of improving crops through selection depends directly on the amount of genetic variability present in the breeding material. View evidence ↗
What they did
- Field experiments were conducted at the Pulse Improvement Project, MPKV, Rahuri, during the 2023-2024 Rabi season. View evidence ↗
- Ten quantitative traits were measured, including seed yield per plant, plant height, and various branching and pod characteristics. View evidence ↗
What they found
- The highest genotypic coefficient of variation (GCV) was found in seed yield per plant (37.51%), followed by 100 seed-weight (20.84%) and primary branches (18.74%). View evidence ↗
- Nine characters showed high heritability (>60%), with the highest values in harvest index (97.80%), 100 seed weight (97.60%), seed yield (97.30%), and pods per plant (97.30%). View evidence ↗
- High genetic advance as a percentage of mean was observed for seed yield per plant (76.24%), 100 seed-weight (42.43%), and harvest index (37.38%). View evidence ↗
- Seed yield per plant showed positive and statistically significant correlations with pods per plant, seeds per pod, primary and secondary branches, 100 seed weight, and harvest index. View evidence ↗
- Path analysis revealed that harvest index and 100 seed weight had the highest positive direct effects on seed yield per plant. View evidence ↗
- The 44 genotypes were categorized into seven distinct clusters, with Cluster II being the largest containing 15 genotypes. View evidence ↗
- The greatest inter-cluster distance was found between clusters V and VI (D = 19.80), followed by III and VI (D = 19.13) and I and VI (D = 15.48). View evidence ↗
- The number of pods per plant contributed most to genetic divergence among the studied characters. View evidence ↗
What it means
- The authors recommend incorporating genotypes such as Phule G 1521-12-2, PG 357, BG 4047, Phule Vikram, RG 2230, NDG 22-10, and NDG 22-6 into future breeding programs or multi-location trials. View evidence ↗
Visual summary
3 visualsIllustrations explain the paper; charts are replotted from the paper's own table values.
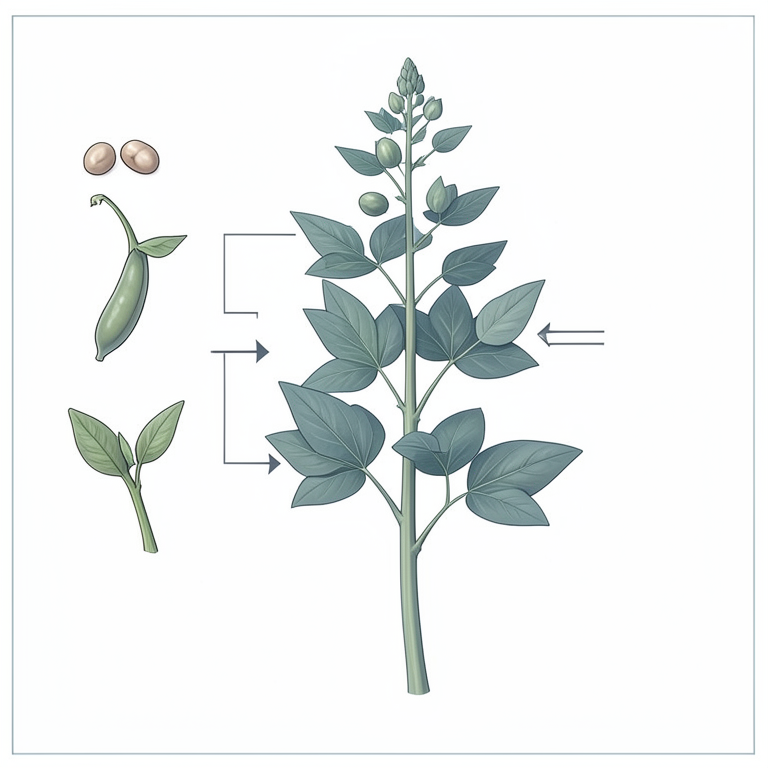
Yield Component Relationships
AI-generated conceptual illustration (chickpea plants (Cicer arietinum L.)). It explains the idea and does not show study data.
View source evidence ↗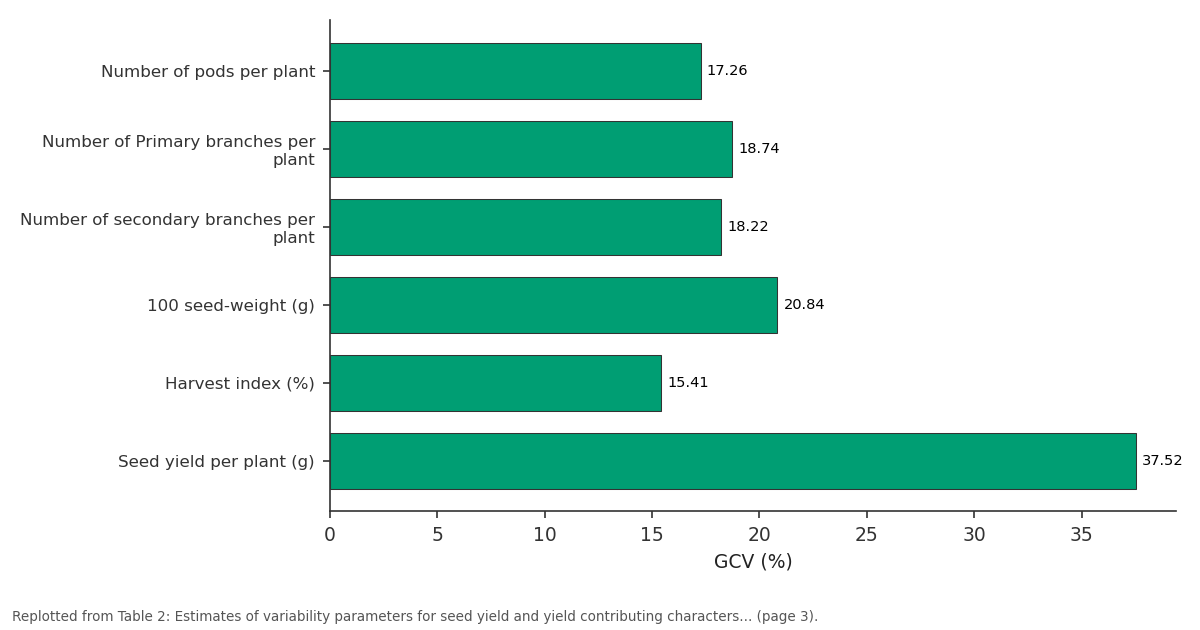
GCV (%): Number of pods per plant vs Number of Primary... vs Number of secondary... vs 100 seed-weight (g) vs Harvest index (%)
Replotted from Table 2 (page 3) of the original paper. Every bar is the paper's own table value.
View source evidence ↗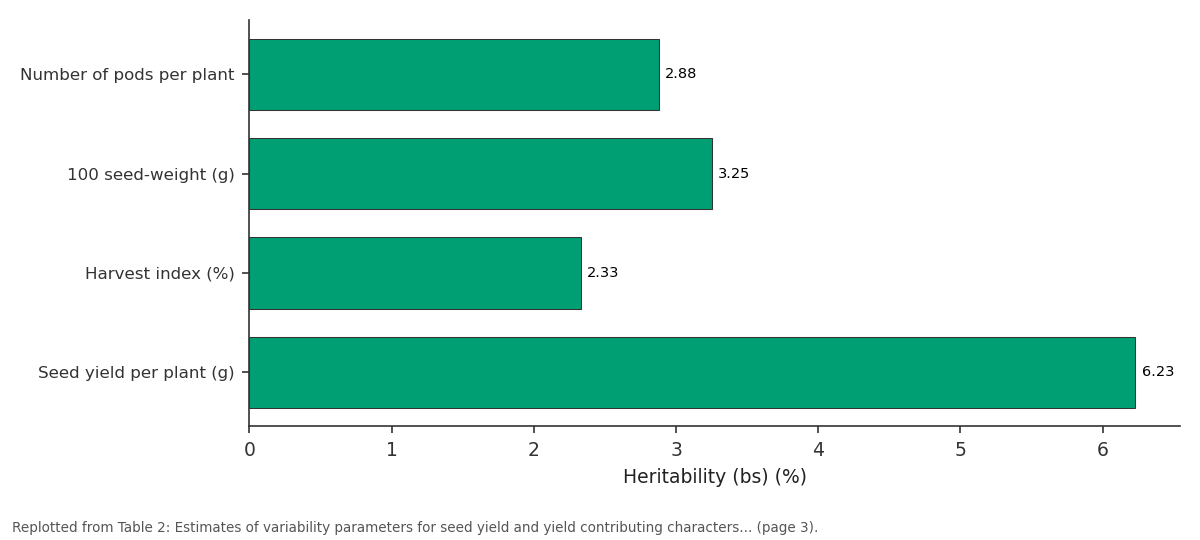
ECV (%): Number of pods per plant vs 100 seed-weight (g) vs Harvest index (%) vs Seed yield per plant (g)
Replotted from Table 2 (page 3) of the original paper. Every bar is the paper's own table value.
View source evidence ↗Figures & tables
From the original paper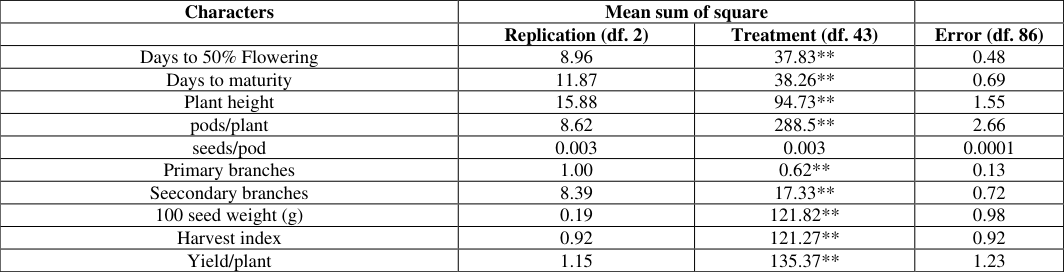 Table 1
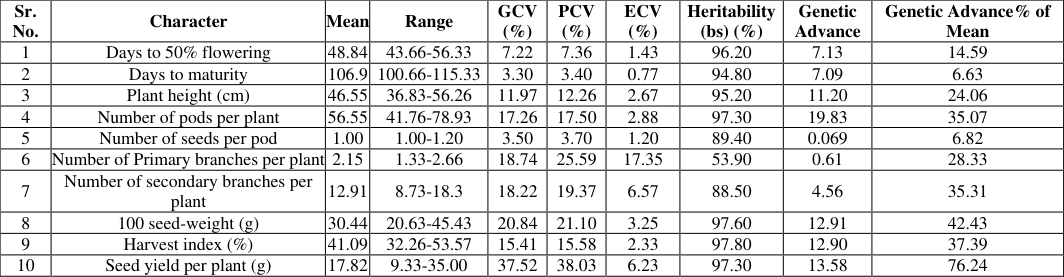 Table 2
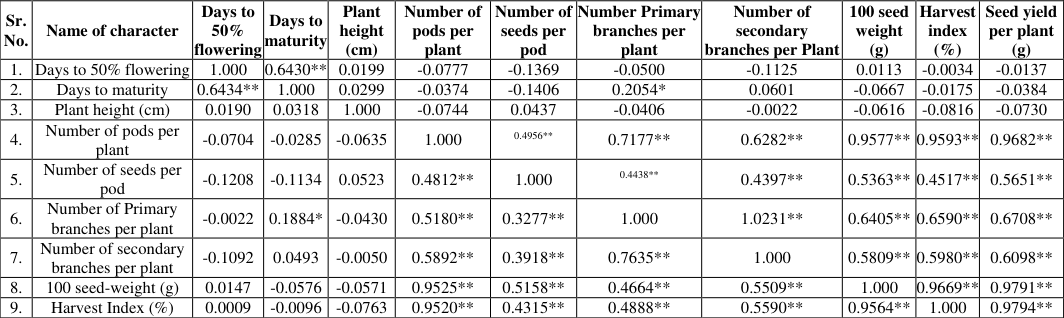 Table 3
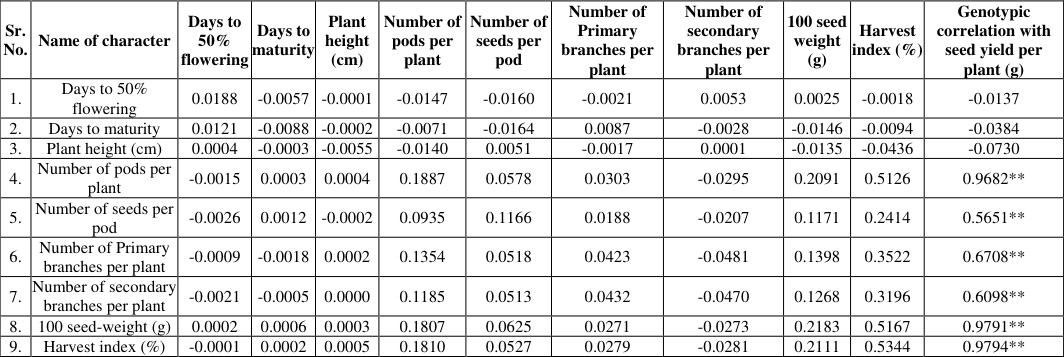 Table 4
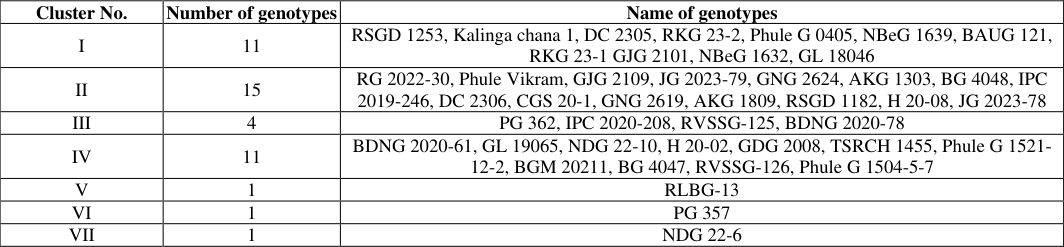 Table 5
 Table 6
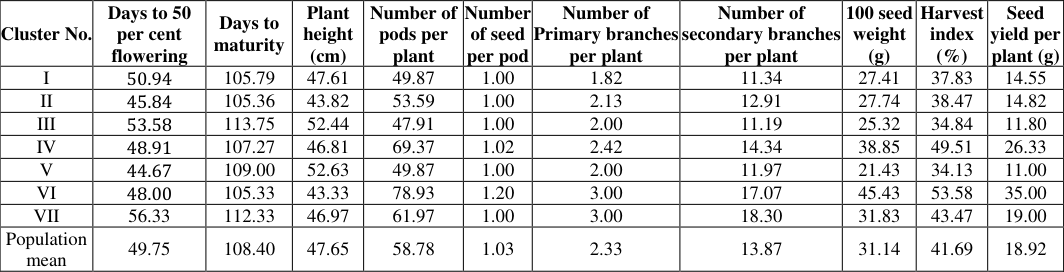 Table 7
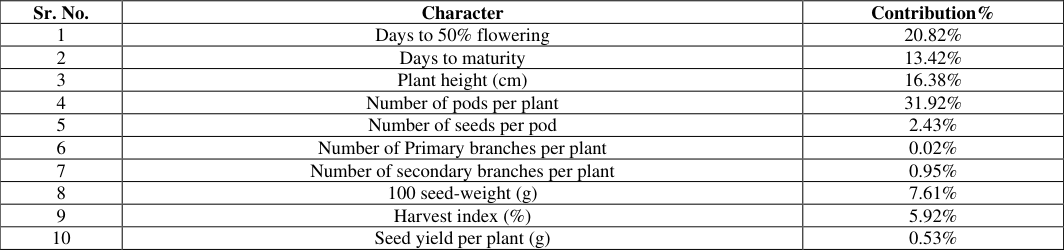 Table 8
Introduction
Chickpea (Cicer arietinum L.) is one of the oldest and most widely cultivated legumes in the world. Belonging to the Fabaceae (Leguminosae) family, it is a cool-season, self-pollinated, diploid (2n = 2x = 16) pulse crop primarily grown in tropical and subtropical climates. Commonly known as Gram, Bengal gram, Chana (in Hindi), and Harbhara (in Marathi), it plays a significant role in global food systems. Legumes, represent the third-largest family of angiosperms. They include a diverse range of food crops that are vital sources of plant-based proteins and essential amino acids. In addition to their nutritional value, legumes play a crucial role in sustainable agriculture by enhancing soil health through symbiotic nitrogen fixation and contributing high-quality organic matter to the soil. India is largest producer of chickpea in the world with 115.76 lakh tonnes from an acreage of 104.74 lakh hectares, with productivity of 12.6 quintals per hectare. according to ANGRAU, 2023-2024. Maharashtra's chickpea area was reported at 26.30 lakh hectares, while production reached 27 lakh tonnes and productivity was 702 kg per hectare. Chickpea is widely consumed across the world in various forms, with its culinary use often shaped by ethnic and regional traditions. On the Indian subcontinent, chickpeas are commonly split into cotyledons and consumed as 'dal' or ground into flour (besan), which is then used in a variety of snacks and dishes. Globally, especially in Asia and Africa, chickpeas are incorporated into soups, salads, and stews, and are also eaten in roasted, boiled, salted, or fermented forms. These diverse methods of consumption not only cater to cultural preferences but also provide substantial nutritional value and significant health benefits to consumers (Jukanti et al., 2012) [16] .
Genetic variability is a vital tool for plant breeders, serving as a fundamental source of variation and a key driver of yield improvement. The success of crop enhancement efforts relies heavily on identifying traits that contribute to yield, which in turn depends on the presence of heritable variation and the heritability of specific traits. To ensure reliable estimation of genetic parameters, a precise and environmentally stable approach to measuring genetic variability is required. The progress achieved in crop improvement through selection is directly influenced by the level of genetic variability available in the breeding material. However, environmental factors can also impact the expression of this variability. Therefore, it is imperative to collect, analyze, and document all available genetic diversity within chickpea genotypes to meet the increasing demand for varietal development and higher productivity. For any crop improvement program, a breeder must possess a thorough understanding of genetic variability and heritability. These factors are critical at various stages of the breeding process. Specifically, the degree of variability and heritability for economically important traits in earlygeneration populations will determine the overall success of the breeding program. Estimating heritability and expected genetic gain is crucial to accurately assess the potential of selecting superior individuals under specific conditions (Johnson et al., 1955) [12] .
2.Materials and Methods
The field experiments related to the present investigation entitled "Assessment of genetic variability in Chickpea (Cicer arietinum L.) was carried out during Rabi season, 2023-2024 at Pulse Improvement Project, MPKV, Rahuri. The materials used in the present investigation consisted of forty-four genotypes of chickpea. The material was obtained from the Pulse Improvement Project, MPKV, Rahuri. The experiment used a randomized block design with three replications with spacing 30cm x 10cm. All other intercultural operation like thinning, weeding, In order to facilitate better germination, a light irrigation after sowing, at time of pod formation.
Result and discussion
The mean data for ten characters were subjected to analysis of variance which showed that the mean sum of square for nine characters due to genotypes were found significant under study, which indicates that considerable amount of variability is present among genotypes. This significant heterogeneity offers a strong opportunity to enhance desirable features in chickpea breeding efforts. The similar findings for all the characters have been reported by Akhtar et al. (2011) [2] , Jivani et al. (2013) [14] , Jain et al. (2020) [13] , Manasa et al. (2020) [20] , Nikita and Lal (2022) [23] and Munazza moin (2023) [22] .
Genetic variability parameters
Parameters of genetic variability were recorded on ten quantitative traits viz., days to 50% flowering, days to maturity, plant height, number of primary branches per plant, number of secondary branches per plant, number of pods per plant, number of seeds per pod, 100-seed weight, harvest index, and seed yield per plant.
Genotypic and Phenotypic Coefficients of Variation
Estimates of genotypic coefficient of variation (GCV) and phenotypic coefficient of variation (PCV) were classified as suggested by Sivasubramanian and Madhavamenon (1973) and are presented in Table 4. Genotypic coefficient variation (GCV) was highest for seed yield per plant (g) (37.51%) followed by 100 seed-weight (20.84%) and number of primary branches (18.74%). The character days to maturity (3.30%) recorded lowest GCV. The maximum phenotypic coefficient of variation (PCV) was recorded for seed yield per plant (38.03%), followed by Number of Primary branches (25.54%). In general, the magnitude of phenotypic coefficient of variation was higher than the genotypic coefficient of variation. High magnitude of GCV and PCV was observed for seed yield per plant and 100 seed weight. This was in conformity with the results of Kuldeep et al. (2014) [17] , Singh et al. (2018) [28] , Jain et al. (2020) [13] and Devi et al. (2021) [7] , Nikita and Lal (2022) [23] Bharathi et al. (2022) [6] and Munazza moin (2023) [22] . While, low magnitude of GCV and PCV was observed for days to maturity, which was in conformity with Akhtar et al. (2011) [2] , Kuldeep et al. (2014) [17] and Manasa et al. (2020) [20] .
| Sr. No. | Name of character | Days to 50% flowering | Days to maturity | Plant height (cm) | Number of pods per plant | Number of seeds per pod | Number of Primary branches per plant | Number of secondary branches per plant | 100 seed weight (g) | Harvest index (%) | Genotypic correlation with seed yield per plant (g) |
|---|---|---|---|---|---|---|---|---|---|---|---|
| 1. | Days to 50% flowering | 0.0188 | -0.0057 | -0.0001 | -0.0147 | -0.0160 | -0.0021 | 0.0053 | 0.0025 | -0.0018 | -0.0137 |
| 2. | Days to maturity | 0.0121 | -0.0088 | -0.0002 | -0.0071 | -0.0164 | 0.0087 | -0.0028 | -0.0146 | -0.0094 | -0.0384 |
| 3. | Plant height (cm) | 0.0004 | -0.0003 | -0.0055 | -0.0140 | 0.0051 | -0.0017 | 0.0001 | -0.0135 | -0.0436 | -0.0730 |
| 4. | Number of pods per plant | -0.0015 | 0.0003 | 0.0004 | 0.1887 | 0.0578 | 0.0303 | -0.0295 | 0.2091 | 0.5126 | 0.9682** |
| 5. | Number of seeds per pod | -0.0026 | 0.0012 | -0.0002 | 0.0935 | 0.1166 | 0.0188 | -0.0207 | 0.1171 | 0.2414 | 0.5651** |
| 6. | Number of Primary branches per plant | -0.0009 | -0.0018 | 0.0002 | 0.1354 | 0.0518 | 0.0423 | -0.0481 | 0.1398 | 0.3522 | 0.6708** |
| 7. | Number of secondary branches per plant | -0.0021 | -0.0005 | 0.0000 | 0.1185 | 0.0513 | 0.0432 | -0.0470 | 0.1268 | 0.3196 | 0.6098** |
| 8. | 100 seed-weight (g) | 0.0002 | 0.0006 | 0.0003 | 0.1807 | 0.0625 | 0.0271 | -0.0273 | 0.2183 | 0.5167 | 0.9791** |
| 9. | Harvest index (%) | -0.0001 | 0.0002 | 0.0005 | 0.1810 | 0.0527 | 0.0279 | -0.0281 | 0.2111 | 0.5344 | 0.9794** |
Table text extracted from the original PDF; superscript letters are shown inline. The original table image is below.
View original table image
Heritability
Heritability in broad sense was estimated for various characters as suggested by Hanson et al. (1956) [11] . Estimates of heritability in broad sense are presented in Table 5. High estimates of heritability (>60%) was observed for nine studied characters. The highest estimates of heritability exhibited in days to Harvest index (97.80%) followed by 100 seed weight (97.60%), Seed yield (97.30%), Number of pods per plants (97.30%), days to 50% flowering (96.20%),Plant height (95.20%), days to maturity (94.80%) number of seeds per pod (89.40%) and number of secondary branches (88.50%) and number of primary branches (53.90%) showed moderate heritability range (30-60%).In the current study, traits such as Harvest index, 100 seed weight, Seed yield per plant, number of pods per plant, Plant height, number of secondary branches per plant all exhibited a high estimates of heritability (broad sense), along with high genetic advance as a percentage of mean, indicating that these traits are largely governed by additive gene action and that selection of these traits could be more effective for the desired genetic improvement. These findings supported by similar noting of Jivani et al. (2013) [14] , Sharanappa et al. (2014) [27] , Banik et al. (2018) [4] , Kumar et al. (2019) [18] , Manasa et al. (2020) [20] and Devi et al. (2021) [7] , Munazza moin et al. (2023) [22] .
| Cluster No. | Number of genotypes | Name of genotypes |
|---|---|---|
| I | 11 | RSGD 1253, Kalinga chana 1, DC 2305, RKG 23-2, Phule G 0405, NBeG 1639, BAUG 121, RKG 23-1 GJG 2101, NBeG 1632, GL 18046 |
| II | 15 | RG 2022-30, Phule Vikram, GJG 2109, JG 2023-79, GNG 2624, AKG 1303, BG 4048, IPC 2019-246, DC 2306, CGS 20-1, GNG 2619, AKG 1809, RSGD 1182, H 20-08, JG 2023-78 |
| III | 4 | PG 362, IPC 2020-208, RVSSG-125, BDNG 2020-78 |
| IV | 11 | BDNG 2020-61, GL 19065, NDG 22-10, H 20-02, GDG 2008, TSRCH 1455, Phule G 1521- 12-2, BGM 20211, BG 4047, RVSSG-126, Phule G 1504-5-7 |
| V | 1 | RLBG-13 |
| VI | 1 | PG 357 |
| VII | 1 | NDG 22-6 |
Table text extracted from the original PDF; superscript letters are shown inline. The original table image is below.
View original table image
Genetic advance
Genetic advance (at 5% selection intensity) was calculated by the formula cited by Allard (1960) [1] . The range of genetic advance observed from 0.06 to 19.83. The highest estimate of GA for number of pods per plant (19.83) followed by seed yield per plant (13.58), 100 seed weight (12.91), harvest index (12.90), plant height (11.20) and days 50% flowering (7.13). The range of genetic advance as per cent of mean is classified as suggested by Johansson, et al. (1955) [12] . High estimates of genetic advance as per cent of mean observed for seed yield per plant (76.24%), followed by 100 seed-weight (42.43%), harvest index (37.38%) While, days to maturity (6.63%%) showed the lowest performance in genetic advance as per cent of mean. The data collected on individual characters were subjected to the method of analysis of variance commonly applicable to the Randomized Block Design.
Correlation coefficient analysis
To establish a cause and effect relationship, the first step used was to partition genotypic and phenotypic correlation coefficient into direct and indirect effects by path analysis as suggested by Dewey and Lu (1959) [8] and developed by Wright (1921). The degree of association between yield and its components was shown by the examination of the correlation coefficient given the interdependence of the yield components. Both phenotypic and genotypic levels of the correlation between various features and seed yield were evaluated, and the study revealed that genotypic correlation coefficient values were higher than phenotypic values. This showed how much the environment affects the phenotypic correlation coefficient. The seed yield per plant and its correlation with the number of pods per plant, number of seeds per pod, number of primary branches, number of secondary branches, 100 seed weight and harvest index were all positive and statistically significant. The seed yield per plant and its correlation with the number of pods per plant, number of seeds per pod, number of primary branches, number of secondary branches, 100 seed weight and harvest index were all positive and statistically significant. Similar results also reported by Kuldeep et al. (2014) [17] , Banik et al. (2017) [5] , Nitesh et al. (2018) [24] , Kumar et al. (2019) [18] , Makarand et al. (2019) [19] and Nikita and Lal (2022) [23] , Gulwane et al. (2022) [10] and Reddy et al. (2023) [25] .
Path coefficient analysis
The correlation coefficient demonstrated the association between the two characters, but a dependent trait is an interaction of many component traits that are mutually associated, and a change in any one of them will disrupt the entire network of cause and effect system. Wright (1921) developed the path analysis, a statistical tool that takes into account the cause-and-effect relationships between variables. The results of path coefficient based on genotypic coefficient taking seed yield per plant as dependent variable indicated that the characters days to 50% flowering, number of pods per plant, number of seeds per pod, number of primary branches, 100 seed weight and harvest index exhibited positive direct effect on grain yield per plant while traits like days to maturity and plant height showed negative direct effect on seed yield per plant. The number of secondary branches per plant had effect on seed yield through the number of pods per plant, number of seeds per pod, number of primary branches, 100 seed weight and harvest index and indicating the indirect selection of such characters would be successful in increasing yield. Highest direct effect on seed yield per plant showed by harvest index followed by 100 seed weight with positive correlation coefficient so that the direct selection of this trait for seed yield per plant is useful. Highest positive indirect effect was showed by number of secondary branches per plant via number of pods per plant. The component of residual effects of path analysis was 0.1190. Low residual effect indicated that characters for path analysis were adequate and appropriate. Highest direct effect on seed yield per plant showed by harvest index followed by 100 seed weight with positive correlation coefficient so that the direct selection of this trait for seed yield per plant is useful. These findings are in consonance to the results obtained by Kuldeep et al.
(2014) [17] , Shafique et al. (2016) [26] , Banik et al. (2017) [5] , Gulawane et al. (2022) [10] and Nikita and Lal (2022) [23] .
Genetic divergence
Rao (1952) recommended adopting D 2 statistics in plant breeding to examine genetic diversity. Improvement of seed yield or any other traits is normally attained through involvement of genetically diverse parents in breeding programme. For identifying such parents for crossing, multivariate analysis by means of Mahalanobis' D 2 statistics has been used in several crops. It is powerful tool used to quantify the degree of genetic diversity between the genotypes and to relate clustering pattern with the geographic region. [21] . Therefore, while selecting the parents by considering the genetic diversity and per se performance and cluster mean for the characters also need due consideration in the crop improvement programme. In the present investigation Forty four genotypes were grouped into seven clusters. Table 6 showed the highest inter cluster distance (D = 19.80) was found between the clusters V and VI, followed by the cluster III and VI (D = 19.13) and cluster I and VI (D =15.48). This indicated that hybridization among the genotypes between these clusters would produce successful hybrids and desirable segregants in further generations. The intra cluster value was highest in cluster IV had maximum intra cluster distance (D= 9.35) followed by cluster II (D = 6.98), indicating that this cluster is more heterogeneous. Singh et al. (2020) [28] studied 20 genotypes into five
| Cluster | I | II | III | IV | V | VI | VII |
|---|---|---|---|---|---|---|---|
| I | 6.56 (43.03) | 9.26 (85.74) | 8.86 (78.49) | 11.66 (135.95) | 12.29 (151.04) | 15.48 (239.63) | 9.41 (88.54) |
| II | 6.98 (48.72) | 10.75 (115.56) | 11.26 (126.78) | 9.05 (81.90) | 14.90 (222.01) | 11.36 (129.04) | |
| III | 4.52 (20.43) | 14.15 (200.22) | 9.68 (9.68) | 19.13 (365.95) | 9.40 (88.36) | ||
| IV | 9.35 (87.42) | 15.22 (231.64) | 11.97 (143.28) | 11.40 (129.96) | |||
| V | 0.00 (0) | 19.80 (392.04) | 13.81 (190.71) | ||||
| VI | 0.00 (0) | 15.53 (241.18) | |||||
| VII | 0.00 (0) |
Table text extracted from the original PDF; superscript letters are shown inline. The original table image is below.
View original table image
Conclusions
1. Analysis of variance revealed highly significant differences among genotypes for all the traits indicating that that is ample amount of variability. 2. The phenotypic coefficient of variation (PCV) was slightly higher than the corresponding genotypic coefficient of variation (GCV) for all the characters. High GCV and high PCV were observed for Seed yield per plant, 100 seed weight. This indicates that these characters provide good source of variation and hence are useful in crop improvement programme in chickpea. 3. High heritability coupled with high genetic advance as per cent mean observed for number of Plant height, number of pods per plant, number of secondary branches, 100 seed weight, harvest index and seed yield per plant which indicates that these traits were predominantly governed by additive gene action and selection of these traits would be more effective for desired genetic improvement. 4. Seed yield per plant had significant and positive relationship with number of pods per plants, number of seeds per pod, number of primary branches, number of secondary branches, 100 seed weight, harvest index.
5. The highest direct positive effect on seed yield per plant was showed by Harvest index, 100 seed weight, number of pods per plant, number of seeds per pod. Hence selection based on these characters can help in improvement of seed yield in chickpea. 6. The 44 genotypes studied were grouped in seven diverse clusters. The maximum intra cluster distance was registered between cluster IV whereas maximum inter cluster showed by cluster V and cluster VI. 7. Among the 10 characters studied, the Number of pods per plant showed maximum contribution towards divergence followed by days to 50% flowering, plant height, days to maturity, 100 seed weight, harvest index, number of seeds per pod.
Figures and tables from the paper
| Characters | Mean sum of square | — | — |
|---|---|---|---|
| Replication (df. 2) | Treatment (df. 43) | Error (df. 86) | |
| Days to 50% Flowering | 8.96 | 37.83** | 0.48 |
| Days to maturity | 11.87 | 38.26** | 0.69 |
| Plant height | 15.88 | 94.73** | 1.55 |
| pods/plant | 8.62 | 288.5** | 2.66 |
| seeds/pod | 0.003 | 0.003 | 0.0001 |
| Primary branches | 1.00 | 0.62** | 0.13 |
| Seecondary branches | 8.39 | 17.33** | 0.72 |
| 100 seed weight (g) | 0.19 | 121.82** | 0.98 |
| Harvest index | 0.92 | 121.27** | 0.92 |
| Yield/plant | 1.15 | 135.37** | 1.23 |
Table text extracted from the original PDF; superscript letters are shown inline. The original table image is below.
View original table image
| Sr. No. | Character | Mean | Range | GCV (%) | PCV (%) | ECV (%) | Heritability (bs) (%) | Genetic Advance | Genetic Advance% of Mean |
|---|---|---|---|---|---|---|---|---|---|
| 1 | Days to 50% flowering | 48.84 | 43.66-56.33 | 7.22 | 7.36 | 1.43 | 96.20 | 7.13 | 14.59 |
| 2 | Days to maturity | 106.9 | 100.66-115.33 | 3.30 | 3.40 | 0.77 | 94.80 | 7.09 | 6.63 |
| 3 | Plant height (cm) | 46.55 | 36.83-56.26 | 11.97 | 12.26 | 2.67 | 95.20 | 11.20 | 24.06 |
| 4 | Number of pods per plant | 56.55 | 41.76-78.93 | 17.26 | 17.50 | 2.88 | 97.30 | 19.83 | 35.07 |
| 5 | Number of seeds per pod | 1.00 | 1.00-1.20 | 3.50 | 3.70 | 1.20 | 89.40 | 0.069 | 6.82 |
| 6 | Number of Primary branches per plant | 2.15 | 1.33-2.66 | 18.74 | 25.59 | 17.35 | 53.90 | 0.61 | 28.33 |
| 7 | Number of secondary branches per plant | 12.91 | 8.73-18.3 | 18.22 | 19.37 | 6.57 | 88.50 | 4.56 | 35.31 |
| 8 | 100 seed-weight (g) | 30.44 | 20.63-45.43 | 20.84 | 21.10 | 3.25 | 97.60 | 12.91 | 42.43 |
| 9 | Harvest index (%) | 41.09 | 32.26-53.57 | 15.41 | 15.58 | 2.33 | 97.80 | 12.90 | 37.39 |
| 10 | Seed yield per plant (g) | 17.82 | 9.33-35.00 | 37.52 | 38.03 | 6.23 | 97.30 | 13.58 | 76.24 |
Table text extracted from the original PDF; superscript letters are shown inline. The original table image is below.
View original table image
| Sr. No. | Name of character | Days to 50% flowering | Days to maturity | Plant height (cm) | Number of pods per plant | Number of seeds per pod | Number Primary branches per plant | Number of secondary branches per Plant | 100 seed weight (g) | Harvest index (%) | Seed yield per plant (g) |
|---|---|---|---|---|---|---|---|---|---|---|---|
| 1. | Days to 50% flowering | 1.000 | 0.6430** | 0.0199 | -0.0777 | -0.1369 | -0.0500 | -0.1125 | 0.0113 | -0.0034 | -0.0137 |
| 2. | Days to maturity | 0.6434** | 1.000 | 0.0299 | -0.0374 | -0.1406 | 0.2054* | 0.0601 | -0.0667 | -0.0175 | -0.0384 |
| 3. | Plant height (cm) | 0.0190 | 0.0318 | 1.000 | -0.0744 | 0.0437 | -0.0406 | -0.0022 | -0.0616 | -0.0816 | -0.0730 |
| 4. | Number of pods per plant | -0.0704 | -0.0285 | -0.0635 | 1.000 | 0.4956** | 0.7177** | 0.6282** | 0.9577** | 0.9593** | 0.9682** |
| 5. | Number of seeds per pod | -0.1208 | -0.1134 | 0.0523 | 0.4812** | 1.000 | 0.4438** | 0.4397** | 0.5363** | 0.4517** | 0.5651** |
| 6. | Number of Primary branches per plant | -0.0022 | 0.1884* | -0.0430 | 0.5180** | 0.3277** | 1.000 | 1.0231** | 0.6405** | 0.6590** | 0.6708** |
| 7. | Number of secondary branches per plant | -0.1092 | 0.0493 | -0.0050 | 0.5892** | 0.3918** | 0.7635** | 1.000 | 0.5809** | 0.5980** | 0.6098** |
| 8. | 100 seed-weight (g) | 0.0147 | -0.0576 | -0.0571 | 0.9525** | 0.5158** | 0.4664** | 0.5509** | 1.000 | 0.9669** | 0.9791** |
| 9. | Harvest Index (%) | 0.0009 | -0.0096 | -0.0763 | 0.9520** | 0.4315** | 0.4888** | 0.5590** | 0.9564** | 1.000 | 0.9794** |
Table text extracted from the original PDF; superscript letters are shown inline. The original table image is below.
View original table image
| Cluster No. | Days to 50 per cent flowering | Days to maturity | Plant height (cm) | Number of pods per plant | Number of seed per pod | Number of Primary branches per plant | Number of secondary branches per plant | 100 seed weight (g) | Harvest index (%) | Seed yield per plant (g) |
|---|---|---|---|---|---|---|---|---|---|---|
| I | 50.94 | 105.79 | 47.61 | 49.87 | 1.00 | 1.82 | 11.34 | 27.41 | 37.83 | 14.55 |
| II | 45.84 | 105.36 | 43.82 | 53.59 | 1.00 | 2.13 | 12.91 | 27.74 | 38.47 | 14.82 |
| III | 53.58 | 113.75 | 52.44 | 47.91 | 1.00 | 2.00 | 11.19 | 25.32 | 34.84 | 11.80 |
| IV | 48.91 | 107.27 | 46.81 | 69.37 | 1.02 | 2.42 | 14.34 | 38.85 | 49.51 | 26.33 |
| V | 44.67 | 109.00 | 52.63 | 49.87 | 1.00 | 2.00 | 11.97 | 21.43 | 34.13 | 11.00 |
| VI | 48.00 | 105.33 | 43.33 | 78.93 | 1.20 | 3.00 | 17.07 | 45.43 | 53.58 | 35.00 |
| VII | 56.33 | 112.33 | 46.97 | 61.97 | 1.00 | 3.00 | 18.30 | 31.83 | 43.47 | 19.00 |
| Population mean | 49.75 | 108.40 | 47.65 | 58.78 | 1.03 | 2.33 | 13.87 | 31.14 | 41.69 | 18.92 |
Table text extracted from the original PDF; superscript letters are shown inline. The original table image is below.
View original table image
| Sr. No. | Character | Contribution% |
|---|---|---|
| 1 | Days to 50% flowering | 20.82% |
| 2 | Days to maturity | 13.42% |
| 3 | Plant height (cm) | 16.38% |
| 4 | Number of pods per plant | 31.92% |
| 5 | Number of seeds per pod | 2.43% |
| 6 | Number of Primary branches per plant | 0.02% |
| 7 | Number of secondary branches per plant | 0.95% |
| 8 | 100 seed-weight (g) | 7.61% |
| 9 | Harvest index (%) | 5.92% |
| 10 | Seed yield per plant (g) | 0.53% |
Table text extracted from the original PDF; superscript letters are shown inline. The original table image is below.
View original table image
References
28 in the original paper- Allard RW. Principles of plant breeding. New York: John Wiley and Sons, Inc.; 1960. p.20-4, 88-9.
- Akhtar LH, Muhammad A, Muhammad N. Genetic divergence and inter-relationship studies in chickpea (Cicer arietinum L.). Pak J Agric Sci. 2011;48(1):3539.
- ANGRAU. Crop Outlook Reports of Andhra Pradesh: Bengal gram. June 2023-May 2024.
- Banik M, Deore G, Mandal A, Mhase L. Genetic variability and heritability studies in chickpea (Cicer arietinum L.). Curr J Appl Sci Technol. 2018;31(1):1-6.
- Banik M, Deore G, Mandal A, Shah P. Selection of yield contributing traits in chickpea genotypes by correlation and path analysis studies. Pharma Innov. 2017;6(11):402-5.
- Bharathi C, Lavanya GR, Viswanatha Reddy Y. Genetic variability and association analysis in chickpea (Cicer arietinum L.) for seed yield characters. Int J Plant Soil Sci. 2022;34:27-36.
- Devi SR, Imran MM, Jayalakshmi V. Genetic variability and character association studies in desi and kabuli chickpea (Cicer arietinum L.). Food Legumes. 2021;34(4):254-9.
- Dewey DR, Lu KH. A correlation and path coefficient analysis. Agric Stat Glance. 1959; p.62-3.
- Falconer DS. Introduction to quantitative genetics. 2nd ed. London: Longman Group Ltd.; 1981.
- Gulwane VP, Deore DS, Thakare DS. Correlation and path analysis studies in chickpea (Cicer arietinum L.). Pharma Innov. 2022;11(12):1251-5.
- Hanson CH, Robinson HF, Comstock RE. Biometrical studies of yield in segregating populations of Korean lespedeza. Agron J. 1956;48(6):268-72.
- Johnson HW, Robinson HF, Comstock RE. Genotypic and phenotypic correlations in soybeans and their implications in selection. Agron J. 1955;47(10):477-83.
- Jain SK, Sharma LD, Gupta KC, Kumar V. Association among yield and yield contributing characters in chickpea (Cicer arietinum L.). Food Legumes. 2020; p.164.
- Jivani JV, Mehta DR, Pithia MS, Madariya RB, Mandavia CK. Variability analysis and multivariate analysis in chickpea (Cicer arietinum L.). Electron J Plant Breed. 2013;4(4):1284-91.
- Jivani JV, Mehta DR, Vaddoria MA, Raval L. Correlation and path coefficient analysis in chickpea (Cicer arietinum L.). Electron J Plant Breed. 2013;4(2):1167-70.
- Jukanti AK, Gaur PM, Gowda CLL, Chibbar RN. Nutritional quality and health benefits of chickpea (Cicer arietinum L.): a review. Br J Nutr. 2012;108(S1):S11-26.
- Kuldeep RK, Pandey S, Babbar A, Mishra DK. Genetic variability, character association and path coefficient analysis in chickpea grown under heat stress condition. Electron J Plant Breed. 2014;5(4):812-819.
- Kumar S, Suresh B, Kumar A, Lavanya G. Genetic variability, correlation and path coefficient analysis in chickpea (Cicer arietinum L.) for yield and its component traits. Int J Curr Microbiol Appl Sci. 2019;8(12):2341-52.
- Makarand B, Lal GM, Sai IKM. Estimation of correlation and path analysis for quantitative traits in chickpea (Cicer arietinum L.). Int J Curr Microbiol Appl Sci. 2019;8(12):1602-8.
- Manasa B, Priya MS, Jayalakshmi V, Umamaheswari P. Genetic variability studies in extra-large and large seeded kabuli chickpea (Cicer arietinum L.). Electron J Plant Breed. 2020;11(2):707-12.
- Moll R, Lindsey MF, Robinson HF. Estimates of genetic variances and level of dominance in maize. Genetics. 1964;49(3):411-23.
- Munazza M, Jagan Mohan Rao, Parimala KC, Anuradha C. Correlation and path analysis of agromorphological traits in chickpea. Int J Environ Clim Change. 2023;13(11):1400-8.
- Nikita G, Lal GM. Genetic variability, correlation and path coefficient analysis for yield and its components traits in chickpea (Cicer arietinum L.). Res J Sci Technol. 2022;14(1):59-65.
- Nitesh SD, Talwade AC, Katna G. Correlation and path analysis studies in chickpea (Cicer arietinum L.) for seed yield and its attributes in the Himalayan region. J Food Legumes. 2018;31(4):258-60.
- Reddy RVC, Khan R, Singh A, Chaturvedi SK. Correlation, path analysis and genetic divergence of various agro-morphological traits and traits suitable for mechanical harvesting of chickpea (Cicer arietinum L.). Int J Environ Clim Change. 2023;13(9):894-9.
- Shafique MS, Muhammad A, Zafar M, Muhammad A, Awais S, Ahmad MI. Genetic variability and interrelationship of various agronomic traits using correlation and path analysis in chickpea (Cicer arietinum L.). Acad J Agric Res. 2016;4(2):82-5.
- Sharanappa SD, Kumar J, Meena HP, Bharadwaj C, Jagadeesh HM, Raghvendra KP, Singode A. Studies on heritability and genetic advance in chickpea (Cicer arietinum L.). J Food Legumes. 2014;27(1):71-3.
- Singh V, Singh P, Kumar A, Nath S. Estimation of genetic variability parameters in chickpea (Cicer arietinum L.) germplasm. J Pharmacogn Phytochem. 2018;7(2):1204-1206.