
Research article · 2025 · Full text
International Journal of Agriculture and Food ScienceGenetic variability and trait association studies in Indian mustard (Brassica juncea L. Czern & Coss)
Volume 7(8) · Pages 1355–1361 · DOI: 10.33545/2664844x.2025.v7.i8m.713 ↗
Research areasNitrogen and Sulfur Effects on BrassicaAgricultural Science and FertilizationGenomics, phytochemicals, and oxidative stress
Abstract
Author-writtenIndian mustard (Brassica juncea L. Czern & Coss) is a crucial oilseed crop in India, contributing 13-15% of total edible oil production. Despite its importance, productivity remains below global averages, necessitating genetic improvement through breeding programs. To assess genetic variability, heritability, genetic advance, and trait associations among 24 Indian mustard genotypes to identify superior genotypes and key selection criteria for yield improvement. Twenty four mustard genotypes were evaluated in a Randomized Block Design with three replications during Rabi 2024-2025 at Sam Higginbottom University, Prayagraj. Eleven quantitative traits were recorded including days to 50% flowering, plant height, number of primary branches per plant, number of siliquae per plant, days to maturity, siliqua length, number of seeds per siliqua, seed index, biological yield per plant, harvest index, and seed yield per plant. Genetic parameters, correlation coefficients, and path analysis were computed. Analysis of variance revealed significant genotypic differences for most traits. High heritability was observed for number of siliquae per plant (80.01%), biological yield per plant (58.23%), and seed yield per plant (58.08%). Genetic advance as percentage of mean was highest for number of siliquae per plant (26.28%), followed by seed yield per plant (15.16%). Strong positive correlations were found between seed yield and biological yield (r = 0.94), and harvest index (r = 0.75). Path analysis identified biological yield per plant (0.745) and harvest index (0.371) as having the highest direct effects on seed yield. CS-60 recorded the highest seed yield (10.09 g) and biological yield (27.44 g), while Brijraj showed the highest harvest index (39.93%). Biological yield per plant and harvest index are the primary determinants of seed yield in mustard. Genotypes CS-60 and Brijraj are promising for breeding programs. High heritability estimates for key traits indicate good scope for genetic improvement through selection.
Summary
Source-checkedPlain-language reading of the full paper, prepared with AI and checked against the text. Each point links to the authors' own words.
Why it matters
- Indian mustard is a vital oilseed crop in India, providing between 13% and 15% of the country's total edible oil production. View evidence ↗
- Because Indian mustard productivity is lower than global averages, there is a need for genetic improvement via breeding programs. View evidence ↗
- The need for domestic production is high because India imports more than 50% of the edible oil it consumes. View evidence ↗
The question
- The study aimed to evaluate genetic variability, estimate genetic parameters, and analyze trait associations among 24 different Indian mustard genotypes. View evidence ↗
What they did
- The research was conducted during the 2024-2025 rabi season at the Crop Research Farm of Sam Higginbottom University in Prayagraj, Uttar Pradesh. View evidence ↗
- The experimental design used was a Randomized Block Design (RBD) featuring three replications. View evidence ↗
- Researchers measured eleven quantitative traits, including plant height, days to flowering and maturity, siliquae count and length, seed index, biological yield, harvest index, and seed yield per plant. View evidence ↗
What they found
- Analysis of variance showed that there were significant differences among the 24 genotypes for most of the measured traits. View evidence ↗
- High broad-sense heritability was found for the number of siliquae per plant (80.01%), biological yield per plant (58.23%), and seed yield per plant (58.08%). View evidence ↗
- The highest genetic advance as a percentage of the mean was observed for the number of siliquae per plant (26.28%), followed by seed yield per plant (15.16%) and primary branches per plant (15.05%). View evidence ↗
- Phenotypic correlation analysis showed that seed yield per plant was highly positively correlated with biological yield per plant (0.878) and harvest index (0.673). View evidence ↗
- Genotypic path analysis identified biological yield per plant (0.745) and harvest index (0.371) as the traits with the highest positive direct effects on seed yield. View evidence ↗
- Genotype CS-60 was the top performer, achieving the highest seed yield (10.09 g), biological yield (27.44 g), and seed index (4.88 g). View evidence ↗
- Genotype Brijraj exhibited the highest harvest index at 39.93% and a seed yield of 8.76 g. View evidence ↗
What it means
- The authors recommend using the identified superior genotypes as parents for hybridization or releasing them as varieties following multi-location tests. View evidence ↗
Visual summary
3 visualsIllustrations explain the paper; charts are replotted from the paper's own table values.
Direct Effects on Seed Yield
AI-generated conceptual illustration (Indian mustard (Brassica juncea) plants). It explains the idea and does not show study data.
View source evidence ↗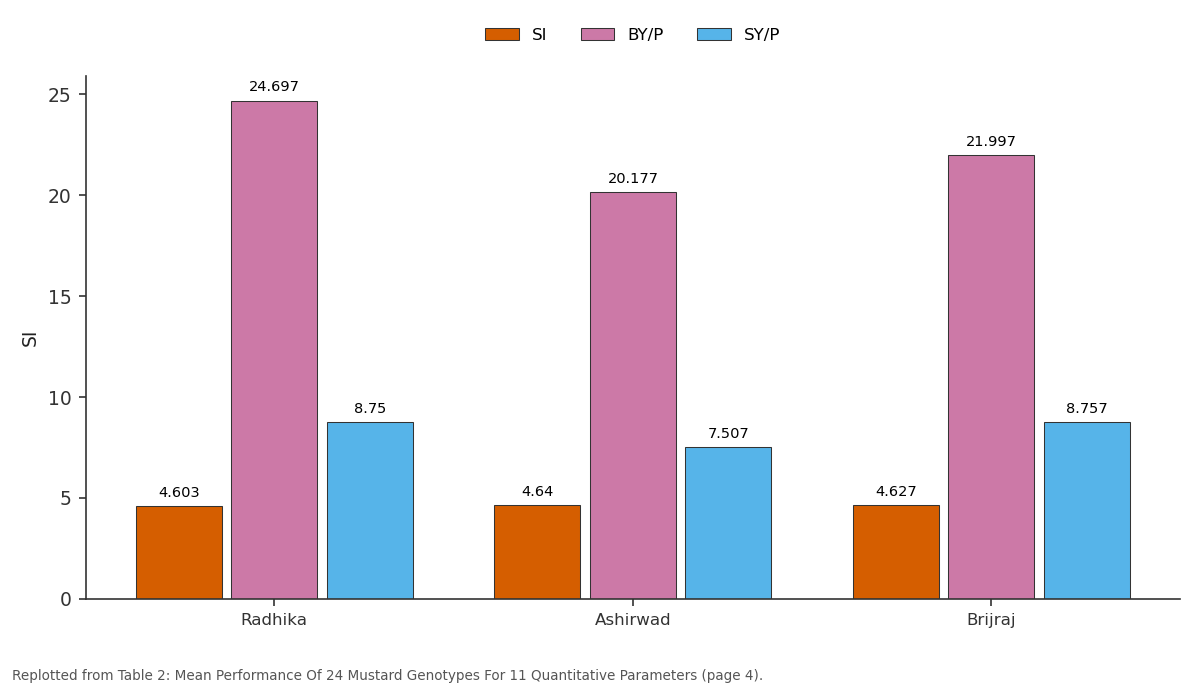
SI and BY/P and more: Radhika vs Ashirwad vs Brijraj
Replotted from Table 2 (page 4) of the original paper. Every bar is the paper's own table value.
View source evidence ↗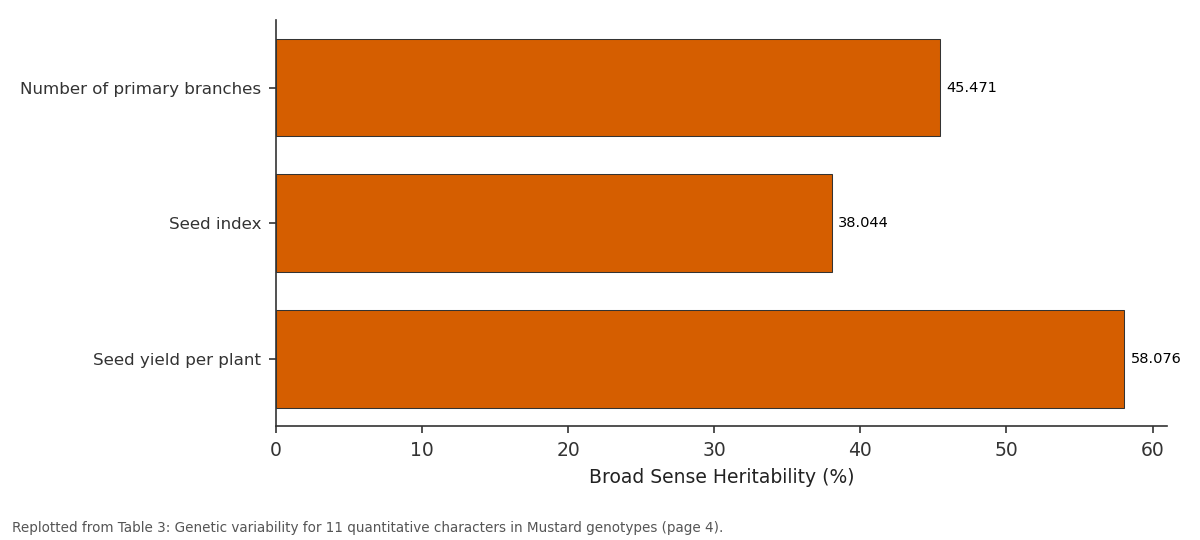
Heritability Broad Sense (%): Number of primary... vs Seed index vs Seed yield per plant
Replotted from Table 3 (page 4) of the original paper. Every bar is the paper's own table value.
View source evidence ↗Figures & tables
From the original paper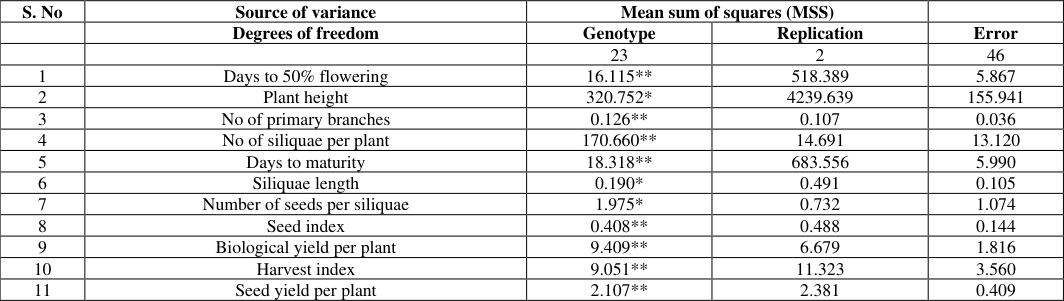 Table 1
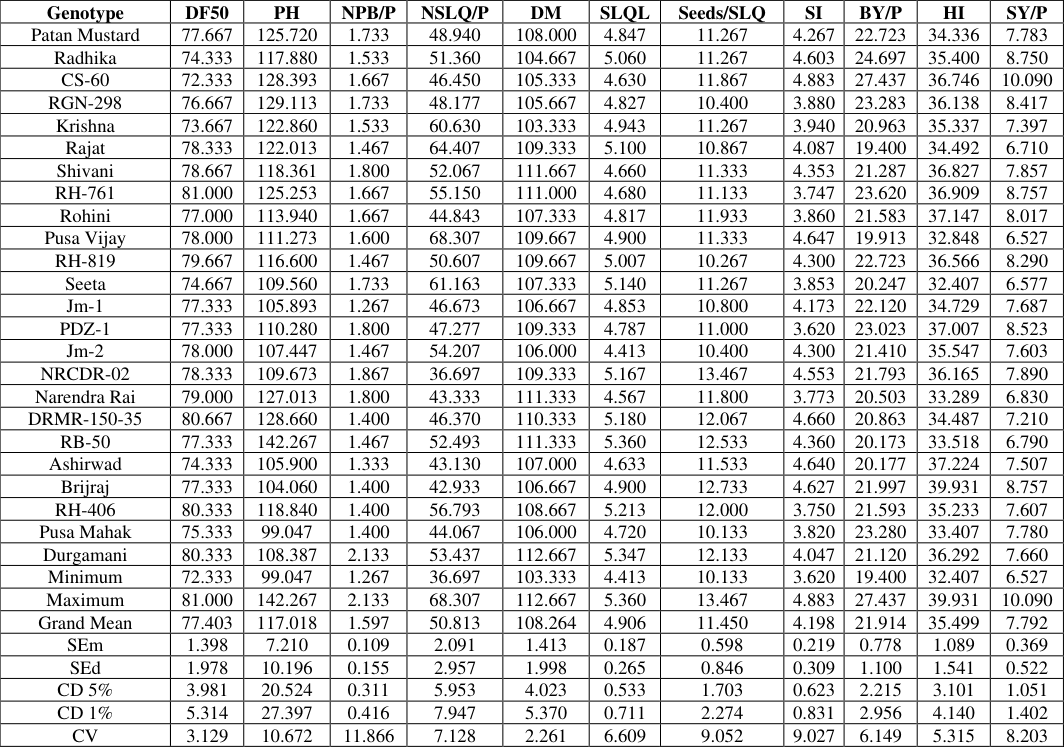 Table 2
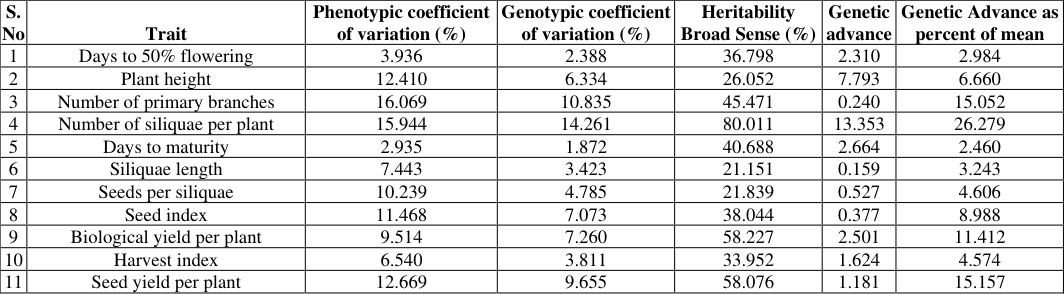 Table 3
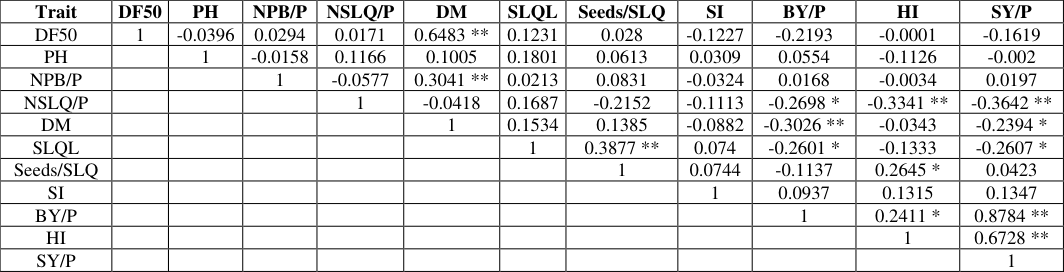 Table 4
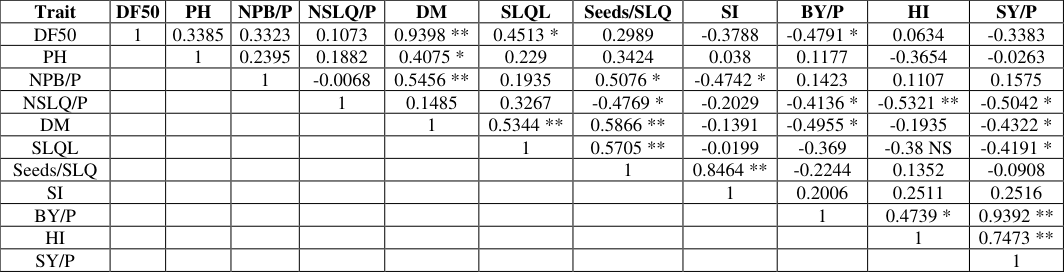 Table 5
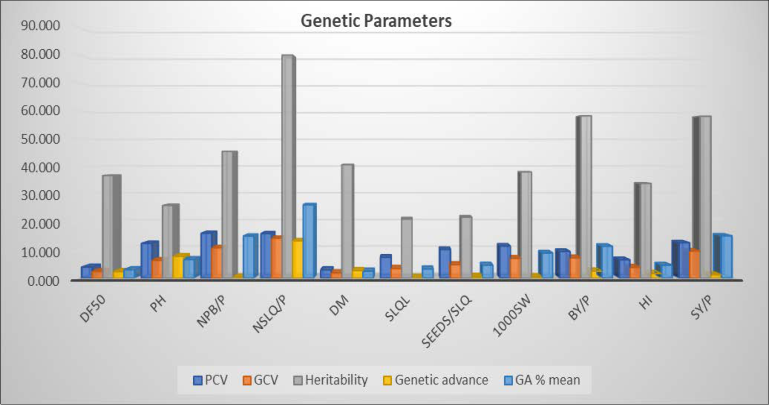 Figure 1
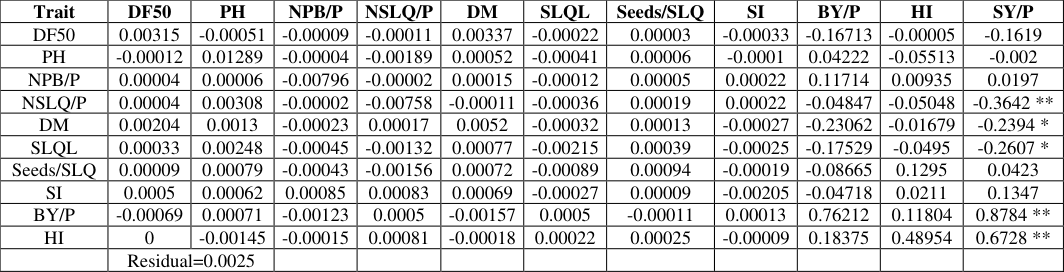 Table 6
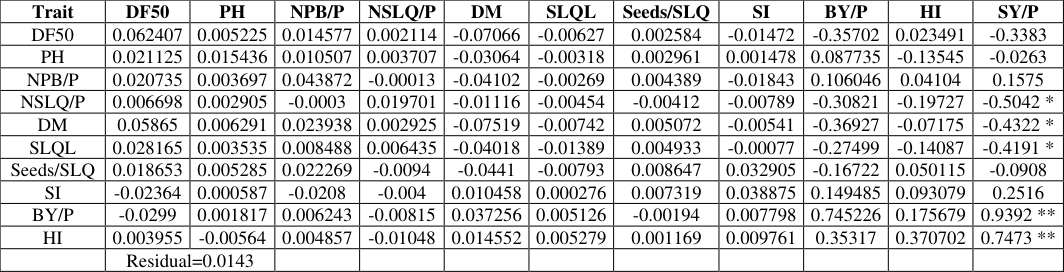 Table 7
Introduction
Indian mustard (Brassica juncea L. Czern & Coss) stands as one of India's most significant oilseed crops, playing a crucial role in the nation's agricultural economy and food security. As the primary source of edible oil for millions of Indians, mustard contributes approximately 13-15% of the country's total edible oil production. The crop is predominantly cultivated during the winter season (rabi) across diverse agroclimatic zones, occupying around 6.86 million hectares and producing nearly 9.12 million tonnes of seeds annually, with an average productivity of 1,331 kg per hectare. Despite India's position as a leading global producer of rapeseed-mustard, the country's productivity remains significantly below the world average of 1,974 kg per hectare. This substantial yield gap represents both a challenge and an opportunity for agricultural scientists and breeders to enhance crop productivity through genetic improvement and advanced breeding strategies. The strategic importance of mustard is further amplified by India's heavy dependence on edible oil imports, which currently account for over 50% of domestic consumption, creating vulnerability to global price fluctuations and emphasizing the need for enhanced domestic production. The genetic foundation for crop improvement lies in the availability of genetic variability within the crop species. Indian mustard, being an amphidiploid species (2n=36) with A and B genomes derived from Brassica rapa and Brassica nigra respectively, possesses considerable genetic diversity accumulated through centuries of cultivation and natural selection across varied environments. This genetic wealth, preserved in indigenous landraces, traditional cultivars, and modern breeding lines, provides the raw material essential for developing superior varieties with enhanced yield potential, improved quality traits, and resilience to biotic and abiotic stresses. Understanding the relationships among yield components is equally crucial for designing effective breeding strategies. Seed yield, being a complex polygenic trait, results from the intricate interactions of multiple component traits. Correlation studies help identify traits that are positively or negatively associated with yield, enabling breeders to design appropriate selection strategies. Path coefficient analysis further dissects these relationships by partitioning correlations into direct and indirect effects, providing deeper insights into the relative importance of different traits in determining final yield. Recent advances in statistical genetics and breeding methodologies have provided powerful tools for characterizing genetic variability and understanding trait relationships. Parameters such as genotypic and phenotypic coefficients of variation, heritability, and genetic advance help quantify the extent of genetic variability and predict the effectiveness of selection. High heritability estimates indicate that observed variation is primarily due to genetic factors rather than environmental influences, suggesting good prospects for genetic improvement through selection. The present investigation was undertaken to evaluate genetic variability, estimate genetic parameters, and study trait associations in a diverse set of 24 Indian mustard genotypes. The specific objectives were: (1) to assess the extent of genetic variability, heritability, and genetic advance for various quantitative traits, (2) to determine phenotypic and genotypic correlations among different traits, and (3) to estimate direct and indirect effects of yield component traits on seed yield through path coefficient analysis.
Review of Literature 2.1 Genetic Variability, Heritability and Genetic Advance
Genetic variability forms the foundation of any successful plant breeding program. Verma et al. (2015) [12] studied 30 genotypes of Indian mustard and reported significant genotypic variability for traits such as plant height, number of branches per plant, siliquae per plant, 1000-seed weight, and seed yield per plant. High heritability and genetic advance were noted for seed yield and number of siliquae per plant, suggesting additive gene action and potential for improvement through selection. Similarly, Bisht et al. (2016) [1] evaluated 40 genotypes and found wide variability for siliqua length, seeds per siliqua, and seed yield per plant. High genotypic and phenotypic coefficients of variation were recorded for siliquae per plant and seed yield, along with high heritability and genetic advance, indicating the possibility of yield enhancement through direct selection. Kumar and Chauhan (2017) [6] analyzed 52 accessions of Indian mustard and observed significant variation among genotypes. Traits such as number of siliquae per plant, biological yield, and seed yield showed high GCV, heritability, and genetic advance, indicating these are governed mainly by additive gene effects and are suitable for improvement through selection.
More recent studies have continued to demonstrate the presence of substantial genetic variability in mustard germplasm. Tripathi et al. (2022) [11] used multivariate analysis and variability studies on 55 genotypes and observed that siliquae per plant, seed yield per plant, and 1000-seed weight contributed majorly to total variation. These traits showed high GCV, heritability, and genetic advance, making them suitable for yield improvement.
Correlation Studies
Correlation analysis provides valuable information about the degree and direction of association between different traits. Yadava et al. (2015) [16] studied correlation among yield and its components in 40 Indian mustard genotypes and reported that seed yield per plant had strong positive correlation with number of siliquae per plant, biological yield, and harvest index. Days to maturity showed negative correlation with seed yield. Meena et al. (2016) [8] analyzed 45 genotypes and found significant positive correlation of seed yield with number of primary branches, number of siliquae per plant, and test weight. Negative correlation was observed with days to 50% flowering and plant height, suggesting that early flowering and moderate plant height are associated with higher yields. Kumar et al. (2019) [7] studied 60 Indian mustard genotypes and found that seed yield per plant was positively and significantly correlated with number of primary and secondary branches, siliquae per plant, and oil content. Negative correlation was reported with days to maturity, indicating the advantage of early-maturing varieties.
Path Coefficient Analysis
Path coefficient analysis helps in understanding the direct and indirect effects of different traits on yield. Singh et al. (2015) [10] conducted path coefficient analysis in 30 genotypes and found that biological yield per plant had the highest positive direct effect on seed yield followed by number of siliquae per plant. Indirect effects through 1000seed weight and plant height were also significant. Verma et al. (2017) [13] analyzed path coefficients in 42 genotypes and observed that biological yield had the highest direct contribution to seed yield followed by number of seeds per siliqua. Days to flowering had a negative direct effect but positive indirect effects via siliquae per plant. Recent studies have consistently shown the importance of biological yield and harvest index in determining seed yield. Choudhary et al. (2021) [2] observed high positive direct effects of biological yield, siliquae per plant, and harvest index on seed yield. Days to maturity and number of secondary branches contributed indirectly through biological yield and siliquae per plant.
Materials and Methods
Materials and Methods
Experimental Site and Design
The present investigation was conducted at the Crop Research Farm, Department of Genetics and Plant Breeding, Naini Agricultural Institute, Sam Higginbottom University of Agriculture, Technology and Sciences, Prayagraj, Uttar Pradesh during the rabi season of 2024-2025. The experiment was laid out in a Randomized Block Design (RBD) with three replications. Each plot consisted of 4 rows of 3 m length with a spacing of 45 cm between rows and 15 cm between plants within rows. The recommended package of practices was followed to raise a healthy crop, including the application of fertilizers at the rate of 60:30:40 kg/ha of N:P:K.
Plant Material
The experimental material comprised 24 genotypes of Indian mustard obtained from the Department of Genetics and Plant Breeding, SHUATS. The genotypes included both released varieties and advanced breeding lines representing diverse genetic backgrounds and geographical origins.
Meteorological Conditions
The weather conditions during the crop growing period were favorable for mustard cultivation. The average temperature ranged from 15°C to 30 °C during the crop season. Humidity levels varied from 28% to 75%, with minimal rainfall during the critical growth stages. All observations except days to flowering and maturity were recorded on five randomly selected plants per plot, and the mean values were used for statistical analysis.
Data Collection
Data Collection
Statistical Analysis
The data were subjected to the following statistical analyses:
• Analysis of Variance (ANOVA): Performed according to the method described by Fisher (1918) [4] to test the significance of differences among genotypes. • Genetic Parameters: Genotypic and phenotypic coefficients of variation (GCV and PCV), heritability in broad sense, and genetic advance were calculated following standard formulas. • Correlation Analysis: Phenotypic and genotypic correlation coefficients were computed according to the method given by Johnson et al. (1955) [5] . • Path Analysis: Direct and indirect effects of different traits on seed yield were calculated using path coefficient analysis as described by Dewey and Lu (1959) [3] .
Results and Discussion
Results and Discussion
Analysis of Variance
The analysis of variance revealed significant differences among the 24 mustard genotypes for most of the traits studied Highly significant (p≤ 0.01) mean sum of squares were observed for days to 50% flowering (16.115) [14] and Meena et al. (2019) [9] , who reported significant genotypic variations for yield and yield-attributing traits in Indian mustard.
Genetic Parameters
The estimates of genetic parameters for all traits are presented in The phenotypic coefficient of variation (PCV) was higher than the genotypic coefficient of variation (GCV) for all traits, indicating the influence of environment on trait expression. However, the differences between PCV and GCV were relatively small for most traits, suggesting that the observed variation was primarily due to genetic factors.
High GCV (>20%) was observed for number of siliquae per plant (14.26%), indicating substantial genetic variability for this trait. Moderate GCV (10-20%) was recorded for number of primary branches per plant (10.84%) and seed yield per plant (9.66%).
Heritability estimates in broad sense were high (>60%) for number of siliquae per plant (80.01%), biological yield per plant (58.23%), and seed yield per plant (58.08%). These high heritability values indicate that selection for these traits would be effective as a large proportion of the observed variation is due to genetic factors. Genetic advance as percentage of mean was highest for number of siliquae per plant (26.28%), followed by seed yield per plant (15.16%) and number of primary branches per plant (15.05%). High genetic advance coupled with high heritability for these traits suggests that improvement through selection would be effective.
Correlation Analysis 4.4.1 Phenotypic Correlations
The phenotypic correlation coefficients among different traits are presented in Seed yield per plant showed highly significant positive correlations with biological yield per plant (0.878) and harvest index (0.673). Significant negative correlations were observed with number of siliquae per plant (-0.364), days to maturity (-0.239), and siliqua length (-0.261). The strong positive correlation between seed yield and biological yield indicates that genotypes producing higher total biomass tend to have higher seed yield.
Similarly, the positive correlation with harvest index suggests that efficient partitioning of biomass to economic parts is crucial for high seed yield.
Genotypic Correlations
Genotypic correlations were generally higher in magnitude than phenotypic correlations, indicating strong genetic associations among traits Seed yield per plant showed highly significant positive genotypic correlations with biological yield per plant (0.939) and harvest index (0.747). The negative correlations of seed yield with number of siliquae per plant (-0.504), days to maturity (-0.432), and siliqua length (-0.419) indicate trade-offs that need to be carefully managed in breeding programs. These results suggest that while increasing the number of siliquae might seem beneficial, it could lead to reduced individual siliqua filling and ultimately lower seed yield. The results of phenotypic path analysis are presented Biological yield per plant had the highest positive direct effect (0.762) on seed yield, followed by harvest index (0.490). These results confirm that biological yield and harvest index are the most important determinants of seed yield in mustard. Number of siliquae per plant showed a small negative direct effect (-0.008) on seed yield, despite having a significant negative correlation. This suggests that the negative association is primarily through indirect effects via other traits, particularly biological yield and harvest index.
Genotypic Path Analysis
Genotypic path analysis revealed similar trends to phenotypic analysis. Biological yield per plant (0.745) and harvest index (0.371) had the highest positive direct effects on seed yield. The residual effect was low (0.014), indicating that the traits included in the analysis explained most of the variation in seed yield. These results are consistent with earlier findings of Singh et al. (2015) [10] and Verma et al. (2017) [13] , who reported biological yield as the most important trait contributing directly to seed yield in mustard.
Superior Genotypes
Based on the overall performance across traits, genotype CS-60 emerged as the most promising, recording the highest seed yield (10.09 g), biological yield (27.44 g), and seed index (4.88 g). This genotype also showed early flowering (72.33 days) and moderate days to maturity (105.33 days). Genotype Brijraj recorded the highest harvest index (39.93%) and good seed yield (8.76 g), making it valuable for breeding programs aimed at improving harvest index. RGN-298 also showed good performance with high seed yield (8.42 g) and harvest index (36.14%). These findings contribute valuable information for mustard breeders and provide a foundation for developing highyielding varieties through systematic breeding approaches. The high heritability estimates for key traits and identification of superior genotypes offer promising prospects for genetic improvement of Indian mustard.
Conclusions 1. Genetic Variability
Conclusions 1. Genetic Variability
Figures and tables from the paper
| S. No | Source of variance | Mean sum of squares (MSS) | — | — |
|---|---|---|---|---|
| Degrees of freedom | Genotype | Replication | Error | |
| 23 | 2 | 46 | ||
| 1 | Days to 50% flowering | 16.115** | 518.389 | 5.867 |
| 2 | Plant height | 320.752* | 4239.639 | 155.941 |
| 3 | No of primary branches | 0.126** | 0.107 | 0.036 |
| 4 | No of siliquae per plant | 170.660** | 14.691 | 13.120 |
| 5 | Days to maturity | 18.318** | 683.556 | 5.990 |
| 6 | Siliquae length | 0.190* | 0.491 | 0.105 |
| 7 | Number of seeds per siliquae | 1.975* | 0.732 | 1.074 |
| 8 | Seed index | 0.408** | 0.488 | 0.144 |
| 9 | Biological yield per plant | 9.409** | 6.679 | 1.816 |
| 10 | Harvest index | 9.051** | 11.323 | 3.560 |
| 11 | Seed yield per plant | 2.107** | 2.381 | 0.409 |
Table text extracted from the original PDF; superscript letters are shown inline. The original table image is below.
View original table image
| Genotype | DF50 | PH | NPB/P | NSLQ/P | DM | SLQL | Seeds/SLQ | SI | BY/P | HI | SY/P |
|---|---|---|---|---|---|---|---|---|---|---|---|
| Patan Mustard | 77.667 | 125.720 | 1.733 | 48.940 | 108.000 | 4.847 | 11.267 | 4.267 | 22.723 | 34.336 | 7.783 |
| Radhika | 74.333 | 117.880 | 1.533 | 51.360 | 104.667 | 5.060 | 11.267 | 4.603 | 24.697 | 35.400 | 8.750 |
| CS-60 | 72.333 | 128.393 | 1.667 | 46.450 | 105.333 | 4.630 | 11.867 | 4.883 | 27.437 | 36.746 | 10.090 |
| RGN-298 | 76.667 | 129.113 | 1.733 | 48.177 | 105.667 | 4.827 | 10.400 | 3.880 | 23.283 | 36.138 | 8.417 |
| Krishna | 73.667 | 122.860 | 1.533 | 60.630 | 103.333 | 4.943 | 11.267 | 3.940 | 20.963 | 35.337 | 7.397 |
| Rajat | 78.333 | 122.013 | 1.467 | 64.407 | 109.333 | 5.100 | 10.867 | 4.087 | 19.400 | 34.492 | 6.710 |
| Shivani | 78.667 | 118.361 | 1.800 | 52.067 | 111.667 | 4.660 | 11.333 | 4.353 | 21.287 | 36.827 | 7.857 |
| RH-761 | 81.000 | 125.253 | 1.667 | 55.150 | 111.000 | 4.680 | 11.133 | 3.747 | 23.620 | 36.909 | 8.757 |
| Rohini | 77.000 | 113.940 | 1.667 | 44.843 | 107.333 | 4.817 | 11.933 | 3.860 | 21.583 | 37.147 | 8.017 |
| Pusa Vijay | 78.000 | 111.273 | 1.600 | 68.307 | 109.667 | 4.900 | 11.333 | 4.647 | 19.913 | 32.848 | 6.527 |
| RH-819 | 79.667 | 116.600 | 1.467 | 50.607 | 109.667 | 5.007 | 10.267 | 4.300 | 22.723 | 36.566 | 8.290 |
| Seeta | 74.667 | 109.560 | 1.733 | 61.163 | 107.333 | 5.140 | 11.267 | 3.853 | 20.247 | 32.407 | 6.577 |
| Jm-1 | 77.333 | 105.893 | 1.267 | 46.673 | 106.667 | 4.853 | 10.800 | 4.173 | 22.120 | 34.729 | 7.687 |
| PDZ-1 | 77.333 | 110.280 | 1.800 | 47.277 | 109.333 | 4.787 | 11.000 | 3.620 | 23.023 | 37.007 | 8.523 |
| Jm-2 | 78.000 | 107.447 | 1.467 | 54.207 | 106.000 | 4.413 | 10.400 | 4.300 | 21.410 | 35.547 | 7.603 |
| NRCDR-02 | 78.333 | 109.673 | 1.867 | 36.697 | 109.333 | 5.167 | 13.467 | 4.553 | 21.793 | 36.165 | 7.890 |
| Narendra Rai | 79.000 | 127.013 | 1.800 | 43.333 | 111.333 | 4.567 | 11.800 | 3.773 | 20.503 | 33.289 | 6.830 |
| DRMR-150-35 | 80.667 | 128.660 | 1.400 | 46.370 | 110.333 | 5.180 | 12.067 | 4.660 | 20.863 | 34.487 | 7.210 |
| RB-50 | 77.333 | 142.267 | 1.467 | 52.493 | 111.333 | 5.360 | 12.533 | 4.360 | 20.173 | 33.518 | 6.790 |
| Ashirwad | 74.333 | 105.900 | 1.333 | 43.130 | 107.000 | 4.633 | 11.533 | 4.640 | 20.177 | 37.224 | 7.507 |
| Brijraj | 77.333 | 104.060 | 1.400 | 42.933 | 106.667 | 4.900 | 12.733 | 4.627 | 21.997 | 39.931 | 8.757 |
| RH-406 | 80.333 | 118.840 | 1.400 | 56.793 | 108.667 | 5.213 | 12.000 | 3.750 | 21.593 | 35.233 | 7.607 |
| Pusa Mahak | 75.333 | 99.047 | 1.400 | 44.067 | 106.000 | 4.720 | 10.133 | 3.820 | 23.280 | 33.407 | 7.780 |
| Durgamani | 80.333 | 108.387 | 2.133 | 53.437 | 112.667 | 5.347 | 12.133 | 4.047 | 21.120 | 36.292 | 7.660 |
| Minimum | 72.333 | 99.047 | 1.267 | 36.697 | 103.333 | 4.413 | 10.133 | 3.620 | 19.400 | 32.407 | 6.527 |
| Maximum | 81.000 | 142.267 | 2.133 | 68.307 | 112.667 | 5.360 | 13.467 | 4.883 | 27.437 | 39.931 | 10.090 |
| Grand Mean | 77.403 | 117.018 | 1.597 | 50.813 | 108.264 | 4.906 | 11.450 | 4.198 | 21.914 | 35.499 | 7.792 |
| SEm | 1.398 | 7.210 | 0.109 | 2.091 | 1.413 | 0.187 | 0.598 | 0.219 | 0.778 | 1.089 | 0.369 |
| SEd | 1.978 | 10.196 | 0.155 | 2.957 | 1.998 | 0.265 | 0.846 | 0.309 | 1.100 | 1.541 | 0.522 |
| CD 5% | 3.981 | 20.524 | 0.311 | 5.953 | 4.023 | 0.533 | 1.703 | 0.623 | 2.215 | 3.101 | 1.051 |
| CD 1% | 5.314 | 27.397 | 0.416 | 7.947 | 5.370 | 0.711 | 2.274 | 0.831 | 2.956 | 4.140 | 1.402 |
| CV | 3.129 | 10.672 | 11.866 | 7.128 | 2.261 | 6.609 | 9.052 | 9.027 | 6.149 | 5.315 | 8.203 |
Table text extracted from the original PDF; superscript letters are shown inline. The original table image is below.
View original table image
| S. No | Trait | Phenotypic coefficient of variation (%) | Genotypic coefficient of variation (%) | Heritability Broad Sense (%) | Genetic advance | Genetic Advance as percent of mean |
|---|---|---|---|---|---|---|
| 1 | Days to 50% flowering | 3.936 | 2.388 | 36.798 | 2.310 | 2.984 |
| 2 | Plant height | 12.410 | 6.334 | 26.052 | 7.793 | 6.660 |
| 3 | Number of primary branches | 16.069 | 10.835 | 45.471 | 0.240 | 15.052 |
| 4 | Number of siliquae per plant | 15.944 | 14.261 | 80.011 | 13.353 | 26.279 |
| 5 | Days to maturity | 2.935 | 1.872 | 40.688 | 2.664 | 2.460 |
| 6 | Siliquae length | 7.443 | 3.423 | 21.151 | 0.159 | 3.243 |
| 7 | Seeds per siliquae | 10.239 | 4.785 | 21.839 | 0.527 | 4.606 |
| 8 | Seed index | 11.468 | 7.073 | 38.044 | 0.377 | 8.988 |
| 9 | Biological yield per plant | 9.514 | 7.260 | 58.227 | 2.501 | 11.412 |
| 10 | Harvest index | 6.540 | 3.811 | 33.952 | 1.624 | 4.574 |
| 11 | Seed yield per plant | 12.669 | 9.655 | 58.076 | 1.181 | 15.157 |
Table text extracted from the original PDF; superscript letters are shown inline. The original table image is below.
View original table image
| Trait | DF50 | PH | NPB/P | NSLQ/P | DM | SLQL | Seeds/SLQ | SI | BY/P | HI | SY/P |
|---|---|---|---|---|---|---|---|---|---|---|---|
| DF50 | 1 | -0.0396 | 0.0294 | 0.0171 | 0.6483 ** | 0.1231 | 0.028 | -0.1227 | -0.2193 | -0.0001 | -0.1619 |
| PH | 1 | -0.0158 | 0.1166 | 0.1005 | 0.1801 | 0.0613 | 0.0309 | 0.0554 | -0.1126 | -0.002 | |
| NPB/P | 1 | -0.0577 | 0.3041 ** | 0.0213 | 0.0831 | -0.0324 | 0.0168 | -0.0034 | 0.0197 | ||
| NSLQ/P | 1 | -0.0418 | 0.1687 | -0.2152 | -0.1113 | -0.2698 * | -0.3341 ** | -0.3642 ** | |||
| DM | 1 | 0.1534 | 0.1385 | -0.0882 | -0.3026 ** | -0.0343 | -0.2394 * | ||||
| SLQL | 1 | 0.3877 ** | 0.074 | -0.2601 * | -0.1333 | -0.2607 * | |||||
| Seeds/SLQ | 1 | 0.0744 | -0.1137 | 0.2645 * | 0.0423 | ||||||
| SI | 1 | 0.0937 | 0.1315 | 0.1347 | |||||||
| BY/P | 1 | 0.2411 * | 0.8784 ** | ||||||||
| HI | 1 | 0.6728 ** | |||||||||
| SY/P | 1 |
Table text extracted from the original PDF; superscript letters are shown inline. The original table image is below.
View original table image
| Trait | DF50 | PH | NPB/P | NSLQ/P | DM | SLQL | Seeds/SLQ | SI | BY/P | HI | SY/P |
|---|---|---|---|---|---|---|---|---|---|---|---|
| DF50 | 1 | 0.3385 | 0.3323 | 0.1073 | 0.9398 ** | 0.4513 * | 0.2989 | -0.3788 | -0.4791 * | 0.0634 | -0.3383 |
| PH | 1 | 0.2395 | 0.1882 | 0.4075 * | 0.229 | 0.3424 | 0.038 | 0.1177 | -0.3654 | -0.0263 | |
| NPB/P | 1 | -0.0068 | 0.5456 ** | 0.1935 | 0.5076 * | -0.4742 * | 0.1423 | 0.1107 | 0.1575 | ||
| NSLQ/P | 1 | 0.1485 | 0.3267 | -0.4769 * | -0.2029 | -0.4136 * | -0.5321 ** | -0.5042 * | |||
| DM | 1 | 0.5344 ** | 0.5866 ** | -0.1391 | -0.4955 * | -0.1935 | -0.4322 * | ||||
| SLQL | 1 | 0.5705 ** | -0.0199 | -0.369 | -0.38 NS | -0.4191 * | |||||
| Seeds/SLQ | 1 | 0.8464 ** | -0.2244 | 0.1352 | -0.0908 | ||||||
| SI | 1 | 0.2006 | 0.2511 | 0.2516 | |||||||
| BY/P | 1 | 0.4739 * | 0.9392 ** | ||||||||
| HI | 1 | 0.7473 ** | |||||||||
| SY/P | 1 |
Table text extracted from the original PDF; superscript letters are shown inline. The original table image is below.
View original table image
| Trait | DF50 | PH | NPB/P | NSLQ/P | DM | SLQL | Seeds/SLQ | SI | BY/P | HI | SY/P |
|---|---|---|---|---|---|---|---|---|---|---|---|
| DF50 | 0.00315 | -0.00051 | -0.00009 | -0.00011 | 0.00337 | -0.00022 | 0.00003 | -0.00033 | -0.16713 | -0.00005 | -0.1619 |
| PH | -0.00012 | 0.01289 | -0.00004 | -0.00189 | 0.00052 | -0.00041 | 0.00006 | -0.0001 | 0.04222 | -0.05513 | -0.002 |
| NPB/P | 0.00004 | 0.00006 | -0.00796 | -0.00002 | 0.00015 | -0.00012 | 0.00005 | 0.00022 | 0.11714 | 0.00935 | 0.0197 |
| NSLQ/P | 0.00004 | 0.00308 | -0.00002 | -0.00758 | -0.00011 | -0.00036 | 0.00019 | 0.00022 | -0.04847 | -0.05048 | -0.3642 ** |
| DM | 0.00204 | 0.0013 | -0.00023 | 0.00017 | 0.0052 | -0.00032 | 0.00013 | -0.00027 | -0.23062 | -0.01679 | -0.2394 * |
| SLQL | 0.00033 | 0.00248 | -0.00045 | -0.00132 | 0.00077 | -0.00215 | 0.00039 | -0.00025 | -0.17529 | -0.0495 | -0.2607 * |
| Seeds/SLQ | 0.00009 | 0.00079 | -0.00043 | -0.00156 | 0.00072 | -0.00089 | 0.00094 | -0.00019 | -0.08665 | 0.1295 | 0.0423 |
| SI | 0.0005 | 0.00062 | 0.00085 | 0.00083 | 0.00069 | -0.00027 | 0.00009 | -0.00205 | -0.04718 | 0.0211 | 0.1347 |
| BY/P | -0.00069 | 0.00071 | -0.00123 | 0.0005 | -0.00157 | 0.0005 | -0.00011 | 0.00013 | 0.76212 | 0.11804 | 0.8784 ** |
| HI | 0 | -0.00145 | -0.00015 | 0.00081 | -0.00018 | 0.00022 | 0.00025 | -0.00009 | 0.18375 | 0.48954 | 0.6728 ** |
| Residual=0.0025 |
Table text extracted from the original PDF; superscript letters are shown inline. The original table image is below.
View original table image
| Trait | DF50 | PH | NPB/P | NSLQ/P | DM | SLQL | Seeds/SLQ | SI | BY/P | HI | SY/P |
|---|---|---|---|---|---|---|---|---|---|---|---|
| DF50 | 0.062407 | 0.005225 | 0.014577 | 0.002114 | -0.07066 | -0.00627 | 0.002584 | -0.01472 | -0.35702 | 0.023491 | -0.3383 |
| PH | 0.021125 | 0.015436 | 0.010507 | 0.003707 | -0.03064 | -0.00318 | 0.002961 | 0.001478 | 0.087735 | -0.13545 | -0.0263 |
| NPB/P | 0.020735 | 0.003697 | 0.043872 | -0.00013 | -0.04102 | -0.00269 | 0.004389 | -0.01843 | 0.106046 | 0.04104 | 0.1575 |
| NSLQ/P | 0.006698 | 0.002905 | -0.0003 | 0.019701 | -0.01116 | -0.00454 | -0.00412 | -0.00789 | -0.30821 | -0.19727 | -0.5042 * |
| DM | 0.05865 | 0.006291 | 0.023938 | 0.002925 | -0.07519 | -0.00742 | 0.005072 | -0.00541 | -0.36927 | -0.07175 | -0.4322 * |
| SLQL | 0.028165 | 0.003535 | 0.008488 | 0.006435 | -0.04018 | -0.01389 | 0.004933 | -0.00077 | -0.27499 | -0.14087 | -0.4191 * |
| Seeds/SLQ | 0.018653 | 0.005285 | 0.022269 | -0.0094 | -0.0441 | -0.00793 | 0.008647 | 0.032905 | -0.16722 | 0.050115 | -0.0908 |
| SI | -0.02364 | 0.000587 | -0.0208 | -0.004 | 0.010458 | 0.000276 | 0.007319 | 0.038875 | 0.149485 | 0.093079 | 0.2516 |
| BY/P | -0.0299 | 0.001817 | 0.006243 | -0.00815 | 0.037256 | 0.005126 | -0.00194 | 0.007798 | 0.745226 | 0.175679 | 0.9392 ** |
| HI | 0.003955 | -0.00564 | 0.004857 | -0.01048 | 0.014552 | 0.005279 | 0.001169 | 0.009761 | 0.35317 | 0.370702 | 0.7473 ** |
| Residual=0.0143 |
Table text extracted from the original PDF; superscript letters are shown inline. The original table image is below.
View original table image
References
16 in the original paper- Bisht NC, et al. Genetic variability and correlation studies in Indian mustard (Brassica juncea L.). Indian J Agric Sci. 2016;86(7):901-907.
- Choudhary R, et al. Path coefficient analysis for yield and its components in Indian mustard (Brassica juncea L.). Plant Breed Biotechnol. 2021;9(3):178-185.
- Dewey DR, Lu KH. A correlation and path-coefficient analysis of components of crested wheatgrass seed production. Agron J. 1959;51(9):515-518.
- Fisher RA. The correlation between relatives on the supposition of Mendelian inheritance. Trans R Soc Edinb. 1918;52(2):399-433.
- Johnson HW, Robinson HF, Comstock RE. Estimates of genetic and environmental variability in soybeans. Agron J. 1955;47(7):314-318.
- Kumar A, Chauhan JS. Genetic variability and heritability studies in Indian mustard (Brassica juncea L.). Indian J Plant Breed. 2017;77(2):234-40.
- Kumar R, et al. Correlation and path analysis in Indian mustard (Brassica juncea L.) genotypes. J Agric Sci. 2019;15(4):321-9.
- Meena R, et al. Correlation studies on yield and yieldattributing traits in Indian mustard (Brassica juncea L.). Indian J Genet. 2016;76(2):189-195.
- Meena SS, et al. Genetic variability and heritability in Indian mustard (Brassica juncea L.) genotypes. J Oilseed Res. 2019;36(3):145-152.
- Singh R, et al. Path coefficient analysis of yield and its components in Indian mustard (Brassica juncea L.). Indian J Genet. 2015;75(2):234-241.
- Tripathi A, et al. Multivariate analysis and variability studies in Indian mustard (Brassica juncea L.). Indian J Genet Plant Breed. 2022;82(2):201-209.
- Verma RP, et al. Genetic variability and correlation studies in Indian mustard (Brassica juncea L.). J Oilseed Res. 2015;6(2):123-129.
- Verma SK, et al. Path coefficient analysis of yield and its components in Indian mustard (Brassica juncea L.). J Crop Sci. 2017;8(3):178-185.
- Verma SS, et al. Genetic variability and heritability in Indian mustard (Brassica juncea L.) genotypes. Indian J Plant Breed. 2018;78(4):456-463.
- Wright S. Correlation and causation. J Agric Res. 1921;20(7):557-85.
- Yadava DK, et al. Correlation studies on yield and its components in Indian mustard (Brassica juncea L.). J Oilseed Brassica. 2015;6(1):45-51.