
Research article · 2025 · Full text
International Journal of Advanced Chemistry ResearchSynergistic effect of paddy straw biochar along with organic amendments on soil properties and nutrient uptake by field bean
Volume 7(8) · Pages 25–37 · DOI: 10.33545/26646781.2025.v7.i8a.305 ↗
Research areasAgronomic Practices and Intercropping Systems
Abstract
Author-writtenThe study was carried out to evaluate the effect of paddy straw biochar along with organic amendments on soil properties and nutrient uptake by field bean. The experiment comprised of 19 treatments with 5 replications. Biochar doses of 8, 10, and 12 t/ha were applied in combination with organic amendments such as farmyard manure (FYM), vermicompost (VC), Ghanajeevamruth (GA) and their various combinations. The present investigation reveals that addition of biochar along with organic amendments led to a notable enhancement in the water holding capacity (43.26 %) and decreased bulk density of post-harvest soil (1.34 Mg m-3). Moreover, the soil pH (7.79), electrical conductivity (0.17 dS m-1), organic carbon (0.57 %), primary nutrients (N, P2O5, K2O) and secondary nutrients (Ca, Mg, S) demonstrated a significant increase, although no much significant difference in the micronutrient status of the post-harvest soil was observed. There was a substantial rise in the uptake of major, secondary nutrients and micronutrients in treatment T17, which received 12 t ha-1 biochar + farmyard manure + vermicompost and exhibited an increase in plant nutrient concentration and total nutrient uptake compared to control (T19). This findings confirm that integrated use of biochar with organic manures (FYM + vermicompost) is an effective strategy for improving soil fertility and plant nutrition.
Summary
Source-checkedPlain-language reading of the full paper, prepared with AI and checked against the text. Each point links to the authors' own words.
Why it matters
- Unsustainable farming practices and heavy reliance on chemical fertilizers and pesticides have led to the degradation of soil quality. View evidence ↗
- Biochar can improve the physical, chemical, and biological properties of soil, including water holding capacity and carbon sequestration. View evidence ↗
- There is currently a lack of reliable guidelines regarding the specific types and amounts of organic materials that should be mixed with biochar to maximize plant growth. View evidence ↗
The question
- The study aimed to evaluate how paddy straw biochar, combined with organic amendments, affects soil properties and the nutrient uptake of field beans. View evidence ↗
What they did
- The research was conducted as a potted experiment at the GKVK campus in Bangalore. View evidence ↗
- Biochar was applied at three different doses (8, 10, and 12 t/ha) in combination with farmyard manure (FYM), vermicompost, and ghanajeevamruth. View evidence ↗
- The experiment used a completely randomized design (CRD) with 19 treatment combinations, each replicated five times. View evidence ↗
What they found
- Treatment T17 (12 t/ha biochar + FYM + VC) resulted in the highest water holding capacity (43.26%), highest porosity (61.53%), and lowest bulk density (1.34 Mg m-3). View evidence ↗
- Soil organic carbon was highest in treatment T17 (0.57%) and lowest in the control treatment T19 (0.46%). View evidence ↗
- The highest availability of nitrogen (274.50 kg ha-1), phosphorus (43.62 kg ha-1), and potassium (175.06 kg ha-1) occurred in treatment T17. View evidence ↗
- Treatment T17 showed the significantly highest available sulphur content at 18.34 mg kg-1. View evidence ↗
- The highest uptake of nitrogen (44.33 kg ha-1), phosphorus (7.94 kg ha-1), and potassium (9.04 kg ha-1) by the field bean was observed in treatment T17. View evidence ↗
- The highest uptake of micronutrients zinc (21.86 g ha-1) and iron (91.26 g ha-1) was found in treatment T17, while the lowest was in the control. View evidence ↗
- During the reproductive stage, the highest SPAD value (37.44) was recorded in treatment T17, compared to the lowest value (26.09) in the control. View evidence ↗
What it means
- The authors conclude that integrating biochar with organic manures (specifically FYM and vermicompost) is an effective strategy to improve plant nutrition and soil fertility. View evidence ↗
- The authors state that future research should investigate the long-term effects of these combinations on nutrient cycling, microbial diversity, and soil carbon sequestration. View evidence ↗
Visual summary
3 visualsIllustrations explain the paper; charts are replotted from the paper's own table values.
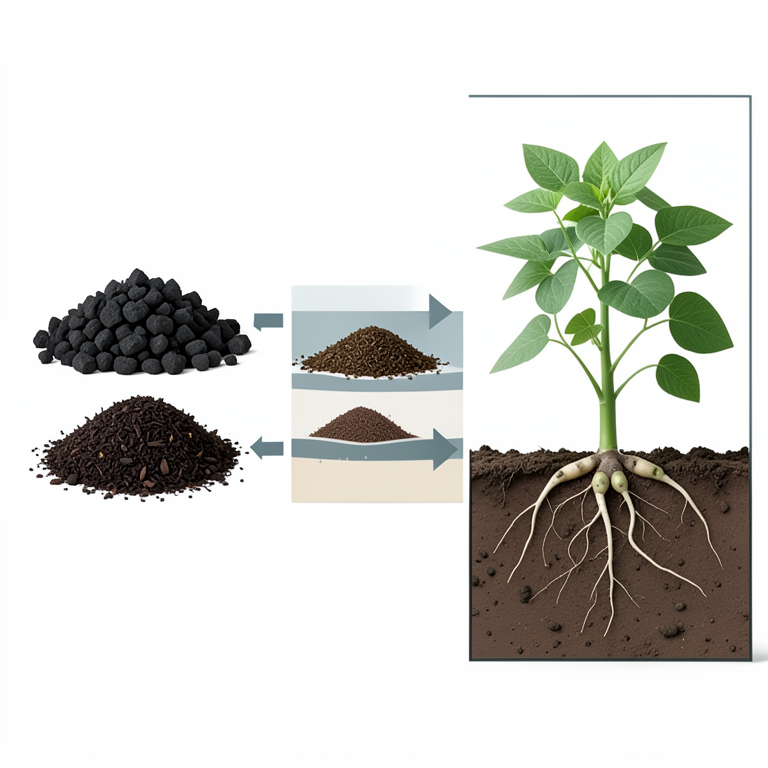
Experimental Treatment Matrix
AI-generated conceptual illustration (field bean plants in soil with paddy straw biochar and organic amendments). It explains the idea and does not show study data.
View source evidence ↗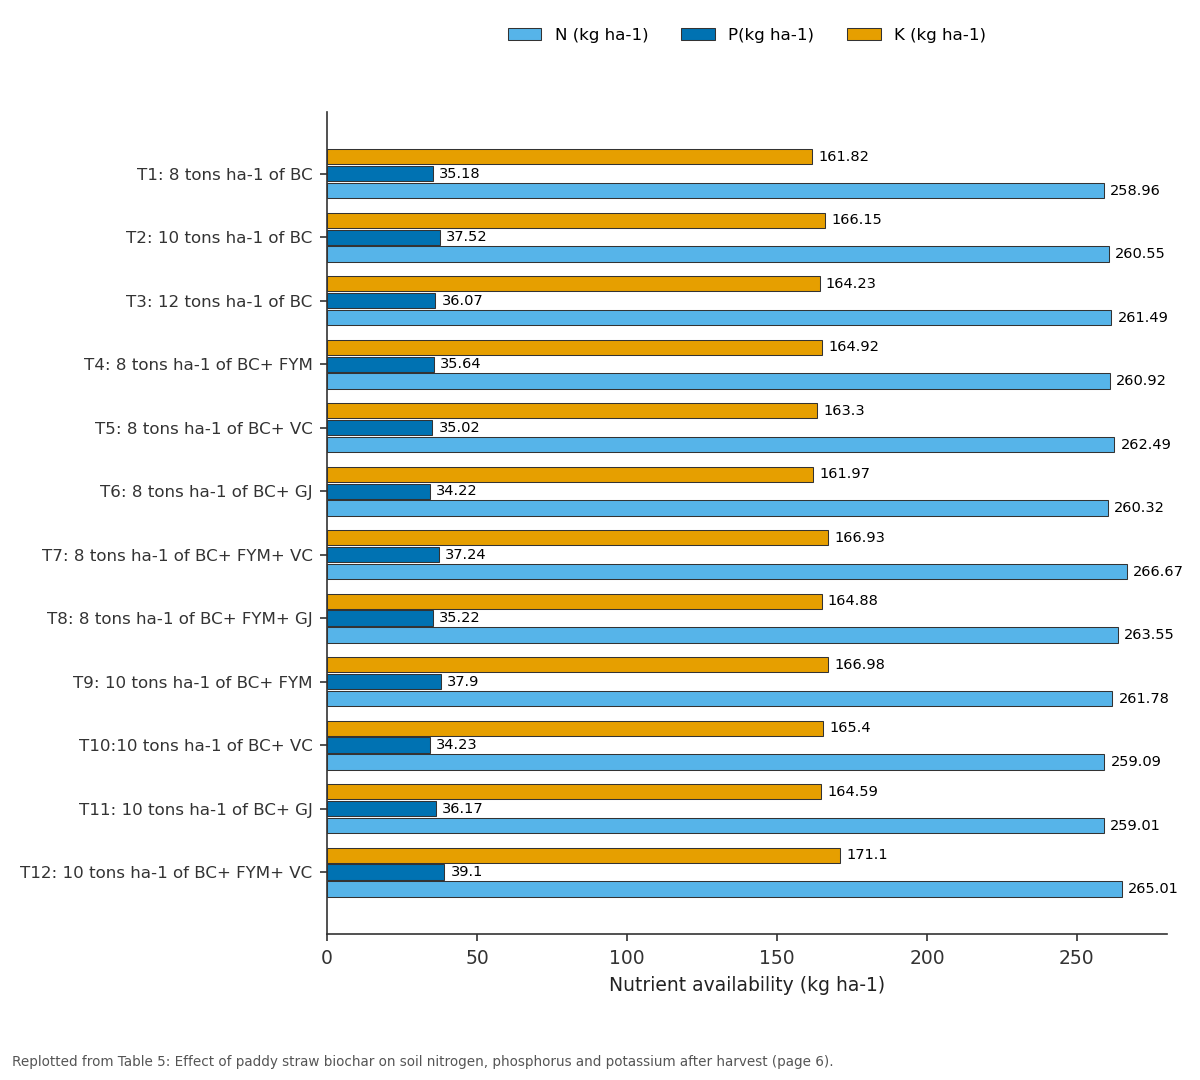
N (kg ha-1) and P(kg ha-1) and more: T1: 8 tons ha-1 of BC vs T2: 10 tons ha-1 of BC vs T3: 12 tons ha-1 of BC vs T4: 8 tons ha-1 of BC+... vs T5: 8 tons ha-1 of BC+...
Replotted from Table 5 (page 6) of the original paper. Every bar is the paper's own table value.
View source evidence ↗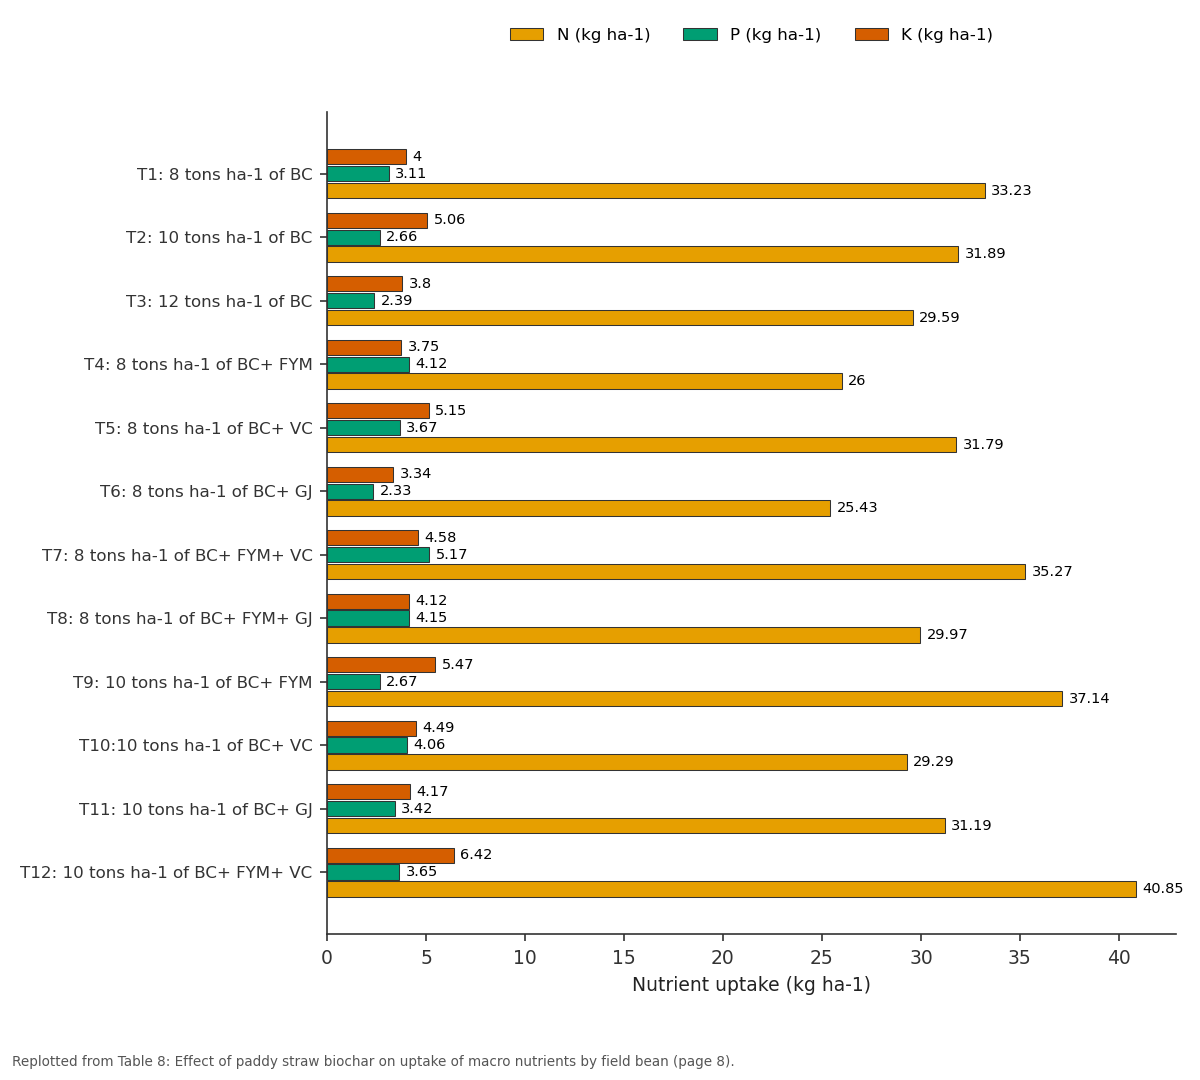
N (kg ha-1) and P (kg ha-1) and more: T1: 8 tons ha-1 of BC vs T2: 10 tons ha-1 of BC vs T3: 12 tons ha-1 of BC vs T4: 8 tons ha-1 of BC+... vs T5: 8 tons ha-1 of BC+...
Replotted from Table 8 (page 8) of the original paper. Every bar is the paper's own table value.
View source evidence ↗Figures & tables
From the original paper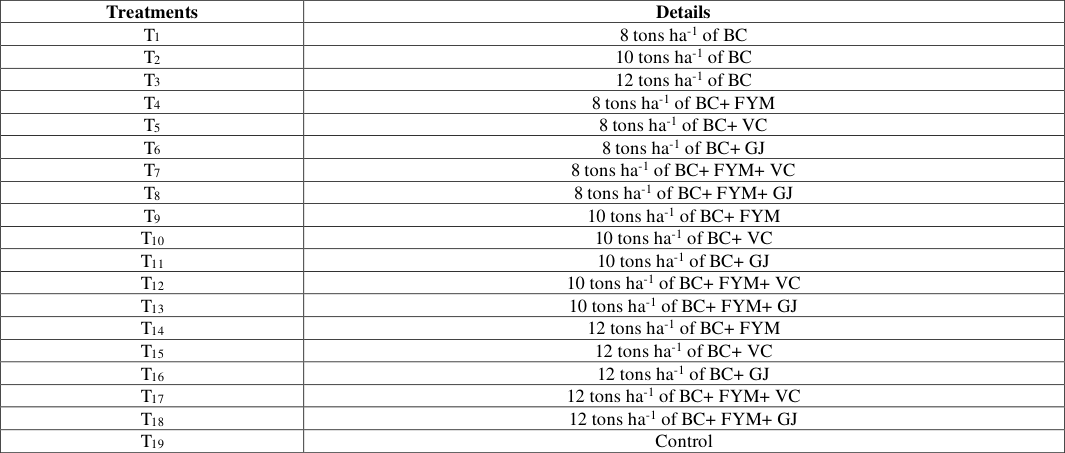 Table 1
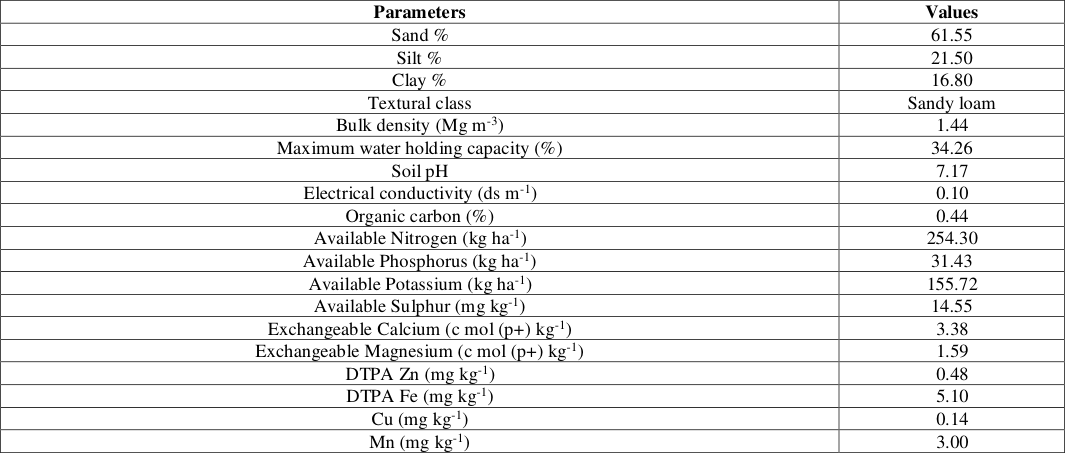 Table 2
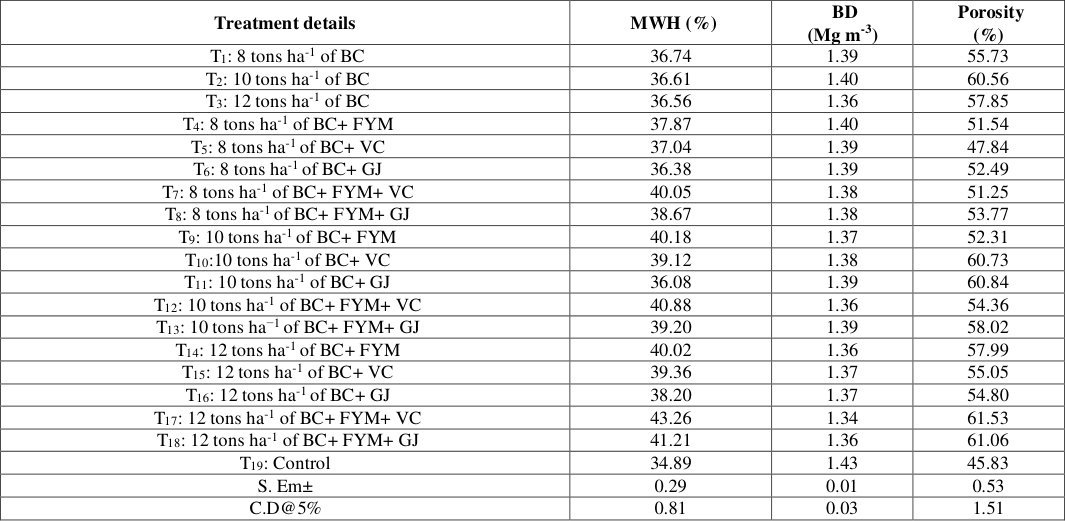 Table 3
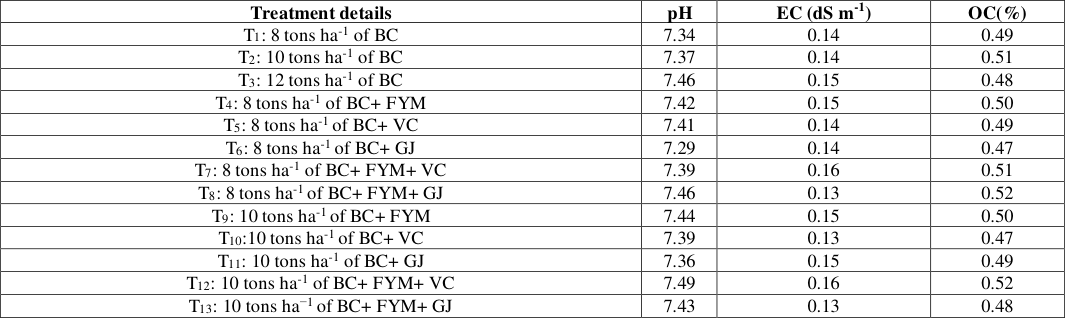 Table 4
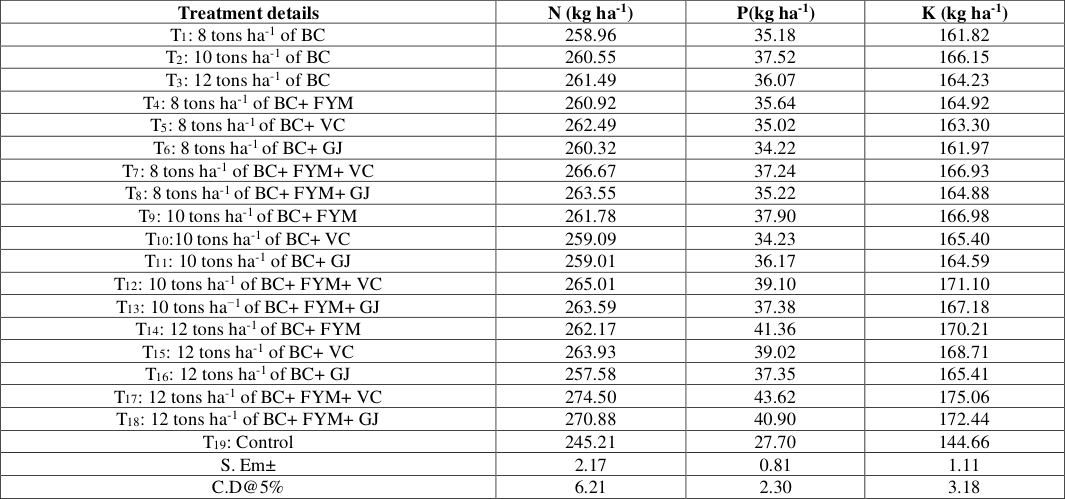 Table 5
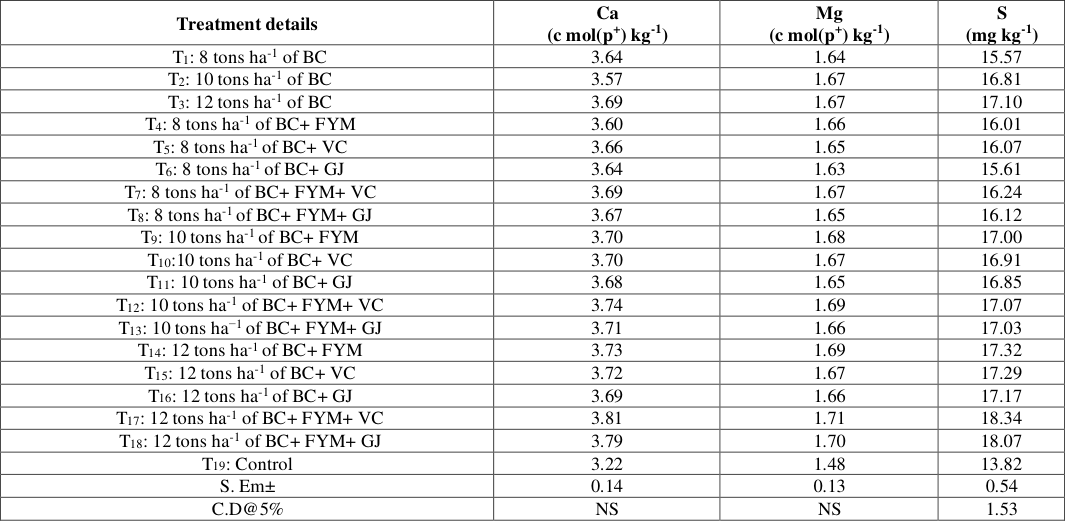 Table 6
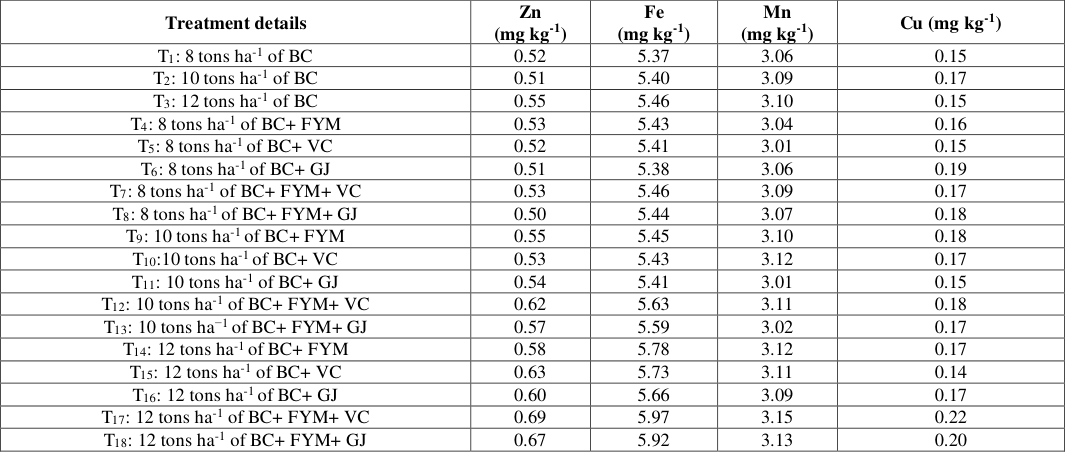 Table 7
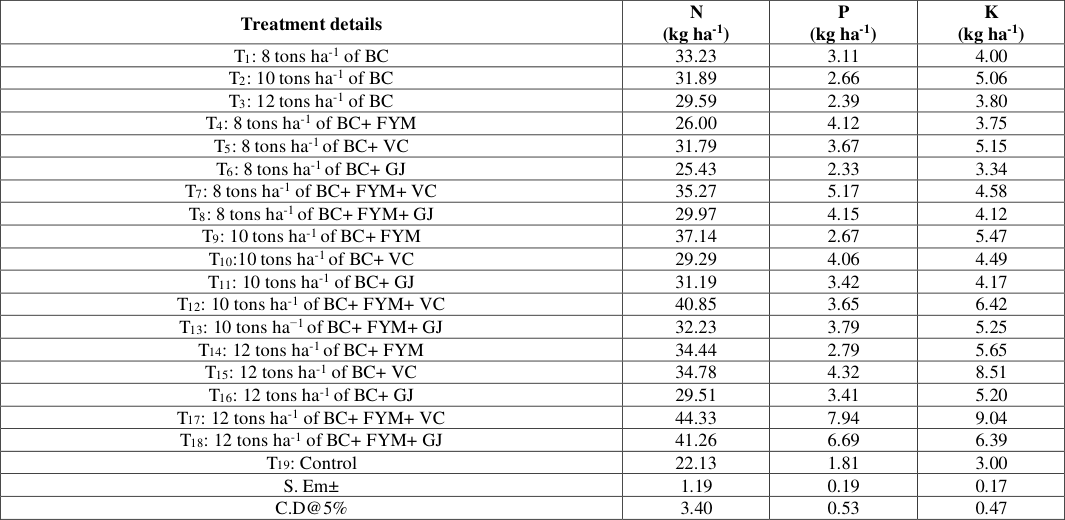 Table 8
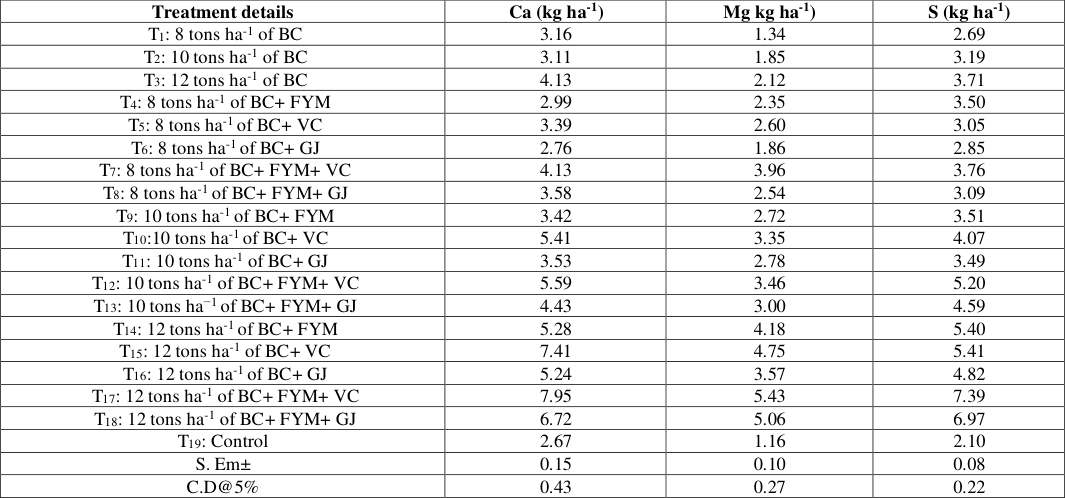 Table 9
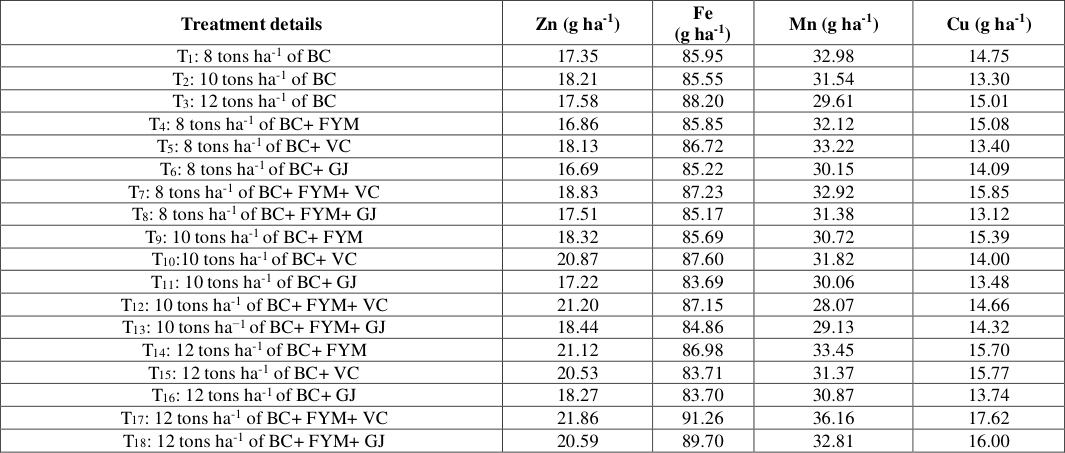 Table 10
 Table 11
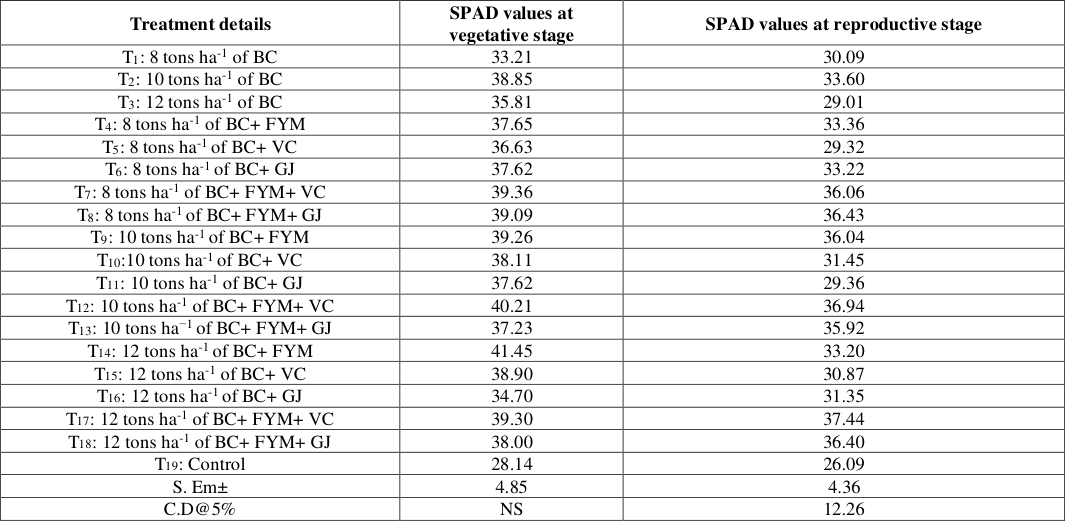 Table 11
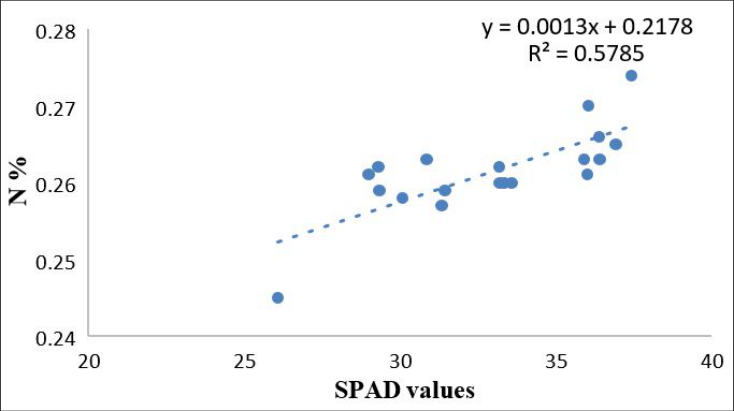 Figure 1
Introduction
Growing population demands have resulted in unsustainable farming practises and a significant reliance on chemical pesticides and fertilisers, which have degraded the soil quality (Vijay et al, 2021) [45] . The application of organic manures produced from biomass and animals plays a significant role in nutrient recycling through improving nutrient availability and soil physical properties (Hasler et al., 2015) [17] . Apart from the traditionally used organic manures like farmyard manure and vermicomposting, one of the key areas that captured global attention is the application of recalcitrant biochar produced from agricultural biomass (Bruun et al., 2016; Speratti et al., 2018) [6,40] . Application of biochar in soil not only remediate the pollutants from the soil but also improve the soil properties. Biochar improves physical (water holding capacity, O2 content and moisture level), chemical (pollutants immobilization and carbon sequestration), and biological (microbial abundance, diversity and activity) properties of the soils (Gul et al., 2015) [15] . These biochar characteristics eventually contribute to soil carbon sequestration (Windeatt et al., 2014) [48] , greenhouse gases (GHGs) emission reduction (Stewart et al., 2013) [56] and therefore contribute to an overall improvement in soil health (Zhang et al., 2013) [53] . Biochar has unique property to bind polar compounds through charged surface functional groups, which helps to immobilize rhizospheric heavy metals and agrochemicals on its surface and restricts their mobility into the crops (Khan et al., 2014, Spokas et al., 2009) [20,41] . Combination of BC with organic amendments may be a promising strategy to promote plant growth and performance, having positive synergistic effects on soil properties and plant growth responses. Synergistic effects of a BC-organic amendments blend on plant growth and performance are thought to be mediated by sorption of nutrients by the porous BC matrix, stimulation of microbial colonization, degradation of possible noxious pyrogenic substances, improvement of the BC surface reactivity happens through accelerated oxidative ageing and dissolved organic carbon sorption. When biochar and organic amendments were mixed, nonadditive interactions, either synergistic or antagonistic, were prevalent. Mixing biochar with fresh organic matter is a powerful factor to explicate the potential positive effects on higher plants by the application of such organic amendments. However, because of the limited and fragmented knowledge, reliable guidelines about the types and amount of organic materials that should be mixed with biochars is lacking to maximize plant growth. The chemical diversity of biochars, related to the quality of the initial organic feedstock and pyrolysis conditions, together with the large variety of organic matter types used in agriculture (composts, crop residues, humic substances, peat and organic wastes from agro-industry) define a great number of possible biochar-organic matter combinations. Effects of biochar application with organic inputs on soil properties or its potentiality as nutrient source deserve detailed investigation. Keeping this in view, the present research entitled "Synergistic effect of paddy straw biochar along with organic amendments on soil properties and nutrient uptake by field bean" was conducted. The main aim of this study is to evaluate the effect of paddy straw biochar along with organic amendments on soil properties and nutrient uptake by field bean.
Material and Methods
The research entitled "Synergistic effect of paddy straw biochar along with organic amendments on growth and yield of Field bean" was undertaken. In this study, a potted experiment was conducted at GKVK campus, Bangalore (13°08 'N and 77°57 'E). The region received an average rainfall of 412.4 mm during the cropping period (November to March).The maximum temperature ranged from 26.6°C to 33.3°C and minimum temperature ranged from 13.5°C to 21.1°C. The soil used for the experiment was neutral to alkaline with a pH of 7.17 and was acquired from the Research Institute on Organic Farming, GKVK, Bangalore. Based on the textural categorization using the international pipette technique, the soil was identified as sandy loam (61.55 % sand, 21.50 % silt and 16.80 % clay). Field beans (Vicia faba) variety, Hebbal avare from the Research institute on organic farming, University of Agricultural Sciences, Bangalore was used for this study. Three doses of biochar (8, 10 and 12 t/ha) were amended with organic amendments such as FYM, Vermicompost and ganajeevamruth. Apart from these soils with different doses of biochar without any organic amendments were kept as control. Thus a total of nineteen treatments were repeated three times in the 18 ×18 inches pot for the experiment. The study involved different dosages of biochar along with various organic amendments including farmyard manure (FYM), vermicompost (VC), ganajeevamruth (GA) and their combinations. The preparation of ganajeevamruth (GA) included mixing 10 kg of desi cow dung, 500 g of pulse flour, 500 ml of desi cow urine, 100 g of jaggery, and a handful of soil. This mixture was then powdered and applied in the experiment. Each polybag is filled with 10 kg of soil. Initially, 6 kg of soil is added to the polybag, followed by the remaining 4 kg, where the required quantities of inputs are added according to the specified treatments. The organic inputs including farmyard manure, vermicompost, and ganajeevamruth, are calculated and applied based on the crop requirements, using a hectare basis for the application. The experiment was laid out in a complete randomized method (CRD) having 19 treatment combinations and replicated 5 times on a net packet as given in Table 1. 12 tons ha -1 of BC+ FYM+ GJ T19 Control Note: BC-Biochar, VC-Vermicompost, FYM-Farm yard manure, GJ-Ghanajeevamrutha Collection of soil samples: Soil samples at a plough layer depth (0-15 cm depth) were obtained from each of the experimental nineteen treatment pots after the crop's harvest.
| Treatments | Details |
|---|---|
| T1 | 8 tons ha-1 of BC |
| T2 | 10 tons ha-1 of BC |
| T3 | 12 tons ha-1 of BC |
| T4 | 8 tons ha-1 of BC+ FYM |
| T5 | 8 tons ha-1 of BC+ VC |
| T6 | 8 tons ha-1 of BC+ GJ |
| T7 | 8 tons ha-1 of BC+ FYM+ VC |
| T8 | 8 tons ha-1 of BC+ FYM+ GJ |
| T9 | 10 tons ha-1 of BC+ FYM |
| T10 | 10 tons ha-1 of BC+ VC |
| T11 | 10 tons ha-1 of BC+ GJ |
| T12 | 10 tons ha-1 of BC+ FYM+ VC |
| T13 | 10 tons ha-1 of BC+ FYM+ GJ |
| T14 | 12 tons ha-1 of BC+ FYM |
| T15 | 12 tons ha-1 of BC+ VC |
| T16 | 12 tons ha-1 of BC+ GJ |
| T17 | 12 tons ha-1 of BC+ FYM+ VC |
| T18 | 12 tons ha-1 of BC+ FYM+ GJ |
| T19 | Control |
Table text extracted from the original PDF; superscript letters are shown inline. The original table image is below.
View original table image
The samples obtained were dried in shade, ground with a pestle and mortar and passed through 2 mm sieve, and placed in polythene bags. 1.59 DTPA Zn (mg kg -1 ) 0.48 DTPA Fe (mg kg -1 ) 5.10 Cu (mg kg -1 ) 0.14 Mn (mg kg -1 )
The soil samples collected initially (Table 2) and after the harvest of field bean were analysed for physical and chemical characteristics employing standard methods of analysis.
| Parameters | Values |
|---|---|
| Sand % | 61.55 |
| Silt % | 21.50 |
| Clay % | 16.80 |
| Textural class | Sandy loam |
| Bulk density (Mg m-3) | 1.44 |
| Maximum water holding capacity (%) | 34.26 |
| Soil pH | 7.17 |
| Electrical conductivity (ds m-1) | 0.10 |
| Organic carbon (%) | 0.44 |
| Available Nitrogen (kg ha-1) | 254.30 |
| Available Phosphorus (kg ha-1) | 31.43 |
| Available Potassium (kg ha-1) | 155.72 |
| Available Sulphur (mg kg-1) | 14.55 |
| Exchangeable Calcium (c mol (p+) kg-1) | 3.38 |
| Exchangeable Magnesium (c mol (p+) kg-1) | 1.59 |
| DTPA Zn (mg kg-1) | 0.48 |
| DTPA Fe (mg kg-1) | 5.10 |
| Cu (mg kg-1) | 0.14 |
| Mn (mg kg-1) | 3.00 |
Table text extracted from the original PDF; superscript letters are shown inline. The original table image is below.
View original table image
Methodology adopted to determine physical properties of soil after harvest of field bean
Bulk density (Mg m-3) after the harvest: Bulk density (BD) was determined by using Keen's cup method with principle that the soil being saturated gives bulk density of soil given by Piper (1966) [35] . The inner diameter of Keen's cup was measured. At the bottom of Keen's cup filter paper was placed and weight of filter paper and Keen's cup was recorded. Soil was placed up to the brim of cup and weighed again. Later the cup was placed in a trough of water for saturation for about 24 hours. After saturation, excess water was drained out and weight of saturated soil was recorded.
The saturated soil was kept in oven at 105°C for drying. The bulk density was calculated using the following formula.
Water holding capacity (WHC) Keen's box method (Piper 1966) [35] was followed for determination of Water holding capacity of soil samples. In this method weight of empty keen box and filter paper was taken by electronic balance and the weighted filter paper was kept in the keens box followed by filling of keens box tightly with the 2 mm sieved soil. Then the keen box was kept over water up to a mark of its soil level for overnight. In the next day the soil of keen box become saturated and the weight of keen box with saturated soil sample was noted and kept in hot air oven for 48 hours at constant temperature of 105°C. The water holding capacity of soil was determined by the following calculation method.
The soil pH was determined in soil: water (1: 2.5) suspensions using digital pH meter with glass electrode (Jackson, 1973) [19] . The electrical conductivity of soil was determined using clear extract of soil: water suspension using conductivity bridge (Jackson, 1973) [19] . Organic carbon (%): The dry soil samples were powdered using pestle and mortar and passed through 0.2 mm sieve. A known weight of finely powdered sample was treated with excess known volume of standard K2Cr2O7 and concentrated H2SO4.The unused K2Cr2O7 was quantified by back titration with standard ferrous ammonium sulphate using ferroin as an indicator (Jackson, 1973) [19] . Available nitrogen: Available nitrogen was determined by macro distillation of the sample following alkaline permanganate method as suggested by Subbiah and Asija (1956) [43] . Available phosphorus: Available phosphorus was extracted with Bray's No.1 extractant (0.03 N NH4F + 0.025 N HCl). The phosphorus in the extract was determined by chloro stannous reduced molybdo phosphoric blue colour method in HCl acid medium. The intensity of blue colour was read at 660 nm using a spectrophotometer (Bray and Kurtz, 1945) [5] . Available potassium: Available potassium was determined flame photometrically after extracting the soil with neutral normal ammonium acetate (Jackson, 1973) [19] and calcium and magnesium in the digested plant materials were determined by versenate titration method as outlined by Piper (1966) [35] . Available sulphur: Sulphur in the digested plant materials was determined turbido metrically. The intensity of turbidity was measured using spectrophotometer at 420 nm of wavelength as outlined by Piper (1966) [35] . DTPA extractable micronutrients: The method developed by Lindsay and Norwell using DTPA extractant (Diethylene triamine penta acetic acid) was followed for the estimation of Zn, Cu, Mn and Fe. Ten grams of soil was shaken with 20 ml of DTPA extractant for 2 hours for the extraction of micronutrient cations. Atomic absorption spectrophotometer with appropriate hallow cathode lamp was used for measuring the concentration. 3.6 Preparation of plant samples the plant samples obtained from the crop were dried powdered and examined for macronutrients (N, P, K, Ca, Mg, and S) and micronutrients (Fe, Zn, Mn and Cu).
Methodology employed for plant sample analysis
Nitrogen (%): 0.5 grams of plant samples were digested with conc. sulphuric acid (H2SO4) and digestion mixture (K2SO4: CuSO4.5H2O: selenium in the ratio of 100:20:1) until green residue was collected.
The digested content was distilled by the Micro Kjeldhal. The ammonia produced was trapped in boric acid (H3BO4) and was then measured by titrating against standardized sulphuric acid (Piper, 1966) [35] . Digestion of plant samples for nutrients estimation One gram of the dried and ground samples was pre-digested with 10 ml HNO3 (62%) for 24 hours, then digested in a vacuumed chamber at 85°C on sand bath with the following steps: the pre-digested samples were treated with 10 ml di-acid mixture reagent (HNO3 + HClO4 at a ratio of 10:4) and held on sand bath until white precipitate was left in the bottom. After filtration, the digested samples were diluted with distilled water and volume formed to a defined concentration. Using normal techniques this extract was used to estimate P, K, Ca, Mg and micronutrients (Fe, Cu, Mn, and Zn). Phosphorus (%): The measurement of phosphorus content in plant by vanodo molybdo phosphoric yellow colour method (Piper, 1966) [35] was rendered using a suitable aliquot of the extracted sample. Potassium (%): The plant samples were tested for potassium content by feeding the diacid digested samples to the flame photometer (Piper, 1966) [35] after diluting it to appropriate concentration. 3.6.1.5 Calcium and magnesium (%) As described by Piper (1966) [35] , the di-acid digested plant samples were tested for calcium and magnesium using versenate titration process. Sulphur (%): In di-acid digested plant sample, sulphur was measured by using the process called turbidometry. The turbidity intensity produced in the sample was calculated at 420 nm wavelength using a spectrophotometer, as outlined by Piper (1966) [35] . Micronutrients (mg kg -1 ) content: Micronutrients (Zn, Cu, Mn and Fe) in plants were measured by feeding the digested extract samples after being diluted to an appropriate concentration of the Perkin Elmer atomic absorption spectrophotometer using correct hallow cathode lamps and presented as mg kg-1 in plant and seed samples (Jackson 1973) [19] . Uptake of Nutrients (kg ha -1 ) by field bean: The uptake of macronutrients (N, P, K, Ca, Mg and S) and micronutrients (Fe, Mn, Zn and Cu) by field bean was calculated after the analysis of nutrients concentrations in plant. For the calculation of the uptake the concentration of each nutrient in plant are multiplied with their respective dry biomass. The formula below is used to measure the nutrient uptake for macro and micro nutrients Functional parameter of photosynthetic apparatus:
The parameters were measured at different stages of plant growth of field bean. SPAD chlorophyll meter reading (SCMR): A nondestructive method of estimation of chlorophyll content was carried out using SPAD-502 (Konica Minolta). The values obtained from the difference in the transmission of red light (650nm) and far-red light (940 nm) through the plant leaf transmission is proportional to the chlorophyll content in the leaf. Red light is absorbed by the chlorophyll. The measurement was done during vegetative stage at 45 DAS and reproductive stage at 85 DAS on the midrib's alternate sides on the fully expanded leaf. While taking the observations midrib was avoided.
Statistical analysis of data
The comparative study of experimentally collected results was carried out by implementing Fisher's system of measurement of variance. The significance level used in the' F' evaluation was offered at 5 per cent. Critical difference (CD) values are presented at a significance level of 5 per cent in the table, wherever the 'F' measure was found to be relevant at 5 per cent.
Results and Discussion
The study highlights the significant impact of biocharamendment combinations on soil properties after field bean harvest and nutrient uptake of field bean.
Effect of paddy straw biochar on physical properties of soil after harvest
Soil porosity was found highest in T 16 (61.53%), which received 12 t ha -1 BC + FYM + VC, and was on par with T 18 , receiving 12 t ha-1 BC + FY+ GJ (61.06%) and lowest value of 45.83% was observed in control treatment. The application of biochar has significantly influenced the soil's bulk density, maximum water holding capacity and porosity. Among all the experimental treatments T 17 , receiving 12 t ha -1 of biochar + FYM + VC exhibited the lowest bulk density and the highest water holding capacity and porosity (Table 3). This may be due to the reason that the porous nature of biochar plays a crucial role in influencing both soil water retention and adsorption capabilities, as noted by previous studies (Day et [10,32,52] similarly observed this trend in their research, with bulk density decreasing from 1.47 to 1.44 Mg m -3 and porosity increasing from 0.43 to 0.44 m -3 . Adekiya et al. (2018) [2] also obtained comparable results, showing a decrease in bulk density following the addition of biochar along with organic manure.
| Treatment details | MWH (%) | BD (Mg m-3) | Porosity (%) |
|---|---|---|---|
| T1: 8 tons ha-1 of BC | 36.74 | 1.39 | 55.73 |
| T2: 10 tons ha-1 of BC | 36.61 | 1.40 | 60.56 |
| T3: 12 tons ha-1 of BC | 36.56 | 1.36 | 57.85 |
| T4: 8 tons ha-1 of BC+ FYM | 37.87 | 1.40 | 51.54 |
| T5: 8 tons ha-1 of BC+ VC | 37.04 | 1.39 | 47.84 |
| T6: 8 tons ha-1 of BC+ GJ | 36.38 | 1.39 | 52.49 |
| T7: 8 tons ha-1 of BC+ FYM+ VC | 40.05 | 1.38 | 51.25 |
| T8: 8 tons ha-1 of BC+ FYM+ GJ | 38.67 | 1.38 | 53.77 |
| T9: 10 tons ha-1 of BC+ FYM | 40.18 | 1.37 | 52.31 |
| T10:10 tons ha-1 of BC+ VC | 39.12 | 1.38 | 60.73 |
| T11: 10 tons ha-1 of BC+ GJ | 36.08 | 1.39 | 60.84 |
| T12: 10 tons ha-1 of BC+ FYM+ VC | 40.88 | 1.36 | 54.36 |
| T13: 10 tons ha−1 of BC+ FYM+ GJ | 39.20 | 1.39 | 58.02 |
| T14: 12 tons ha-1 of BC+ FYM | 40.02 | 1.36 | 57.99 |
| T15: 12 tons ha-1 of BC+ VC | 39.36 | 1.37 | 55.05 |
| T16: 12 tons ha-1 of BC+ GJ | 38.20 | 1.37 | 54.80 |
| T17: 12 tons ha-1 of BC+ FYM+ VC | 43.26 | 1.34 | 61.53 |
| T18: 12 tons ha-1 of BC+ FYM+ GJ | 41.21 | 1.36 | 61.06 |
| T19: Control | 34.89 | 1.43 | 45.83 |
| S. Em± | 0.29 | 0.01 | 0.53 |
| C.D@5% | 0.81 | 0.03 | 1.51 |
Table text extracted from the original PDF; superscript letters are shown inline. The original table image is below.
View original table image
Effect of paddy straw biochar on chemical properties of soil after harvest
The application of varying levels of biochar did not result in significant differences in the soil pH and EC but, there will be a significant difference in Organic carbon of soil after the field bean harvest. The highest concentrations of organic carbon in the soil were observed in T 17 (0.57%), where a dose of 12 t ha -1 of biochar was applied in combination with FYM and VC and the lowest organic carbon level of 0.46% was found in control treatment (T 19 ) (Table 4). In the current study, it was noted that the use of increased biochar dosages resulted in increased pH levels, consistent with the findings of Masud et al. in 2014 [26] . Their study similarly reported that when biochar was applied at a lower rate (20 g/L), it had no significant impact on soil pH. Furthermore, increasing the application rate to 80 g/L resulted in the biochar-treated soils maintaining a higher pH compared to the control soils, indicating that biochar could potentially act as a pH buffer for the soil. Nigussie et al. (2012) [31] noted that the incorporation of biochar into soil resulted in increased soil pH due to the accumulation of ash. They elaborated that the ash residues primarily consisted of carbonates of alkali and alkali earth metals. Additionally, Zwieten et al. (2010) [55] emphasized that the introduction of biochar into the soil could raise its pH levels, attributing this phenomenon to the liming effect of biochar. It is noteworthy that the application of biochar resulted in a slight increase in soil EC. This observation aligns with previous studies, such as Raison (1979) [36] , who also reporte d similar increases in soil EC following biochar application. These increases are generally attributed to factors such as alkali carbonates, silica content, phosphates, and minor quantities of both organic and inorganic nitrogen, as elucidated by Raison (1979) [36] . Similar results were also reported by Khanna et al. (1994) [21] . The significant increase in Soil Organic Carbon (SOC), a crucial indicator of soil fertility, observed in our analysis can be primarily attributed to the rich carbon content present in the organic inputs (Dai et al., 2017) [9] . The inherent biochemical stability of biochar likely plays a role in stabilizing the SOC pool. Biochar is often regarded as an exceptionally stable component within SOC, exerting direct and indirect influences on SOC dynamics. Numerous studies have demonstrated that, in the short term (less than 3 years), the application of biochar to soil leads to a rise in total soil carbon (Yilmaz et al., 2020) [51] . Effect of paddy straw biochar on soil nitrogen, phosphorus and potassium after harvest Available nitrogen, phosphorus and potassium content in soil varied significantly due to the influence of combination of biochar and organic amendments. The highest nitrogen (274.50 kg ha -1 ), phosphorus (43.62 kg ha -1 ) and potassium (175.06 kg ha -1 ) availability was observed when biochar was applied at a higher dose along with organic inputs, in T 17 , receiving 12 t ha -1 biochar in combination with FYM and VC. The lowest available nitrogen (245.21 kg ha -1 ) phosphorus ( 27.70 kg ha -1 ) and potassium (144.66 kg ha -1 ) was observed in absolute control treatment (Table 5)
| Treatment details | N (kg ha-1) | P(kg ha-1) | K (kg ha-1) |
|---|---|---|---|
| T1: 8 tons ha-1 of BC | 258.96 | 35.18 | 161.82 |
| T2: 10 tons ha-1 of BC | 260.55 | 37.52 | 166.15 |
| T3: 12 tons ha-1 of BC | 261.49 | 36.07 | 164.23 |
| T4: 8 tons ha-1 of BC+ FYM | 260.92 | 35.64 | 164.92 |
| T5: 8 tons ha-1 of BC+ VC | 262.49 | 35.02 | 163.30 |
| T6: 8 tons ha-1 of BC+ GJ | 260.32 | 34.22 | 161.97 |
| T7: 8 tons ha-1 of BC+ FYM+ VC | 266.67 | 37.24 | 166.93 |
| T8: 8 tons ha-1 of BC+ FYM+ GJ | 263.55 | 35.22 | 164.88 |
| T9: 10 tons ha-1 of BC+ FYM | 261.78 | 37.90 | 166.98 |
| T10:10 tons ha-1 of BC+ VC | 259.09 | 34.23 | 165.40 |
| T11: 10 tons ha-1 of BC+ GJ | 259.01 | 36.17 | 164.59 |
| T12: 10 tons ha-1 of BC+ FYM+ VC | 265.01 | 39.10 | 171.10 |
| T13: 10 tons ha−1 of BC+ FYM+ GJ | 263.59 | 37.38 | 167.18 |
| T14: 12 tons ha-1 of BC+ FYM | 262.17 | 41.36 | 170.21 |
| T15: 12 tons ha-1 of BC+ VC | 263.93 | 39.02 | 168.71 |
| T16: 12 tons ha-1 of BC+ GJ | 257.58 | 37.35 | 165.41 |
| T17: 12 tons ha-1 of BC+ FYM+ VC | 274.50 | 43.62 | 175.06 |
| T18: 12 tons ha-1 of BC+ FYM+ GJ | 270.88 | 40.90 | 172.44 |
| T19: Control | 245.21 | 27.70 | 144.66 |
| S. Em± | 2.17 | 0.81 | 1.11 |
| C.D@5% | 6.21 | 2.30 | 3.18 |
Table text extracted from the original PDF; superscript letters are shown inline. The original table image is below.
View original table image
| Treatment details | pH | EC (dS m-1) | OC(%) |
|---|---|---|---|
| T1: 8 tons ha-1 of BC | 7.34 | 0.14 | 0.49 |
| T2: 10 tons ha-1 of BC | 7.37 | 0.14 | 0.51 |
| T3: 12 tons ha-1 of BC | 7.46 | 0.15 | 0.48 |
| T4: 8 tons ha-1 of BC+ FYM | 7.42 | 0.15 | 0.50 |
| T5: 8 tons ha-1 of BC+ VC | 7.41 | 0.14 | 0.49 |
| T6: 8 tons ha-1 of BC+ GJ | 7.29 | 0.14 | 0.47 |
| T7: 8 tons ha-1 of BC+ FYM+ VC | 7.39 | 0.16 | 0.51 |
| T8: 8 tons ha-1 of BC+ FYM+ GJ | 7.46 | 0.13 | 0.52 |
| T9: 10 tons ha-1 of BC+ FYM | 7.44 | 0.15 | 0.50 |
| T10:10 tons ha-1 of BC+ VC | 7.39 | 0.13 | 0.47 |
| T11: 10 tons ha-1 of BC+ GJ | 7.36 | 0.15 | 0.49 |
| T12: 10 tons ha-1 of BC+ FYM+ VC | 7.49 | 0.16 | 0.52 |
| T13: 10 tons ha−1 of BC+ FYM+ GJ | 7.43 | 0.13 | 0.48 |
Table text extracted from the original PDF; superscript letters are shown inline. The original table image is below.
View original table image
The increase in available nitrogen can be attributed to the incorporation of biochar into the soil, which has been shown to enhance the presence of major cations and phosphorus. Furthermore, organic manure decomposition contributes to nutrient release into the soil. Biochar, known for its high adsorption capacity, plays a crucial role in altering nitrogen dynamics in the soil, as reported by Lehmann in 2007 [23] . It can sequester nitrogen through ion exchange, adsorb ammonia (NH3) and promote immobilization, thereby affecting the leaching of nitrate (NO3 -). During composting, biochar's adsorption of ammonia helps reduce losses of both NH3 and NO3 -. When combined with manure application, biochar acts as a nutrient adsorbent, offering a mechanism for gradual nutrient release to benefit plant growth. Additionally, research by Doan also demonstrates an increase in nitrogen content following the combined application of biochar and vermicompost. The increase in available phosphorus was due to the high concentrations of available P found in the biochar. Vassilev et al. (2013) [44] proposed that the nutrients present in biochar ash could stimulate the secretion of P-solubilizing acids by microorganisms. The elevation in soil-available phosphorus following the incorporation of organic manures may be attributed to various mechanisms, including the mineralization of organic phosphorus, the generation of organic acids with soil phosphorus-solubilizing properties, and the presence of organic amines that inhibit the fixation of phosphorus in the soil, as indicated in studies by Gupta et al. (1992) [16] and Narwal et al. (2005) [28] . The available K content of soil increased significantly with application of biochar and organic amendments.This increase was due to the high concentration of K found in the biochar (Chan et al., 2007; Abrol et al., 2016) [7,1] . The immediate beneficial effects of biochar additions on nutrient availability are largely due to higher potassium content (Lehmann et al., 2003) [22] .
Effect of paddy straw biochar on Ca, Mg and S of soil after harvest
The exchangeable calcium content and exchangeable magnesium content in the soil differs non-significantly between treatments while, available sulphur content in soil varied significantly due to the influence of combination of biochar and organic amendments, ranges from 13.82 to 18.34 mg kg-1. Among all treatments, significantly highest available sulphur (18.34 mg kg -1 ) noticed in treatment T 17 (12 t ha-1 biochar + FYM + VC) and it was on par with treatment T 18 (18.07 mg kg -1 ) receiving 12 t ha -1 biochar + FYM + GJ, whereas the lowest available sulphur (13.82 mg kg -1 ) was observed in control treatment as shown in Table 6. Sulphur content in soil varied significantly with application of different levels of biochar and organic inputs. This may be due the contribution of available sulphur to soil after the mineralization of organic sulphur in biochar. The results suggest that biochar also improves the bioavailability of sulphur; which mainly depends on mineralization of organic forms of sulphur (De Luca et al., 2009) [11] .
| Treatment details | Ca (c mol(p+) kg-1) | Mg (c mol(p+) kg-1) | S (mg kg-1) |
|---|---|---|---|
| T1: 8 tons ha-1 of BC | 3.64 | 1.64 | 15.57 |
| T2: 10 tons ha-1 of BC | 3.57 | 1.67 | 16.81 |
| T3: 12 tons ha-1 of BC | 3.69 | 1.67 | 17.10 |
| T4: 8 tons ha-1 of BC+ FYM | 3.60 | 1.66 | 16.01 |
| T5: 8 tons ha-1 of BC+ VC | 3.66 | 1.65 | 16.07 |
| T6: 8 tons ha-1 of BC+ GJ | 3.64 | 1.63 | 15.61 |
| T7: 8 tons ha-1 of BC+ FYM+ VC | 3.69 | 1.67 | 16.24 |
| T8: 8 tons ha-1 of BC+ FYM+ GJ | 3.67 | 1.65 | 16.12 |
| T9: 10 tons ha-1 of BC+ FYM | 3.70 | 1.68 | 17.00 |
| T10:10 tons ha-1 of BC+ VC | 3.70 | 1.67 | 16.91 |
| T11: 10 tons ha-1 of BC+ GJ | 3.68 | 1.65 | 16.85 |
| T12: 10 tons ha-1 of BC+ FYM+ VC | 3.74 | 1.69 | 17.07 |
| T13: 10 tons ha−1 of BC+ FYM+ GJ | 3.71 | 1.66 | 17.03 |
| T14: 12 tons ha-1 of BC+ FYM | 3.73 | 1.69 | 17.32 |
| T15: 12 tons ha-1 of BC+ VC | 3.72 | 1.67 | 17.29 |
| T16: 12 tons ha-1 of BC+ GJ | 3.69 | 1.66 | 17.17 |
| T17: 12 tons ha-1 of BC+ FYM+ VC | 3.81 | 1.71 | 18.34 |
| T18: 12 tons ha-1 of BC+ FYM+ GJ | 3.79 | 1.70 | 18.07 |
| T19: Control | 3.22 | 1.48 | 13.82 |
| S. Em± | 0.14 | 0.13 | 0.54 |
| C.D@5% | NS | NS | 1.53 |
Table text extracted from the original PDF; superscript letters are shown inline. The original table image is below.
View original table image
Effect of paddy straw biochar on DTPA extractable micronutrients of soil.
The application of varying levels of biochar did not result in significant differences in the manganese and copper content but, there will be a significant differences in DTPA extractable zinc and iron content of the soil after the field bean harvest (Table 7).
| Treatment details | Zn (mg kg-1) | Fe (mg kg-1) | Mn (mg kg-1) | Cu (mg kg-1) |
|---|---|---|---|---|
| T1: 8 tons ha-1 of BC | 0.52 | 5.37 | 3.06 | 0.15 |
| T2: 10 tons ha-1 of BC | 0.51 | 5.40 | 3.09 | 0.17 |
| T3: 12 tons ha-1 of BC | 0.55 | 5.46 | 3.10 | 0.15 |
| T4: 8 tons ha-1 of BC+ FYM | 0.53 | 5.43 | 3.04 | 0.16 |
| T5: 8 tons ha-1 of BC+ VC | 0.52 | 5.41 | 3.01 | 0.15 |
| T6: 8 tons ha-1 of BC+ GJ | 0.51 | 5.38 | 3.06 | 0.19 |
| T7: 8 tons ha-1 of BC+ FYM+ VC | 0.53 | 5.46 | 3.09 | 0.17 |
| T8: 8 tons ha-1 of BC+ FYM+ GJ | 0.50 | 5.44 | 3.07 | 0.18 |
| T9: 10 tons ha-1 of BC+ FYM | 0.55 | 5.45 | 3.10 | 0.18 |
| T10:10 tons ha-1 of BC+ VC | 0.53 | 5.43 | 3.12 | 0.17 |
| T11: 10 tons ha-1 of BC+ GJ | 0.54 | 5.41 | 3.01 | 0.15 |
| T12: 10 tons ha-1 of BC+ FYM+ VC | 0.62 | 5.63 | 3.11 | 0.18 |
| T13: 10 tons ha−1 of BC+ FYM+ GJ | 0.57 | 5.59 | 3.02 | 0.17 |
| T14: 12 tons ha-1 of BC+ FYM | 0.58 | 5.78 | 3.12 | 0.17 |
| T15: 12 tons ha-1 of BC+ VC | 0.63 | 5.73 | 3.11 | 0.14 |
| T16: 12 tons ha-1 of BC+ GJ | 0.60 | 5.66 | 3.09 | 0.17 |
| T17: 12 tons ha-1 of BC+ FYM+ VC | 0.69 | 5.97 | 3.15 | 0.22 |
| T18: 12 tons ha-1 of BC+ FYM+ GJ | 0.67 | 5.92 | 3.13 | 0.20 |
Table text extracted from the original PDF; superscript letters are shown inline. The original table image is below.
View original table image
The study observed an increase in soil zinc content following biochar application, however, no distinct trend was observed with varying application rates. This lack of a clear pattern could be attributed to the mineralization of zinc from organic matter and its release during the decomposition of organic manures. The rise in zinc content may be attributed to enhanced nutrient availability from the soil nutrient reservoir and the supplementary nutrient input provided by farmyard manure (Sharma and Dixit, 1987) [39] . The variation in micronutrient content in soil with the application of biochar can be attributed to their physical and chemical properties. Biochars by virtue of its high surface area, high metal affinity, higher nutrient retention capacity, presence of acidic and basic functional groups and ability to alkalize soil might result in immobilization of micronutrients in soil. Such of these mechanisms of metal immobilization due to biochar application were also reported by Park et al. (2011) [33] , Vithanage et al. (2014) [46] and Paz Ferreiro.
Effect of paddy straw biochar on macro nutrients uptake by field bean
The uptake of nitrigen, phosphorus and potassium by field bean showed significant difference among the treatments due to different levels of biochar application along with organic amendments. The highest recorded of nitrogen (44.33 kg ha -1 ), phosphorus (7.94 kg ha -1 ) and potassium (9.04 kg ha -1 ) uptake was notably significant in T 17 , which received 12 t ha-1 of biochar + FYM +VC (Table 8). Increased biochar application rates have consistently been associated with enhanced biomass production, leading to increaesed nutrient uptake. Chan et al. (2007) [7] and Zhao et al. (2014) [54] observed that higher levels of biochar led to increased nitrogen (N) uptake. Likewise, Angst and Sohi (2013) [3] and Yao et al. (2013) [50] found that primary nutrient bioavailability and plant uptake were augmented with biochar application, particularly when combined with added fertilizer. De Luca et al. (2009) [11] noted that when biochar was introduced to soil along with an organic nitrogen source, it not only boosted net nitrification but also improved nitrogen availability for plants. The addition of nutrient-enriched biochar resulted in a notable increase in soil pH, thereby enhancing the availability of phosphorus. These findings align with the research conducted by Milla et al. in 2013. It's important to note that nutrient uptake is influenced by both nutrient content and biomass production. The increased application rate of biochar led to a corresponding boost in biomass production, consequently augmenting nutrient uptake. This phenomenon has been corroborated by studies conducted by Angst and Sohi in 2013 [3] , Yao et al. in 2013 [50] , Eazhilkrishna et al. in 2017 [14] , and Xu et al. in 2014 [49] , all of which reported enhanced bioavailability and plant uptake of primary nutrients, especially when biochar was applied in combination with added fertilizers. Biochar contains soluble forms of potassium that are released shortly after being applied to soil, providing plants with readily available nutrients. When added to sandy loam soil, biochar not only boosts plant growth but also increases soil organic matter, cation exchange capacity (CEC), available phosphorus (P) and the levels of exchangeable magnesium (Mg), calcium (Ca) and potassium (K). Additionally, it enhances the uptake of potassium by plants, as demonstrated in the study by Saxena et al. in 2013 [38] . The uptake of calcium, magnesium and sulphur by field bean showed significant difference among the treatments due to different levels of biochar application along with organic amendments. The highest recorded of calcium (7.95 kg ha -1 ), magnesium (5.43 kg ha -1 ) and sulphur (7.39 kg ha - 1 ) uptake was notably significant in T 17 , which received 12 t ha-1 of biochar + FYM +VC. However, the lowest calcium, magnesium and sulphur uptake was recorded in control treatment T 19 (Table 9). The rise in calcium uptake could potentially be attributed to heightened biomass production. Likewise, it is evident that the application of calcium-rich biochar played a vital role in increasing calcium absorption. An increase in soil pH within acidic conditions may reduce aluminum's reactivity, subsequently promoting improved root growth and nutrient assimilation. Nutrient uptake is inherently influenced by both nutrient content and biomass production. The escalated biochar application rate directly contributed to an augmented biomass production, consequently leading to a notable enhancement in nutrient uptake. These findings align with those reported by Dagnija et al. (2018) [8] and Xu et al. (2014) [49] . The rise in magnesium uptake may be attributed to enhanced biomass production. Similarly, this increase could also be attributed to the utilization of biochar, which boasts a high magnesium content, thereby aiding in the augmentation of magnesium absorption. Increased pH levels in acidic soil may reduce aluminum activity, consequently promoting improved root growth and enhanced nutrient uptake. Nutrient absorption is contingent upon both nutrient levels and biomass production. These findings align with the research of Dagnija et al. (2018) [8] and Xu et al. (2014) [49] .
| Treatment details | Ca (kg ha-1) | Mg kg ha-1) | S (kg ha-1) |
|---|---|---|---|
| T1: 8 tons ha-1 of BC | 3.16 | 1.34 | 2.69 |
| T2: 10 tons ha-1 of BC | 3.11 | 1.85 | 3.19 |
| T3: 12 tons ha-1 of BC | 4.13 | 2.12 | 3.71 |
| T4: 8 tons ha-1 of BC+ FYM | 2.99 | 2.35 | 3.50 |
| T5: 8 tons ha-1 of BC+ VC | 3.39 | 2.60 | 3.05 |
| T6: 8 tons ha-1 of BC+ GJ | 2.76 | 1.86 | 2.85 |
| T7: 8 tons ha-1 of BC+ FYM+ VC | 4.13 | 3.96 | 3.76 |
| T8: 8 tons ha-1 of BC+ FYM+ GJ | 3.58 | 2.54 | 3.09 |
| T9: 10 tons ha-1 of BC+ FYM | 3.42 | 2.72 | 3.51 |
| T10:10 tons ha-1 of BC+ VC | 5.41 | 3.35 | 4.07 |
| T11: 10 tons ha-1 of BC+ GJ | 3.53 | 2.78 | 3.49 |
| T12: 10 tons ha-1 of BC+ FYM+ VC | 5.59 | 3.46 | 5.20 |
| T13: 10 tons ha−1 of BC+ FYM+ GJ | 4.43 | 3.00 | 4.59 |
| T14: 12 tons ha-1 of BC+ FYM | 5.28 | 4.18 | 5.40 |
| T15: 12 tons ha-1 of BC+ VC | 7.41 | 4.75 | 5.41 |
| T16: 12 tons ha-1 of BC+ GJ | 5.24 | 3.57 | 4.82 |
| T17: 12 tons ha-1 of BC+ FYM+ VC | 7.95 | 5.43 | 7.39 |
| T18: 12 tons ha-1 of BC+ FYM+ GJ | 6.72 | 5.06 | 6.97 |
| T19: Control | 2.67 | 1.16 | 2.10 |
| S. Em± | 0.15 | 0.10 | 0.08 |
| C.D@5% | 0.43 | 0.27 | 0.22 |
Table text extracted from the original PDF; superscript letters are shown inline. The original table image is below.
View original table image
| Treatment details | N (kg ha-1) | P (kg ha-1) | K (kg ha-1) |
|---|---|---|---|
| T1: 8 tons ha-1 of BC | 33.23 | 3.11 | 4.00 |
| T2: 10 tons ha-1 of BC | 31.89 | 2.66 | 5.06 |
| T3: 12 tons ha-1 of BC | 29.59 | 2.39 | 3.80 |
| T4: 8 tons ha-1 of BC+ FYM | 26.00 | 4.12 | 3.75 |
| T5: 8 tons ha-1 of BC+ VC | 31.79 | 3.67 | 5.15 |
| T6: 8 tons ha-1 of BC+ GJ | 25.43 | 2.33 | 3.34 |
| T7: 8 tons ha-1 of BC+ FYM+ VC | 35.27 | 5.17 | 4.58 |
| T8: 8 tons ha-1 of BC+ FYM+ GJ | 29.97 | 4.15 | 4.12 |
| T9: 10 tons ha-1 of BC+ FYM | 37.14 | 2.67 | 5.47 |
| T10:10 tons ha-1 of BC+ VC | 29.29 | 4.06 | 4.49 |
| T11: 10 tons ha-1 of BC+ GJ | 31.19 | 3.42 | 4.17 |
| T12: 10 tons ha-1 of BC+ FYM+ VC | 40.85 | 3.65 | 6.42 |
| T13: 10 tons ha−1 of BC+ FYM+ GJ | 32.23 | 3.79 | 5.25 |
| T14: 12 tons ha-1 of BC+ FYM | 34.44 | 2.79 | 5.65 |
| T15: 12 tons ha-1 of BC+ VC | 34.78 | 4.32 | 8.51 |
| T16: 12 tons ha-1 of BC+ GJ | 29.51 | 3.41 | 5.20 |
| T17: 12 tons ha-1 of BC+ FYM+ VC | 44.33 | 7.94 | 9.04 |
| T18: 12 tons ha-1 of BC+ FYM+ GJ | 41.26 | 6.69 | 6.39 |
| T19: Control | 22.13 | 1.81 | 3.00 |
| S. Em± | 1.19 | 0.19 | 0.17 |
| C.D@5% | 3.40 | 0.53 | 0.47 |
Table text extracted from the original PDF; superscript letters are shown inline. The original table image is below.
View original table image
Li demonstrated that chemolithotrophic bacteria are capable of thriving on the surfaces of small clusters of clay and iron nanoparticles. In this context, these microbes play a crucial role in enhancing the accessibility of sulphur and iron to plants. Furthermore, microorganisms have the ability to create biofilms on biochar surfaces, leading to the formation of corrosion cells, which subsequently boost the solubility of metal sulphate species. Effect of paddy straw biochar on uptake of micronutrients by field bean: Demonstrates a significant increase in zinc and iron uptake by field bean, whereas the co-application of biochar along with organic amendments did not show statistically significant variance in manganese and copper uptake among the various treatments. Specifically, treatment T 17 which received 12 t ha-1 biochar along with FYM exhibited the highest zinc (21.86 g ha-1) and iron (91.26 g ha-1), whereas lowest uptake was noticed in control treatment T 19 (Table 10). The total uptake of micronutrients viz., Fe, Mn, Zn and Cu by field bean varied significantly due to different levels of biochar application. Higher uptake of these micronutrients might be due to higher biomass production which was recorded due to higher doses of biochar. Lehmann et al. (2003) [22] noticed higher uptake of Zn and Cu by the plants with increased levels of biochar due to reduced leaching losses and increased fertilizer use efficiency. Similar findings were also reported by Antonio et al. (2013) [4] and Willis et al. (2016) [47] . The application of varying dosages of biochar has a significant impact on the physiological parameters of field beans. The SPAD (Soil Plant Analysis Development) index serves as an indicator of the plant's relative chlorophyll content. The results revealed that during the vegetative stages, there is no statistically significant effect observed in any of the treatments on the leaf SPAD value. However, this effect showed a positively significant one during the reproductive stages, as illustrated in Table 11. During the vegetative growth stage, there was relatively no significant difference in SPAD values. However, the highest value of 41.45 was observed in T 14 , which received 12 t ha -1 of biochar + FYM, and was on par with T 12 (40.21), receiving 10 t ha -1 BC + FYM + VC. During the reproductive growth stage, there was a gradual increase in SPAD values in higher application rates of biochar, along with other organic amendments. The highest recorded value was observed in treatment T 17 (37.44), where biochar applied at a rate of 12 t ha -1 in combination with FYM and VC, followed by T 12 (36.94), receiving 10 t ha -1 BC + FYM + VC. The lowest SPAD value of 26.09 was observed in absolute control treatment. SPAD values reduced from the vegetative phase to reproductive phase of Field bean which may be attributed to the diminished chlorophyll content in aging leaves that occurs during the reproductive phase. The findings indicated that the presence of both biochar and organic amendments led to higher chlorophyll content in field bean as compared to control. This improvement in chlorophyll content was attributed to the organic inputs, which enhanced nitrogen availability for plants during the late growth stage (Salehi et al., 2016) [37] . The increased leaf SPAD value observed during pod-filling likely contributed to sustained photosynthetic activity, thereby favourably promoting higher field bean yield. In Figure 4, a positive correlation between SPAD values and nitrogen content is observed (R 2=0.578). According to Dudeja and Chaudhary (2005) [13] , changes in chlorophyll content can be attributed to variations in soil nutrients. The presence of organic fertilizers has been shown to enhance soil nutrient levels, thereby impacting chlorophyll content. Chlorophyll plays a vital role in photosynthesis, facilitating the absorption of energy from light (Hikosaka et al., 2021) [18] . Interestingly, it was discovered that when biochar treatments were combined with organic inputs, the nitrogen content was notably higher compared to control. This showed that the co-application of biochar and organic inputs can effectively enhance soil nutrient availability, ultimately leading to increased chlorophyll content in plants.
| Treatment details | SPAD values at vegetative stage | SPAD values at reproductive stage |
|---|---|---|
| T1: 8 tons ha-1 of BC | 33.21 | 30.09 |
| T2: 10 tons ha-1 of BC | 38.85 | 33.60 |
| T3: 12 tons ha-1 of BC | 35.81 | 29.01 |
| T4: 8 tons ha-1 of BC+ FYM | 37.65 | 33.36 |
| T5: 8 tons ha-1 of BC+ VC | 36.63 | 29.32 |
| T6: 8 tons ha-1 of BC+ GJ | 37.62 | 33.22 |
| T7: 8 tons ha-1 of BC+ FYM+ VC | 39.36 | 36.06 |
| T8: 8 tons ha-1 of BC+ FYM+ GJ | 39.09 | 36.43 |
| T9: 10 tons ha-1 of BC+ FYM | 39.26 | 36.04 |
| T10:10 tons ha-1 of BC+ VC | 38.11 | 31.45 |
| T11: 10 tons ha-1 of BC+ GJ | 37.62 | 29.36 |
| T12: 10 tons ha-1 of BC+ FYM+ VC | 40.21 | 36.94 |
| T13: 10 tons ha−1 of BC+ FYM+ GJ | 37.23 | 35.92 |
| T14: 12 tons ha-1 of BC+ FYM | 41.45 | 33.20 |
| T15: 12 tons ha-1 of BC+ VC | 38.90 | 30.87 |
| T16: 12 tons ha-1 of BC+ GJ | 34.70 | 31.35 |
| T17: 12 tons ha-1 of BC+ FYM+ VC | 39.30 | 37.44 |
| T18: 12 tons ha-1 of BC+ FYM+ GJ | 38.00 | 36.40 |
| T19: Control | 28.14 | 26.09 |
| S. Em± | 4.85 | 4.36 |
| C.D@5% | NS | 12.26 |
Table text extracted from the original PDF; superscript letters are shown inline. The original table image is below.
View original table image
| T19: Control | 15.20 | 81.20 | 25.53 | 12.43 |
|---|---|---|---|---|
| S. Em± | 0.31 | 0.44 | 1.72 | 1.34 |
| C.D@5% | 0.90 | 1.25 | NS | NS |
Table text extracted from the original PDF; superscript letters are shown inline. The original table image is below.
View original table image
| Treatment details | Zn (g ha-1) | Fe (g ha-1) | Mn (g ha-1) | Cu (g ha-1) |
|---|---|---|---|---|
| T1: 8 tons ha-1 of BC | 17.35 | 85.95 | 32.98 | 14.75 |
| T2: 10 tons ha-1 of BC | 18.21 | 85.55 | 31.54 | 13.30 |
| T3: 12 tons ha-1 of BC | 17.58 | 88.20 | 29.61 | 15.01 |
| T4: 8 tons ha-1 of BC+ FYM | 16.86 | 85.85 | 32.12 | 15.08 |
| T5: 8 tons ha-1 of BC+ VC | 18.13 | 86.72 | 33.22 | 13.40 |
| T6: 8 tons ha-1 of BC+ GJ | 16.69 | 85.22 | 30.15 | 14.09 |
| T7: 8 tons ha-1 of BC+ FYM+ VC | 18.83 | 87.23 | 32.92 | 15.85 |
| T8: 8 tons ha-1 of BC+ FYM+ GJ | 17.51 | 85.17 | 31.38 | 13.12 |
| T9: 10 tons ha-1 of BC+ FYM | 18.32 | 85.69 | 30.72 | 15.39 |
| T10:10 tons ha-1 of BC+ VC | 20.87 | 87.60 | 31.82 | 14.00 |
| T11: 10 tons ha-1 of BC+ GJ | 17.22 | 83.69 | 30.06 | 13.48 |
| T12: 10 tons ha-1 of BC+ FYM+ VC | 21.20 | 87.15 | 28.07 | 14.66 |
| T13: 10 tons ha−1 of BC+ FYM+ GJ | 18.44 | 84.86 | 29.13 | 14.32 |
| T14: 12 tons ha-1 of BC+ FYM | 21.12 | 86.98 | 33.45 | 15.70 |
| T15: 12 tons ha-1 of BC+ VC | 20.53 | 83.71 | 31.37 | 15.77 |
| T16: 12 tons ha-1 of BC+ GJ | 18.27 | 83.70 | 30.87 | 13.74 |
| T17: 12 tons ha-1 of BC+ FYM+ VC | 21.86 | 91.26 | 36.16 | 17.62 |
| T18: 12 tons ha-1 of BC+ FYM+ GJ | 20.59 | 89.70 | 32.81 | 16.00 |
Table text extracted from the original PDF; superscript letters are shown inline. The original table image is below.
View original table image
Correlation between SPAD value and Nitrogen content of plant
Correlation between SPAD value and Nitrogen content of plant
Conclusion
The integration of paddy straw biochar at 12 t ha⁻¹ with farmyard manure (FYM) and vermicompost (T 17 ) demonstrated a substantial enhancement in soil chemical characteristics and nutrient uptake by field bean compared to the control. Notably, soil pH and electrical conductivity remained stable, indicating that this organic amendment strategy does not adversely affect these parameters. Integrated use of biochar with organic manures (FYM + vermicompost) is an effective strategy for improving soil fertility and plant nutrition. Enhancements in soil organic matter and nutrient availability directly translate into improved nutrient uptake by field bean. This sustainable management practice holds potential for boosting crop productivity and soil health in low-input agricultural systems. Future studies should focus on the long-term impacts of these combinations, particularly in terms of soil carbon sequestration, microbial diversity and nutrient cycling, to further optimize agricultural practices for environmental sustainability.
Figures and tables from the paper
References
55 in the original paper- Abrol V, Ben-Hur M, Vehreijen FGA, Keizer JJ, Martins MAS, Tenaw H, et al. Biochar effects on soil water infiltration and erosion under seal formation conditions; rainfall simulation experiment. J Soils Sediments. 2016;16(12):2709-2719.
- Adekiya AO, Agbede TM, Aboyeji CM, Dunsin O, Simeon VT. Biochar and poultry manure effects on soil properties and radish (Raphanus sativus L.) yield. Biol Agric Hortic. 2018;1:1-18.
- Angst TE, Sohi SP. Establishing release dynamics for plant nutrients from biochar. GCB Bioenergy. 2013;5:221-226.
- Antonio JA, Pablo S, Vidal B, Jose T, Maria-del CC, Antonio G, et al. Enhanced wheat yield by biochar addition under different mineral fertilization levels. Agron Sustainable Development. 2013;33:475-490.
- Bray RH, Kurtz LT. Determination of total, organic and available forms of phosphorus in soils. Soil Sci. 1945;59(1):39-46.
- Bruun E, Cross A, Hammond J, Nelissen V, Rasse DP, Hauggaard-Nielsen H. Biochar carbon stability and effect on greenhouse gas emissions. In: Biochar in European soils and agriculture. Routledge; 2016. p. 187-205.
- Chan KY, Van Zwieten L, Meszaros I, Downie A, Joseph S. Agronomic values of green-waste biochar as a soil amendment. Aust J Soil Res. 2007;45:629-634.
- Dagnija V, Lelde GL, Galina M, Raimonds K, Turs S, Vilhelmine S, et al. The impact of wood derived biochar on the survival of Trichoderma spp. and growth of Secale cereale L. in sandy soil. Biocontrol Sci Tech. 2018;28(4):341-358.
- Dai Z, Zhang X, Tang C, Muhammad N, Wu J, Brookes PC, et al. Potential role of biochar in decreasing soil acidification-a critical review. Sci Total Environ. 2017;581:601-611.
- Day D, Evans RJ, Lee JW, Reicosky D. Economical CO₂, SOx, and NOx capture from fossil-fuel utilization with combined renewable hydrogen production and large-scale carbon sequestration. Energy. 2005;30(14):2558-2579.
- De Luca TH, Mackenzie MD. Biochar effects on soil nutrient transformations. In: Lehmann J, Joseph S, editors. Biochar for environmental management science and technology. London: Earthscan; 2009. p. 72-87.
- Northern Vietnam: a three year mesocosm experiment. Sci Total Environ. 2015;514:147-154.
- Dudeja SS, Chaudhary P. Fast chlorophyll fluorescence transient and nitrogen fixing ability of chickpea nodulation variants. Photosynthetica. 2005;43(2):253259.
- Eazhilkrishna N, Thilagavathi T, Baskar M. Ecofriendly utilization of nutrient enriched biochar from sugar industry wastes and its effect on yield and NPK uptake by hybrid maize grown in vertisol. Int J Agric Sci. 2017;9(31):4456-4459.
- Gul S, Whalen JK, Thomas BW, Sachdeva V, Deng H. Physico-chemical properties and microbial responses in biochar-amended soils: mechanisms and future directions. Agric Ecosyst Environ. 2015;206:46-59.
- Gupta AP, Narwal RP, Antil RS, Dev S. Sustaining soil fertility with organic-C, N, P and K by using farmyard manure and fertilizer-N in a semi-arid zone: A longterm study. Arid Soil Res Rehabil. 1992;6:243-251.
- Hasler K, Bröring S, Omta SWF, Olfs HW. Life cycle assessment (LCA) of different fertilizer product types. Eur J Agron. 2015;69:41-51.
- Hikosaka K, Tsujimoto K. Linking remote sensing parameters to CO₂ assimilation rates at a leaf scale. J Plant Res. 2021;134(4):695-711.
- Jackson ML. Soil chemical analysis. New Delhi: Prentice Hall of India; 1973. p. 485-486.
- Khan N, Clark I, Sanchez-Monedero MA, Shea S, Meier S, Bolan N. Maturity indices in co-composting of chicken manure and sawdust with biochar. Bioresour Technol. 2014;168:245-251.
- Khanna PK, Raison RJ, Falkiner RA. Chemical properties of ash derived from Eucalyptus litter and its effects on forest soils. For Ecol Manag. 1994;66:107125.
- Lehmann J, Kern DC, Glaser B, Woods WI. Amazonian dark earths: origin, properties and management. Netherlands: Kluwer Academic Publishers; 2003.
- Lehmann J. Bio-energy in the black. Front Ecol Environ. 2007;5(7):381-389.
- Li C, Xiong Y, Qu Z, Xu X, Huang Q, Huang G. Impact of biochar addition on soil properties and waterfertilizer productivity of tomato in semi-arid region of Inner Mongolia, China. Geoderma. 2018;331:100-108.
- Lindsay WL, Norvell WA. Development of a DTPA soil test for zinc, iron, manganese, and copper. Soil Sci Soc Am J. 1978;42(3):421-428.
- Masud MM, Jiu-yu LI, Ren-kou XU. Use of alkaline slag and crop residue biochars to promote base saturation and reduce acidity of an acidic ultisol. Pedosphere. 2014;24(6):791-798.
- Milla VO, Rivera E, Huang WJ, Chien CC, Wang YM. Agronomic properties and characterization of rice husk and wood biochars and their effect on the growth of water spinach in a field test. J Soil Sci Plant Nutr. 2013;13(2):251-266.
- Narwal RP, Antil RS. Integrated nutrient management in pearl millet-wheat cropping system. 2005.
- Nelissen V, Ruysschaert G, Abusi DM, Dhose T, Beuf KD, Albarri B. Impact of a woody biochar on properties of a sandy loam soil and spring barley during a twoyear field experiment. Eur J Agron. 2015;62:65-78.
- Nigussie A, Kissi E, Misaganaw M, Ambaw G. Effects of biochar application on soil properties and nutrient uptake of lettuces (Lactuca sativa) grown in polluted soils. Am-Eurasian J Agric Environ Sci. 2012;12(3):369-376.
- Ogawa M, Okimori Y, Takahashi F. Carbon sequestration by carbonization of biomass and forestation: Three case studies. Mitig Adapt Strateg Glob Chang. 2006;11:429-444.
- Park JH, Choppala GH, Bolan NS, Chung JW, Chuasavathi T. Biochar reduces the bioavailability and phytotoxicity of heavy metals. Plant Soil. 2011;348:439-451.
- Paz-Ferreiro J, Lu H, Fu S, Mendez A, Gasco G. Use of phytoremediation and biochar to remediate heavy metal polluted soils: a review. Solid Earth. 2014;5:65-75.
- Piper CS. Soil and plant analysis. Bombay: Hans Pub; 1966. p. 368-369.
- Raison RJ. Modification of the soil environment by vegetation fires, with particular reference to nitrogen transformation: A Review. Plant Soil. 1979;51:73-108.
- Salehi A, Tasdighi H, Gholamhoseini M. Evaluation of proline, chlorophyll, soluble sugar content and uptake of nutrients in the German chamomile (Matricaria chamomilla L.) under drought stress and organic fertilizer treatments. Asian Pac J Trop Biomed. 2016;6(10):886-891.
- Saxena J, Rana G, Pandey M. Impact of addition of biochar along with Bacillus sp. on growth and yield of French beans. Sci Hortic. 2013;162:351-356.
- Sharma RA, Dixit BK. Effect of nutrient application on rainfed soybean. J Indian Soc Soil Sci. 1987;35:452455.
- Speratti AB, Johnson MS, Sousa HM, Dalmagro HJ, Couto EG. Biochar feedstock and pyrolysis temperature effects on leachate: DOC characteristics and nitrate losses from a Brazilian Cerrado Arenosol mixed with agricultural waste biochars. J Environ Manage. 2018;211:256-268.
- Spokas KA, Koskinen WC, Baker JM, Reicosky DC. Impacts of woodchip biochar additions on greenhouse gas production and sorption/degradation of two herbicides in a Minnesota soil. Chemosphere. 2009;77(4):574-582.
- Kollapen J. Enhancing soil fertility with biochar amendments for improved rice growth in Sub-Saharan Africa. Int. J. Agric. Nutr. 2023;5(2):88-91. DOI: https://doi.org/10.33545/26646064.2023.v5.i2b.153
- Subbaiah AY, Asija GK. A rapid procedure for the estimation of available nitrogen in soils. Curr Sci. 1956;25:270-280.
- Vassilev N, Martos E, Mendes G, Martos V, Vassileva M. Biochar of animal origin: a sustainable solution to the global problem of high-grade rock phosphate scarcity. J Sci Food Agric. 2013;93:1799-1804.
- Vijay V, Shreedhar S, Adlak K, Payyanad S, Sreedharan V, Gopi G, et al. Review of large-scale biochar field-trials for soil amendment and the observed influences on crop yield variations. Front Energy Res. 2021;9:710766.
- Vithanage M, Rajapaksha AU, Zhang M, Thiele-Bruhn S, Lee SS, Ok YS. Acid-activated biochar increased sulfamethazine retention in soils. Environ Sci Pollut Res. 2014;22(3):1-12.
- Willis G, Moreblessing M, Farai M, Tonny P. Comparative short-term effects of sewage sludge and its biochar on soil properties, maize growth and uptake of nutrients on a tropical clay soil in Zimbabwe. J Integr Agric. 2016;15(6):1395-1406.
- Windeatt JH, Ross AB, Williams PT, Forster PM, Nahil MA, Singh S. Characteristics of biochars from crop residues: potential for carbon sequestration and soil amendment. J Environ Manage. 2014;146:189-197.
- Xu G, Wei LL, Sun JN, Shao HB, Chang SX. What is more important for enhancing nutrient bioavailability with biochar application into a sandy soil: Direct or indirect mechanism. Ecol Eng. 2014;52:119-124.
- Yao YB, Gao J, Chen Y, Yang L. Engineered biochar reclaiming phosphate from aqueous solutions: Mechanisms and potential application as a slow-release fertilizer. Environ Sci Technol. 2013;47:8700-8708.
- Yilmaz FI, Kurt S. The effects of biochar and vermicompost applications on some enzyme activities in rhizosphere root zone of corn (Zea mays L.) plant. C R Acad Bulg Sci. 2020;73(8):1177-1186.
- Yu XY, Ying GG, Kookana RS. Sorption and desorption of diuron in soils amended with charcoal. J Agric Food Chem. 2006;54:8545-8550.
- Zhang X, Wang H, He L, Lu K, Sarmah A, Li J, et al. Using biochar for remediation of soils contaminated with heavy metals and organic pollutants. Environ Sci Pollut Res. 2013;20:8472-8483.
- Zhao X, Wang J, Wang S, Xing G. Successive straw biochar application as a strategy to sequester carbon and improve fertility: A pot experiment with two rice/wheat rotations in paddy. Soil Plant Res. 2014;3(78):279-294.
- Zwieten VL, Kimber S, Morris S. Effect of biochar from slow pyrolysis of paper mill waste on agronomic performance and soil fertility. Plant Soil. 2010;327(12):235-246.
- Stewart CE, Zheng J, Botte J, Cotrufo MF. Cogenerated fast pyrolysis biochar mitigates greenhouse gas emissions and increases carbon sequestration in temperate soils. Glob Change Biol Bioenergy. 2013;5(2):153-164