
Research article · 2025 · Full text
International Journal of Agriculture and Food ScienceDietary patterns and anthropometric assessment of urban school-going children in Punjab
Volume 7(8) · Pages 1235–1240 · DOI: 10.33545/2664844x.2025.v7.i8l.697 ↗
Research areasChild Nutrition and Water AccessFood Security and Health in Diverse PopulationsObesity, Physical Activity, Diet
Abstract
Author-writtenThe present study assessed the dietary patterns and anthropometric measurements of urban school-going children (10-12 years) in Ludhiana district. A total of 400 children were surveyed, comprising 57.5% boys and 42.5% girls. Socio-economic profiling revealed that the majority (62.5%) belonged to the scheduled caste, 60.0% lived in nuclear families, and 58.0% were from low-income households. Most families (88.0%) followed a vegetarian diet, with wheat as the staple cereal, while rice, pulses, green leafy vegetables, and fruits were consumed infrequently. Milk, curd, buttermilk, and ghee formed the primary animal-origin foods. The consumption of protective foods such as fruits and green leafy vegetables was low, reflecting dietary imbalance. Anthropometric assessment showed that boys had significantly higher mean values than girls for height (129.27 cm vs. 123.45 cm; p
Summary
Source-checkedPlain-language reading of the full paper, prepared with AI and checked against the text. Each point links to the authors' own words.
Why it matters
- Optimal nutrition during the school-going years is critical for a child's physical health, cognitive development, and general well-being. View evidence ↗
- Urban environments often see a shift toward diets that are high in calories but low in nutrients, leading to a 'double burden' where undernutrition and overnutrition occur simultaneously. View evidence ↗
- Factors such as family structure, income, and parental education significantly influence what children eat and their resulting nutritional status. View evidence ↗
The question
- The study aimed to evaluate the dietary habits and physical growth measurements of urban school children aged 10 to 12 in the Ludhiana district of Punjab. View evidence ↗
What they did
- The researchers purposively selected eight schools across two blocks in the Ludhiana district for the study. View evidence ↗
- Dietary habits were measured using a food frequency questionnaire (FFQ) to track how often different food groups were consumed. View evidence ↗
- Physical status was assessed by recording height, weight, waist, and hip circumference, which were then used to calculate BMI and the waist-hip ratio. View evidence ↗
What they found
- The majority of the children surveyed belonged to scheduled castes (62.5%), lived in nuclear families (60.0%), and came from low-income households (58.0%). View evidence ↗
- Vegetarianism was predominant (88.0%), with wheat serving as the main staple, while fruits, pulses, and green leafy vegetables were eaten infrequently. View evidence ↗
- Dairy products were common, with 63.0% consuming buttermilk daily, 41.0% consuming buffalo's milk daily, and 68.0% regularly using desi ghee. View evidence ↗
- Boys had a significantly higher mean height (129.27 cm) than girls (123.45 cm). View evidence ↗
- The mean weight of boys (29.11 kg) was significantly higher than that of girls (29.08 kg). View evidence ↗
- Boys showed a significantly higher mean mid-upper arm circumference (21.09 cm) compared to girls (19.53 cm). View evidence ↗
- Boys had a significantly higher mean waist circumference (57.78 cm) than girls (55.95 cm). View evidence ↗
- The mean waist-to-hip ratio was significantly higher in boys (0.90) than in girls (0.86). View evidence ↗
- There was no significant difference in the mean Body Mass Index (BMI) between boys (15.64 kg/m²) and girls (14.59 kg/m²). View evidence ↗
What it means
- The authors conclude that while basic needs for cereals and milk are met, the irregular intake of fruits, vegetables, and pulses may compromise the children's overall nutritional adequacy. View evidence ↗
- The authors recommend targeted interventions to improve dietary diversity, noting that low income and landlessness negatively influence food choices. View evidence ↗
Visual summary
1 visualsIllustrations explain the paper; charts are replotted from the paper's own table values.
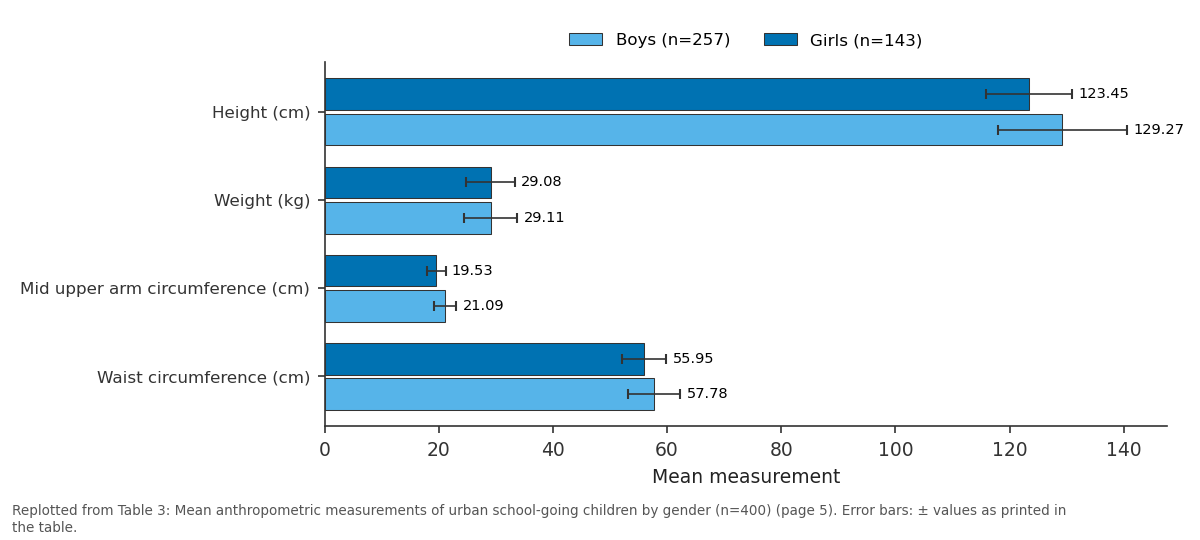
Boys (n=257) and Girls (n=143): Height (cm) vs Weight (kg) vs Mid upper arm... vs Waist circumference (cm)
Replotted from Table 3 (page 5) of the original paper. Every bar is the paper's own table value.
View source evidence ↗Figures & tables
From the original paper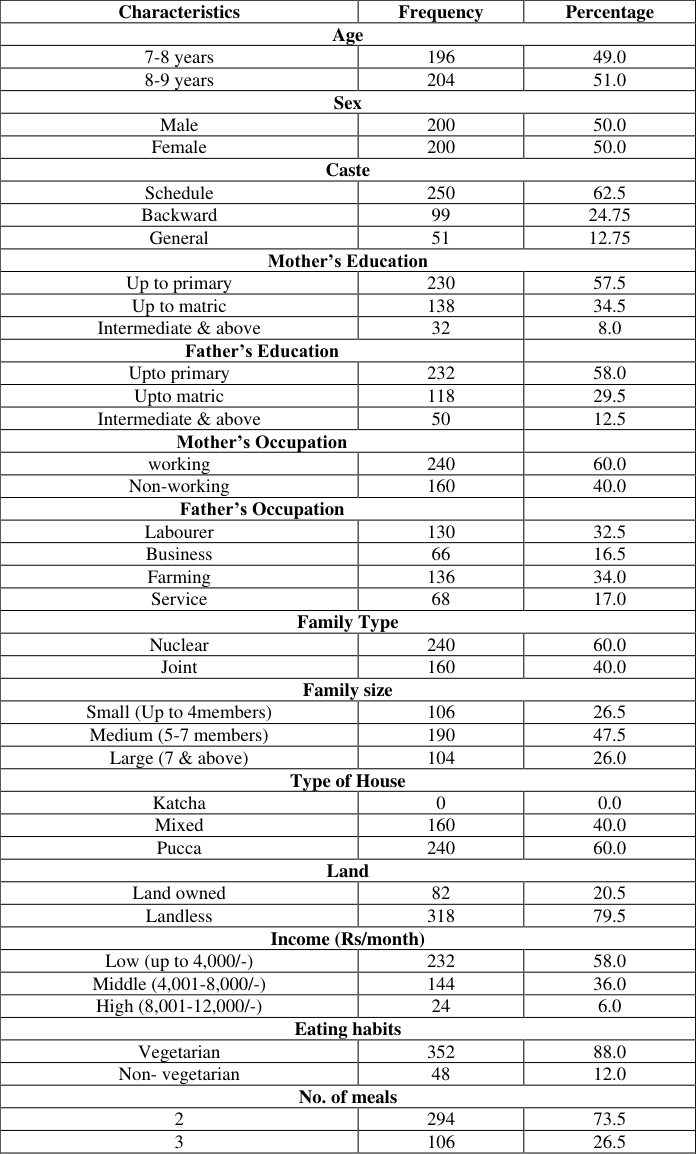 Table 1
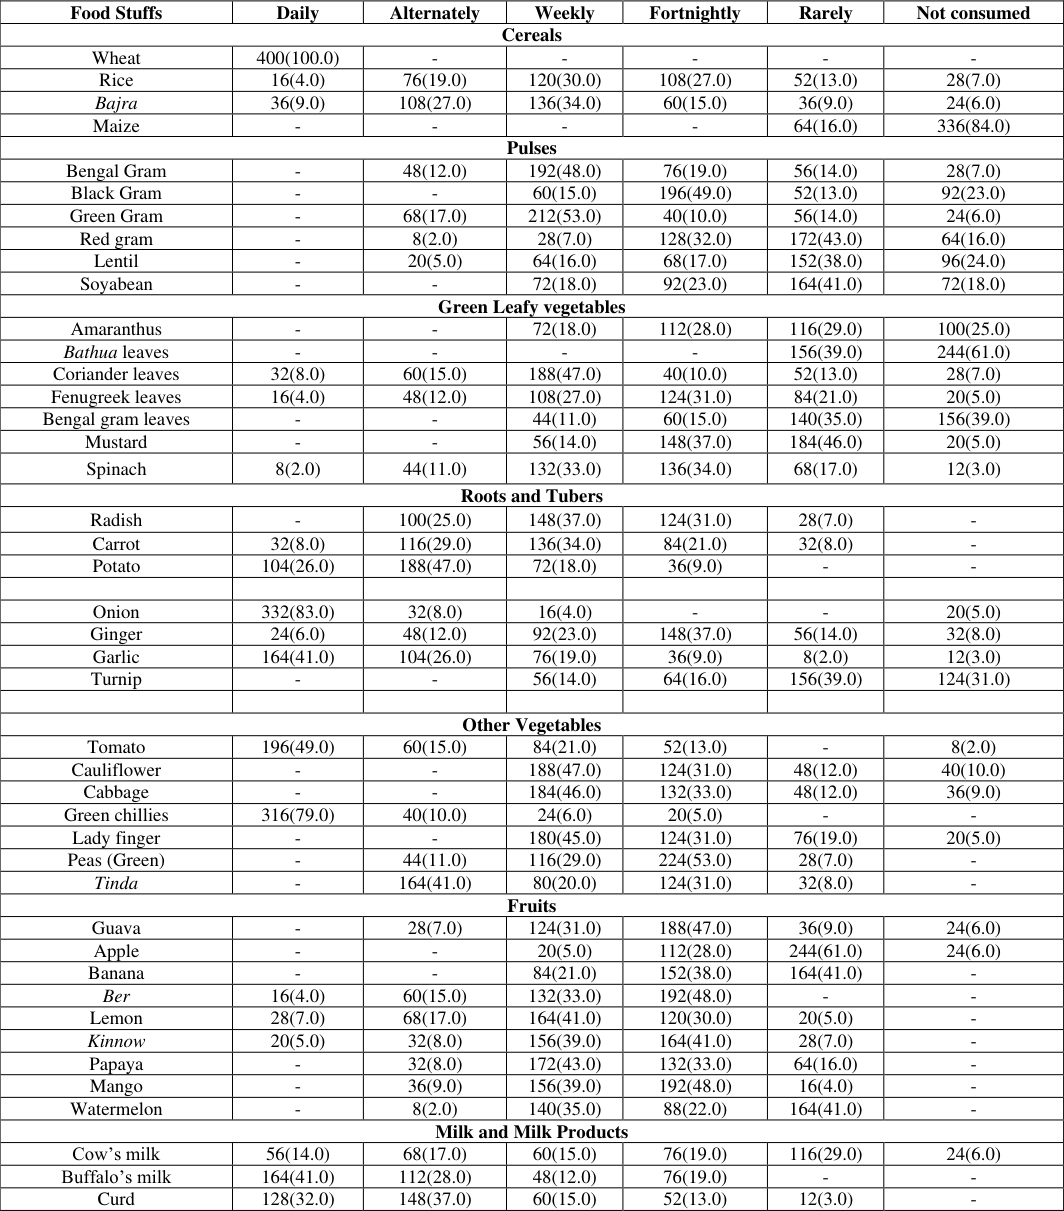 Table 2
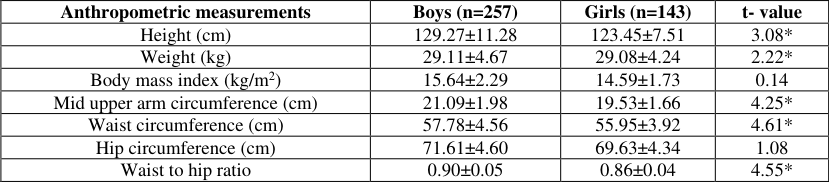 Table 3
Introduction
Children in the school-going age group represent a crucial phase of growth and development, where optimal nutrition plays a vital role in shaping their physical health, cognitive abilities, and overall well-being. Urbanization and lifestyle transitions have significantly influenced the dietary habits of children, leading to both positive and negative impacts on their nutritional status. While urban areas provide greater access to a wide variety of foods, they overweight and obesity in children. Regular assessment of anthropometric indices is therefore crucial to monitor growth trends and evaluate the prevalence of malnutrition in different forms. The double burden of malnutrition is increasingly evident in urban India. Khosla, et al. (2010) [9] reported that children from low-income families often suffer from undernutrition, reflected through stunting and wasting, while those from affluent families are more likely to face overweight and obesity. Socio-economic and demographic characteristics, including family structure, parental education, income levels, and occupation, are important determinants of dietary intake and nutritional outcomes. Children from low-income or landless families often experience limited dietary diversity, while those from higher-income groups may be more exposed to processed and high-fat foods. Thus, studying the interrelationship between dietary habits, socio-economic status, and anthropometric indicators offers a holistic understanding of children's nutrition. Behrman, (2022) [1] observed similar trends in developing countries, showing how socio-economic transitions influence child nutrition. Against this backdrop, the present study focuses on dietary patterns and anthropometric assessment of urban schoolgoing children. The findings are expected to provide valuable insights into the prevailing dietary behaviors, nutritional adequacy, and growth status of children, thereby highlighting areas for nutritional interventions, health education, and policy measures aimed at improving child health in urban India.
Methodology
The present study was undertaken to assess the dietary patterns, nutritional awareness, and anthropometric measurements of urban school-going children in Ludhiana district of Punjab state, which represents a typical urban setting with diverse socio-economic and cultural backgrounds. For the purpose of the study, two blocks from the Ludhiana district were purposively selected. From each selected block, four schools were chosen, resulting in a total of eight schools forming the study area.
Selection of Respondents
From each school, 50 students were randomly selected, making the total sample size400 respondents for the study. This ensured adequate representation of school-going children from the selected urban area.
Data Collection Methods
Both primary and secondary sources of data were used to conduct the study: 1. Primary Data: Collected through a structured survey administered to the respondents using pre-tested questionnaires.
Secondary Data:
Gathered from relevant literature including journals, books, research theses, government reports, magazines, newspapers, and reliable internet sources.
Data Collection Tools
To achieve the objectives of the study, the following tools were employed:
Results
Results
Personal and socio-economic profile of urban going school children
The personal and socio-economic characteristics of urban school-going children are presented in Table 1. Age-wise distribution showed that 49.0% of children were in the 10-11 years' group and 51.0% in the 11-12 years' group.
| Characteristics | Frequency | Percentage |
|---|---|---|
| Age | ||
| 7-8 years | 196 | 49.0 |
| 8-9 years | 204 | 51.0 |
| Sex | ||
| Male | 200 | 50.0 |
| Female | 200 | 50.0 |
| Caste | ||
| Schedule | 250 | 62.5 |
| Backward | 99 | 24.75 |
| General | 51 | 12.75 |
| Mother’s Education | ||
| Up to primary | 230 | 57.5 |
| Up to matric | 138 | 34.5 |
| Intermediate & above | 32 | 8.0 |
| Father’s Education | ||
| Upto primary | 232 | 58.0 |
| Upto matric | 118 | 29.5 |
| Intermediate & above | 50 | 12.5 |
| Mother’s Occupation | ||
| working | 240 | 60.0 |
| Non-working | 160 | 40.0 |
| Father’s Occupation | ||
| Labourer | 130 | 32.5 |
| Business | 66 | 16.5 |
| Farming | 136 | 34.0 |
| Service | 68 | 17.0 |
| Family Type | ||
| Nuclear | 240 | 60.0 |
| Joint | 160 | 40.0 |
| Family size | ||
| Small (Up to 4members) | 106 | 26.5 |
| Medium (5-7 members) | 190 | 47.5 |
| Large (7 & above) | 104 | 26.0 |
| Type of House | ||
| Katcha | 0 | 0.0 |
| Mixed | 160 | 40.0 |
| Pucca | 240 | 60.0 |
| Land | ||
| Land owned | 82 | 20.5 |
| Landless | 318 | 79.5 |
| Income (Rs/month) | ||
| Low (up to 4,000/-) | 232 | 58.0 |
| Middle (4,001-8,000/-) | 144 | 36.0 |
| High (8,001-12,000/-) | 24 | 6.0 |
| Eating habits | ||
| Vegetarian | 352 | 88.0 |
| Non- vegetarian | 48 | 12.0 |
| No. of meals | ||
| 2 | 294 | 73.5 |
| 3 | 106 | 26.5 |
Table text extracted from the original PDF; superscript letters are shown inline. The original table image is below.
View original table image
Among the 400 respondents, 57.5% were boys and 42.5% were girls. Caste distribution revealed that 62.5% belonged to the Scheduled Caste (SC), 24.75% to the Backward Class (BC), and 12.75% to the General category. Comparable findings were reported by Soni and Katoch (2024) [19] , who observed that 50%, 8%, 17%, and 25% of children in urban Himachal Pradesh belonged to SC, ST, OBC, and General categories, respectively. Family structure analysis indicated that 60.0% of respondents lived in nuclear families, while 40.0% were from joint families. Nearly half (47.5%) of the children were from medium-sized families, whereas 26.5% and 26.0% belonged to small and large families, respectively. Housing status showed that 60.0% of children lived in pucca houses and 40.0% in mixed houses. These results are in line with Katyal (2014) [8] , who also reported that 61% of children lived in nuclear families, while 39% were from joint families. However, Sati (2012) [21] found a higher proportion of children in joint families (55%) compared to nuclear families. Hans (2014) [7] and Katyal (2014) [8] similarly noted that the majority of children were from medium-sized families and lived in mixed-type houses. According to the National Nutrition Monitoring Bureau (2002), nearly twothirds of respondents lived in semi-pucca houses, with an average family size of five members; about 16% of families had children of fourth or higher birth order, while 37% were third or later born. Parental education status revealed that 57.5% of mothers had education up to primary level, 34.5% up to matric, and 8.0% up to intermediate. Among fathers, 34.0% were educated up to primary level, 29.5% up to matric, and 12.5% up to intermediate and above. Regarding occupation, 34.0% of fathers were engaged in agriculture, 32.5% in labor, 17.0% in service, and 16.5% in business. Among mothers, 60.0% were working, while 40.0% were housewives.
Landholding data revealed that 79.5% of families were landless, while 20.5% owned agricultural land. Family income distribution showed that 58.0% belonged to the lowincome group (≤ ₹4,000/month), 36.0% to the middleincome group (₹4,001-8,000), and only 6.0% to the highincome group (₹8,001-12,000). These findings are consistent with those of Sati (2012) [21] and Sultan, who also reported that the majority of families were landless and belonged to low-income groups. In contrast, Bhatia and Seshadri (2020) [2] found that 47% of urban families earned more than ₹8,000/month, while 13% had incomes between ₹4,000-6,000/month. Dietary habits indicated that the majority of families (88.0%) were vegetarian, while 12.0% were non-vegetarian. Most children (77.5%) consumed three meals per day, followed by those who consumed four meals daily. [18] reported that cereals were included in the daily diets of almost all children (99.5%). Sethi (2012) [3] also observed that most children in Sirsa district consumed green gram dal (68%), black gram dal (43%), Bengal gram dal (52%), and soybean (47%) weekly. Murugkar et al.
(2013) [12] similarly reported that 76 per cent of children consumed pulses on a weekly basis. Consumption of green leafy vegetables showed wide variation. Amaranthus was consumed rarely (29.0%) or fortnightly (28.0%), while 25.0 per cent. Did not consume it at all. Bathua leaves were avoided by 61.0 per cent, and consumed rarely by the remaining 39.0 per cent. Coriander was frequently used, with 47.0 per cent consuming it weekly, 15.0 per cent alternately, 13.0 per cent rarely, 10.0 per cent fortnightly, and 8.0 per cent daily. Fenugreek leaves were mostly consumed fortnightly (31.0%), followed by weekly (27.0%) and rarely (21.0%). Bengal gram leaves were not consumed by 39.0 per cent, while 35.0 per cent consumed them rarely. Mustard leaves were consumed rarely (46.0%) and fortnightly (35.0%). Spinach was taken fortnightly (34.0%) and weekly (33.0%). Similar observations were made by Eilander et al. (2010) [5] who reported weekly consumption of green leafy vegetables in most families. Roots and tubers formed another important group. Radish (37.0%) and carrot (34.0%) were consumed weekly by the majority. Potato was consumed alternately by 47.0 per cent and daily by 26.0 per cent. Onion was part of the daily diet for most respondents (83.0%). Ginger was consumed fortnightly (37.0%) and weekly (23.0%), while garlic was consumed daily (41.0%) and weekly (26.0%). Turnip was rarely consumed (39.0%), while 31.0 per cent did not consume it at all. Dudi and Punia (2009) [4] also reported potato and onion as the most commonly consumed food items. Katyal (2014) [8] similarly found that onion, potato, ginger, and garlic were consumed daily, while carrot and radish were eaten on alternate days or weekly. Among other vegetables, tomatoes were widely consumed 49.0 per cent daily and 21.0 per cent weekly. Cauliflower was consumed weekly (47.0%) and fortnightly (31.0%), while cabbage was taken weekly (46.0%) and fortnightly (33.0%). Green chillies were used daily by 79.0 per cent of respondents. Ladyfinger was consumed weekly (45.0%) and fortnightly (31.0%), whereas peas were mostly eaten fortnightly (53.0%). Tinda was consumed alternately (41.0%), fortnightly (31.0%), and weekly (20.0%).
Fruit consumption was limited and not part of the daily diet. Milk and milk products, however, were fairly common.
Cow's milk was consumed daily by 14.0 per cent of respondents. Similar findings were reported by Handa et al.
(2018) [6] , who found that fruits were mostly consumed once or twice a week. Buffalo's milk was consumed daily by 41.0 per cent, while buttermilk was taken daily by 63.0 per cent. Desi ghee formed a regular part of the diet for 68.0 per cent of respondents. Manu and Khetarpaul (2006) [11] also reported similar findings.
Mean anthropometric measurements of urban schoolgoing children by gender
The mean anthropometric measurements of urban schoolchildren (10-12 years) are summarized in Table 3 [20] almost observed similar values of height and weight. Sati and Dahiya (2017) [16] also reported similar range of height, weight and triceps in school children.
| Anthropometric measurements | Boys (n=257) | Girls (n=143) | t- value |
|---|---|---|---|
| Height (cm) | 129.27±11.28 | 123.45±7.51 | 3.08* |
| Weight (kg) | 29.11±4.67 | 29.08±4.24 | 2.22* |
| Body mass index (kg/m2) | 15.64±2.29 | 14.59±1.73 | 0.14 |
| Mid upper arm circumference (cm) | 21.09±1.98 | 19.53±1.66 | 4.25* |
| Waist circumference (cm) | 57.78±4.56 | 55.95±3.92 | 4.61* |
| Hip circumference (cm) | 71.61±4.60 | 69.63±4.34 | 1.08 |
| Waist to hip ratio | 0.90±0.05 | 0.86±0.04 | 4.55* |
Table text extracted from the original PDF; superscript letters are shown inline. The original table image is below.
View original table image
Waist-Circumference
The mean waist circumference of boys was 57.78 cm, whereas that of girls was 55.95 cm. Boys showed a significantly higher waist circumference compared to girls (p<0.01). Consistent with earlier reports (Kumari and [10,21,3,12] .
Hip-Circumference
The mean hip circumference was 71.61 cm for boys and 69.63 cm for girls. No significant difference was observed between the two groups. The results of present investigation are in accordance with those of earlier workers (Shah et al., 2003; Oninla et al., 2007; Patil and Wasnik 2009) [17,13,14] .
Waist-to-Hip-Ratio
The mean waist-to-hip ratio was 0.90 for boys and 0.86 for girls, with boys showing a significantly higher ratio than girls (p<0.01). The results of present investigation are in accordance with those of earlier workers (Kumari and Jain 2005; Divya Sethi 2012) [10,3] .
Conclusion
The study on the personal, socio-economic, dietary, and anthropometric profile of urban school-going children (10-12 years) revealed that the majority belonged to nuclear, medium-sized families, lived in pucca houses, and were primarily from Scheduled Caste backgrounds. Most families were landless and fell in the low-income category, with mothers largely educated up to the primary level and fathers engaged in agriculture or labor. Dietary habits reflected a predominance of vegetarianism, with wheat as the staple cereal and pulses consumed variably, while green leafy vegetables, roots, tubers, and fruits were less frequently included in the daily diet. Milk and milk products were more common, especially buttermilk and buffalo's milk, whereas desi ghee formed a regular part of the diet. Anthropometric assessment indicated that boys had significantly higher mean values for height, weight, MUAC, waist circumference, and waist-to-hip ratio compared to girls, though BMI and hip circumference showed no significant difference. These findings suggest that while children's basic dietary patterns ensured cereal and milk intake, inadequate and irregular consumption of pulses, vegetables, and fruits may affect their nutritional adequacy. The socio-economic constraints, particularly low family income and landlessness, appear to influence food choices and nutritional outcomes, highlighting the need for targeted interventions to improve dietary diversity and overall nutritional status of urban school-going children.
Figures and tables from the paper
| Food Stuffs | Daily | Alternately | Weekly | Fortnightly | Rarely | Not consumed |
|---|---|---|---|---|---|---|
| Cereals | ||||||
| Wheat | 400(100.0) | - | - | - | - | - |
| Rice | 16(4.0) | 76(19.0) | 120(30.0) | 108(27.0) | 52(13.0) | 28(7.0) |
| Bajra | 36(9.0) | 108(27.0) | 136(34.0) | 60(15.0) | 36(9.0) | 24(6.0) |
| Maize | - | - | - | - | 64(16.0) | 336(84.0) |
| Pulses | ||||||
| Bengal Gram | - | 48(12.0) | 192(48.0) | 76(19.0) | 56(14.0) | 28(7.0) |
| Black Gram | - | - | 60(15.0) | 196(49.0) | 52(13.0) | 92(23.0) |
| Green Gram | - | 68(17.0) | 212(53.0) | 40(10.0) | 56(14.0) | 24(6.0) |
| Red gram | - | 8(2.0) | 28(7.0) | 128(32.0) | 172(43.0) | 64(16.0) |
| Lentil | - | 20(5.0) | 64(16.0) | 68(17.0) | 152(38.0) | 96(24.0) |
| Soyabean | - | - | 72(18.0) | 92(23.0) | 164(41.0) | 72(18.0) |
| Green Leafy vegetables | ||||||
| Amaranthus | - | - | 72(18.0) | 112(28.0) | 116(29.0) | 100(25.0) |
| Bathua leaves | - | - | - | - | 156(39.0) | 244(61.0) |
| Coriander leaves | 32(8.0) | 60(15.0) | 188(47.0) | 40(10.0) | 52(13.0) | 28(7.0) |
| Fenugreek leaves | 16(4.0) | 48(12.0) | 108(27.0) | 124(31.0) | 84(21.0) | 20(5.0) |
| Bengal gram leaves | - | - | 44(11.0) | 60(15.0) | 140(35.0) | 156(39.0) |
| Mustard | - | - | 56(14.0) | 148(37.0) | 184(46.0) | 20(5.0) |
| Spinach | 8(2.0) | 44(11.0) | 132(33.0) | 136(34.0) | 68(17.0) | 12(3.0) |
| Roots and Tubers | ||||||
| Radish | - | 100(25.0) | 148(37.0) | 124(31.0) | 28(7.0) | - |
| Carrot | 32(8.0) | 116(29.0) | 136(34.0) | 84(21.0) | 32(8.0) | - |
| Potato | 104(26.0) | 188(47.0) | 72(18.0) | 36(9.0) | - | - |
| Onion | 332(83.0) | 32(8.0) | 16(4.0) | - | - | 20(5.0) |
| Ginger | 24(6.0) | 48(12.0) | 92(23.0) | 148(37.0) | 56(14.0) | 32(8.0) |
| Garlic | 164(41.0) | 104(26.0) | 76(19.0) | 36(9.0) | 8(2.0) | 12(3.0) |
| Turnip | - | - | 56(14.0) | 64(16.0) | 156(39.0) | 124(31.0) |
| Other Vegetables | ||||||
| Tomato | 196(49.0) | 60(15.0) | 84(21.0) | 52(13.0) | - | 8(2.0) |
| Cauliflower | - | - | 188(47.0) | 124(31.0) | 48(12.0) | 40(10.0) |
| Cabbage | - | - | 184(46.0) | 132(33.0) | 48(12.0) | 36(9.0) |
| Green chillies | 316(79.0) | 40(10.0) | 24(6.0) | 20(5.0) | - | - |
| Lady finger | - | - | 180(45.0) | 124(31.0) | 76(19.0) | 20(5.0) |
| Peas (Green) | - | 44(11.0) | 116(29.0) | 224(53.0) | 28(7.0) | - |
| Tinda | - | 164(41.0) | 80(20.0) | 124(31.0) | 32(8.0) | - |
| Fruits | ||||||
| Guava | - | 28(7.0) | 124(31.0) | 188(47.0) | 36(9.0) | 24(6.0) |
| Apple | - | - | 20(5.0) | 112(28.0) | 244(61.0) | 24(6.0) |
| Banana | - | - | 84(21.0) | 152(38.0) | 164(41.0) | - |
| Ber | 16(4.0) | 60(15.0) | 132(33.0) | 192(48.0) | - | - |
| Lemon | 28(7.0) | 68(17.0) | 164(41.0) | 120(30.0) | 20(5.0) | - |
| Kinnow | 20(5.0) | 32(8.0) | 156(39.0) | 164(41.0) | 28(7.0) | - |
| Papaya | - | 32(8.0) | 172(43.0) | 132(33.0) | 64(16.0) | - |
| Mango | - | 36(9.0) | 156(39.0) | 192(48.0) | 16(4.0) | - |
| Watermelon | - | 8(2.0) | 140(35.0) | 88(22.0) | 164(41.0) | - |
| Milk and Milk Products | ||||||
| Cow’s milk | 56(14.0) | 68(17.0) | 60(15.0) | 76(19.0) | 116(29.0) | 24(6.0) |
| Buffalo’s milk | 164(41.0) | 112(28.0) | 48(12.0) | 76(19.0) | - | - |
| Curd | 128(32.0) | 148(37.0) | 60(15.0) | 52(13.0) | 12(3.0) | - |
Table text extracted from the original PDF; superscript letters are shown inline. The original table image is below.
View original table image
References
21 in the original paper- Behrman JR. The economic rationale for investing in nutrition in developing countries. Washington: Office of Nutrition, USAID; 2022.
- Bhatia D, Seshadri S. Growth performance in anemia and following iron supplementation. Indian Pediatr. 2020;30:195-200.
- Sethi D. Assessment of nutritional status of (7-9 years) rural school-going children of Fatehabad District (Haryana) [M.Sc. Thesis]. Hisar: CCS Haryana Agricultural University; 2012.
- Dudi R, Punia D. Socio-economic profile and food consumption pattern of rural Indian pre-schoolers. J Ind Dietet Assoc. 2009;33(1):51-66.
- Eilander A, Muthayya S, Knaap H, Srinivasan K, Thomas T, Kok FJ, Kurpad AV, Osendarp SJM. Undernutrition, fatty acid and micronutrient status in relation to cognitive performance in Indian school children: cross-sectional study. British J Nutr. 2010;103:1056-1064.
- Handa R, Ahamad F, Kesari KK, Prasad R. Assessment of nutritional status of 7-10 years school-going children of Allahabad district. Middle-East J Scientific Res. 2018;3:109-115.
- Hans H. Assessment of nutritional status of rural school-going children (7-9 years) of Gurgaon district of Haryana [M.Sc. Thesis]. Hisar: CCS Haryana Agricultural University; 2014.
- Hisar: CCS Haryana Agricultural University; 2014.
- Khosla S, Singh I, Sangha J. A study of nutritional profile of preschool children living in urban slums of Ludhiana city. J Res Punjab Agric Univ. 2010;37(12):124-132.
- Kumari S, Jain R. Assessment of nutritional status of school children from rural Bihar. Indian J Nutr Dietet. 2015;42:326-334.
- Manu, Khetarpaul N. Food consumption pattern of Indian rural preschool children (4-5Y). Brit Fd J. 2006;108(2):127-140.
- Murugkar DA, Gulati P, Gupta C. Nutritional status of school-going children (6-9 years) in rural area of Bhopal district (Madhya Pradesh), India. Nutr J Fd Nutri Sci. 2013;2(4):61. Available from: http://www.ijfans.com/currentissue.html
- Oninla SO, Owab JA, Onayadec AA, Taiwob O. Comparative study of nutritional status of urban and rural Nigerian school children. J Trop Pediatr. 2007;53(1):39-43.
- Patil SN, Wasnik VR. Nutritional and health status of rural school children in Ratnagiri district of Maharashtra. J Clin Diagn Res. 2009;3(3):1611-1614.
- Prajapati M, Bala DV, Tiwari H. A study of nutritional status and high-risk behavior of adolescents in Ahmedabad: A cross-sectional study. Healthline. 2011;2(1):21-27.
- Sati V, Dahiya S. Nutritional assessment of rural school-going children (7-9 years) of Hisar district, Haryana. Scientific Reports. 2017;1(7):1-7.
- Shah SM, Selwyn BJ, Luby S, Merchant A, Bano R. Prevalence and correlates of stunting among children in rural Pakistan. Pediatr Int. 2003;45(1):49-53.
- Shakti, Dubey RP, Sheikhy S. Assessment of food consumption pattern and nutritional status of schoolgoing children of Faizabad district. Trends Biosci. 2019;6(6):755-757.
- Soni RP, Katoch M. Dietary adequacy of school-going children in selected areas of Himachal Pradesh. IOSR J Humanit Soc Sci. 2024;19(9):85-90.
- Bose A, Sharma M, Gupta N. Nutritional status of school children in rural India. Indian J Pediatr. 2008;75(4):357-361.
- Sati D. Assessment of nutritional status of (7-9 years) rural school-going children of Fatehabad District (Haryana) [M.Sc. Thesis]. Hisar: CCS Haryana Agricultural University; 2012.