
Research article · 2025 · Full text
International Journal of Agriculture and NutritionAgronomic biofortification with iron and zinc for enhancement in yield and quality of maize (Zea mays L.)
Volume 7(8) · Pages 117–121 · DOI: 10.33545/26646064.2025.v7.i8b.278 ↗
Research areasCrop Yield and Soil Fertility
Abstract
Author-writtenA field experiment was conducted during the kharif season of 2024 at the Agricultural Research Farm, Vivekananda Global University, Jaipur, Rajasthan, to evaluate the impact of agronomic biofortification with iron (Fe) and zinc (Zn) on maize (Zea mays L.) hybrid DHM 117. The study utilized a randomized block design with nine treatments, including control and combinations of recommended dose of fertilizers (RDF) with soil and foliar applications of ZnSO₄ and FeSO₄. Results showed that the treatment RDF + soil application of ZnSO₄ @ 20 kg/ha + 0.5% FeSO₄ foliar spray at 45 days after sowing (DAS) significantly enhanced plant population (8.28 plants/m row at 30 DAS), plant height (up to 55.9% increase at harvest), dry matter accumulation (up to 67.12% increase), yield attributes (e.g., 57.85% more grains/cob), grain yield (87.85% increase to 74.84 q/ha), nutrient content and uptake (N, P, K increases of 108%, 154%, and 144% in grain), protein content (11.58% increase), and economic returns (net return of ₹102,715/ha, B:C ratio 1.77). This integrated approach proved effective for improving maize productivity, nutritional quality, and profitability under semi-arid conditions.
Summary
Source-checkedPlain-language reading of the full paper, prepared with AI and checked against the text. Each point links to the authors' own words.
Why it matters
- Maize is a globally significant cereal crop used for human food, animal feed, and industrial purposes. View evidence ↗
- Deficiencies of iron and zinc in soils and crops lead to 'hidden hunger,' which negatively impacts human health. View evidence ↗
- Agronomic biofortification increases the nutrient density of crops using soil and foliar fertilizer applications, as opposed to genetic modification. View evidence ↗
The question
- The study aimed to evaluate how biofortification with iron (Fe) and zinc (Zn) affects the growth, yield, nutrient uptake, quality, and economic returns of maize. View evidence ↗
What they did
- The experiment was conducted during the 2024 kharif season in Jaipur, Rajasthan, using the maize hybrid DHM 117. View evidence ↗
- The recommended dose of fertilizer (RDF) consisted of 120 kg N/ha, 50 kg P₂O₅/ha, and 40 kg K₂O/ha. View evidence ↗
What they found
- Treatment T7 (RDF + soil ZnSO₄ + foliar FeSO₄) increased the plant population to 8.28 plants/m row at 30 days after sowing, a 32.15% increase over the control (6.22 plants/m row). View evidence ↗
- At harvest, plant height was significantly higher in treatment T7, showing up to a 55.9% increase compared to the control. View evidence ↗
- Dry matter accumulation at harvest increased by 67.12% under treatment T7 compared to the control. View evidence ↗
- Nitrogen uptake in treatment T7 increased to 107.76 kg/ha in grain (a 108.03% increase) and 65.27 kg/ha in stover (a 90.29% increase). View evidence ↗
- Phosphorus content in grain reached 1.57% (35.34% increase) and uptake reached 117.49 kg/ha (154.3% increase) under treatment T7. View evidence ↗
- Potassium uptake in grain increased by 144.2% to 29.18 kg/ha under treatment T7. View evidence ↗
- The highest protein content of 9.06% was achieved in treatment T8, representing an 11.58% increase. View evidence ↗
- Treatment T7 maximized economic returns with a gross return of ₹160,540 (78% over control), a net return of ₹102,715.04 (175% over control), and a B:C ratio of 1.77. View evidence ↗
What it means
- The authors conclude that the integrated application of soil zinc and foliar iron is effective for enhancing maize productivity, nutritional quality, and profitability in semi-arid regions. View evidence ↗
Visual summary
2 visualsIllustrations explain the paper; charts are replotted from the paper's own table values.
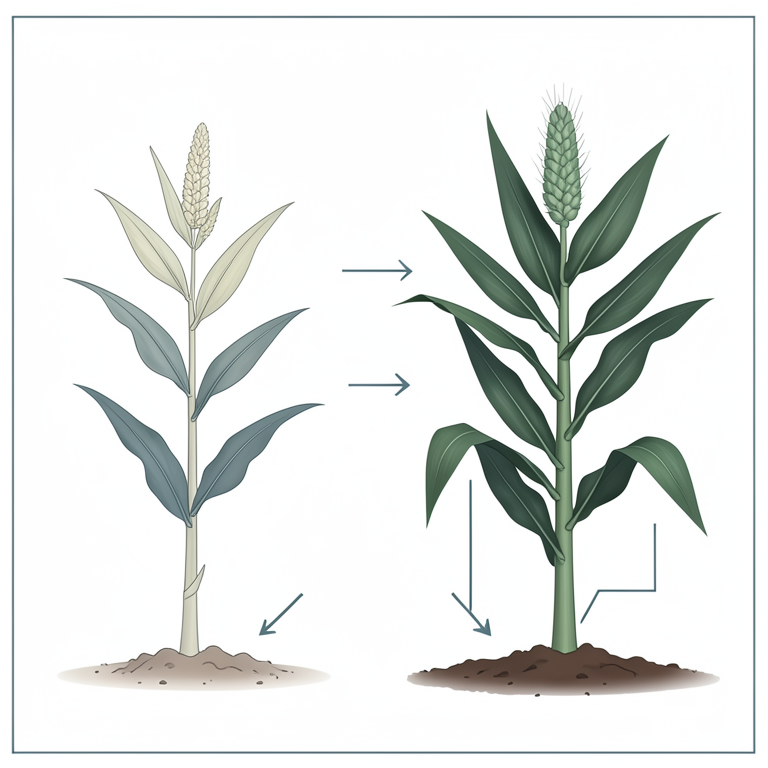
Experimental Treatment Layout
AI-generated conceptual illustration (maize plants (Zea mays L.)). It explains the idea and does not show study data.
View source evidence ↗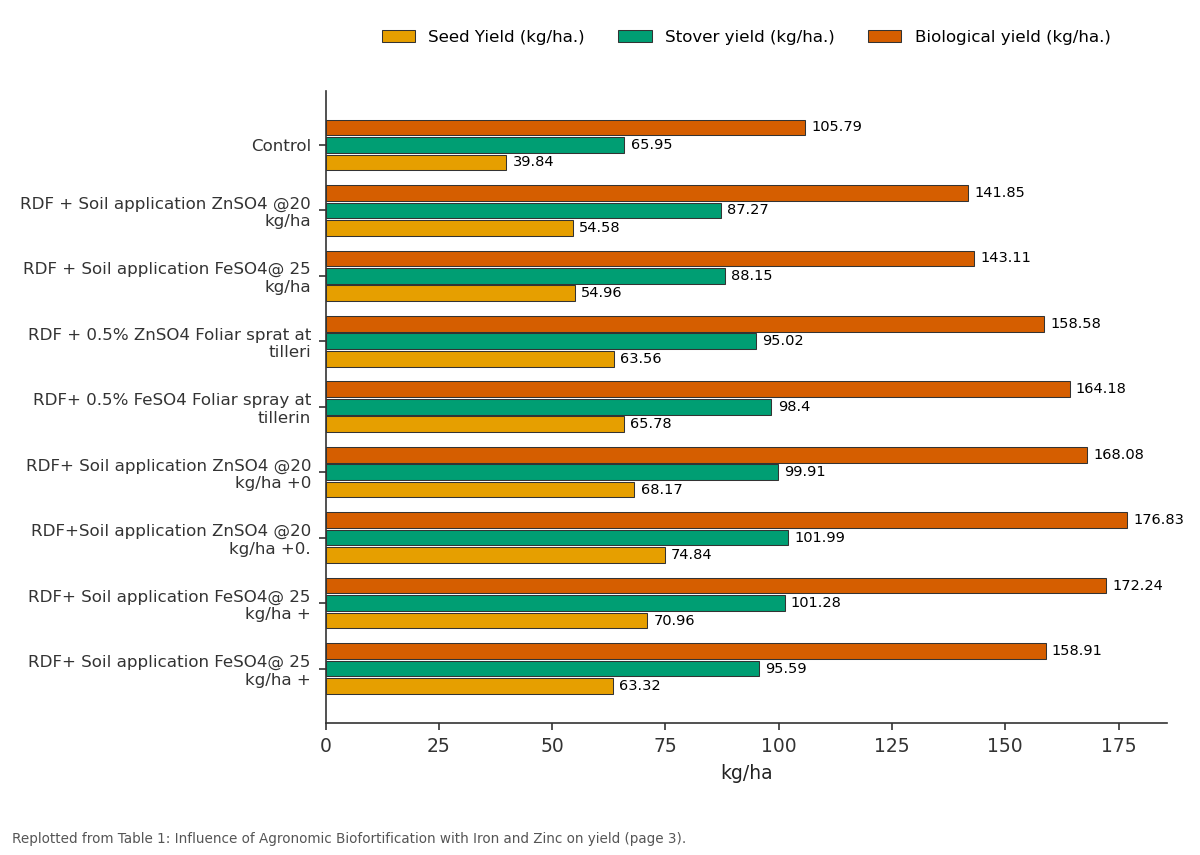
Seed Yield (kg/ha.) and Stover yield (kg/ha.) and more: Control vs RDF + Soil application... vs RDF + Soil application... vs RDF + 0.5% ZnSO4 Foliar... vs RDF+ 0.5% FeSO4 Foliar...
Replotted from Table 1 (page 3) of the original paper. Every bar is the paper's own table value.
View source evidence ↗Figures & tables
From the original paper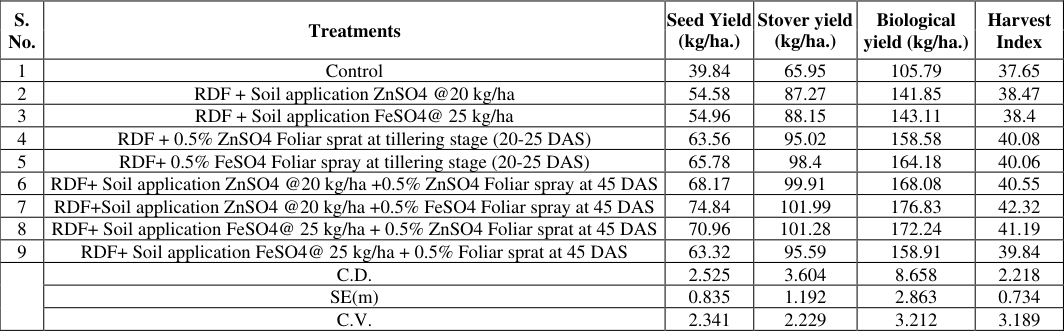 Table 1
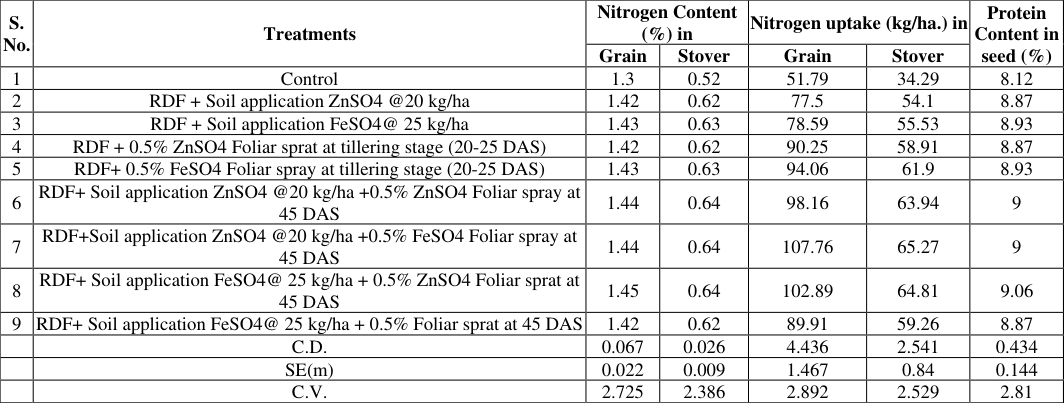 Table 2
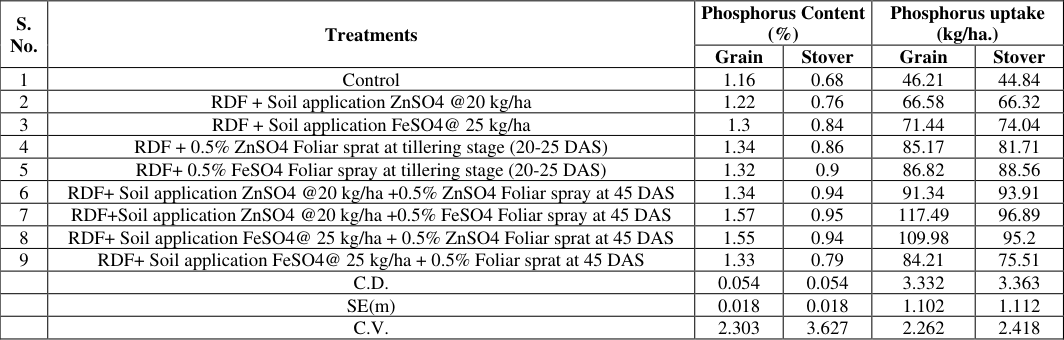 Table 3
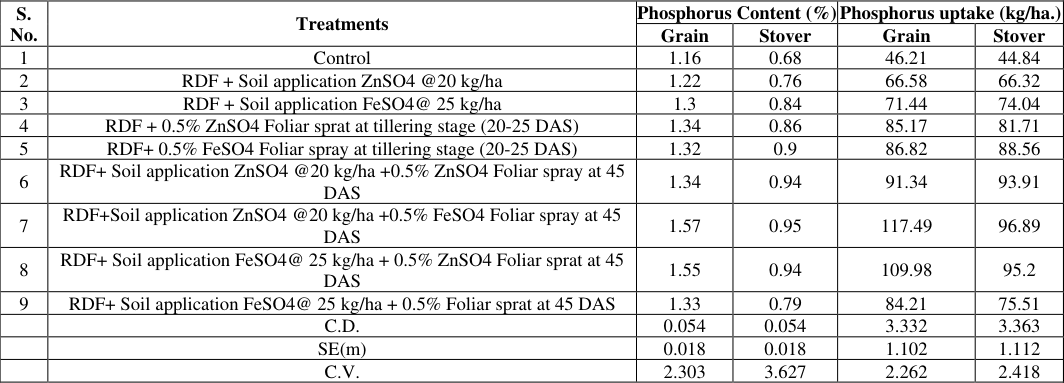 Table 4
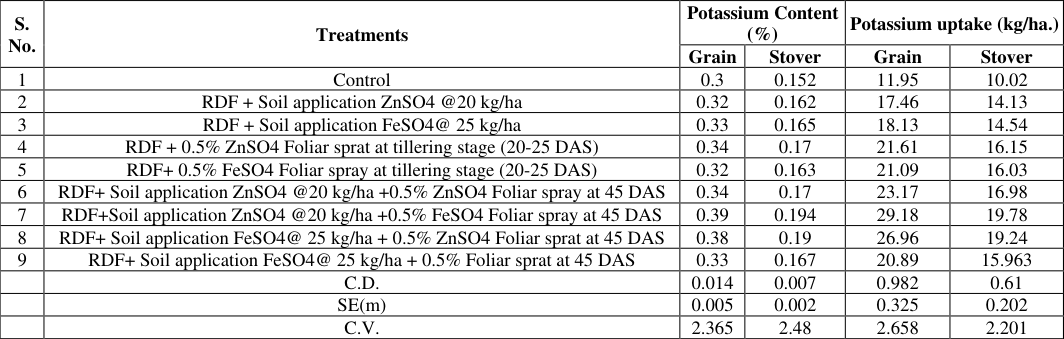 Table 5
Introduction
Maize (Zea mays L.) is a vital cereal crop globally, serving as a staple food, animal feed, and industrial raw material. In India, it ranks third after rice and wheat, with an area of 11.24 million ha, production of 37.66 million tons, and productivity of 3.35 t/ha (Anonymous, 2024) [1] . In Rajasthan, maize covers 0.94 million ha with a production of 2.28 million tons and productivity of 2.4 t/ha (Anonymous, 2024) [1] . Nutritionally, maize provides essential macronutrients and micronutrients, but deficiencies in iron (Fe) and zinc (Zn) in soils and crops contribute to hidden hunger affecting human health. Agronomic biofortification involves enhancing crop nutrient density through fertilizer applications, differing from genetic methods by improving nutrient uptake via soil and foliar means. Micronutrient deficiencies, such as Zn (47% in Indian soils) and Fe (13%), limit crop productivity (Sakal and Singh, 2001) [13] . Zn aids in enzyme activation, auxin synthesis, and stress resistance, while Fe is crucial for chlorophyll synthesis and metabolic processes. Combined Fe and Zn applications have shown promise in boosting growth, yield, and quality (Bhardwaj et al., 2022) [5] . This study aimed to: (1) investigate the impact of agronomic biofortification with Fe and Zn on maize growth and yield; (2) examine its influence on nutrient uptake and quality; and (3) analyze the economic implications.
Materials and Methods
Materials and Methods
Experimental Site
The experiment was conducted during the kharif season of 2024 at the Agricultural Research Farm, Vivekananda Global University, Jaipur, Rajasthan (agro-climatic zone III A, semi-arid Eastern Plain Zone). The climate is semi-arid with summer temperatures up to 48 °C, winter lows to 1 °C, and annual rainfall of 450-550 mm, mainly during July-August. During the crop season, maximum temperatures ranged from 30.2 °C to 40.9 °C, minimum from 14.3 °C to 25.4 °C, relative humidity 15-85%, and sunshine hours 1.8-9.3. Soil was loamy sand, alkaline (pH 8.2), low in organic carbon (0.32%), available N (185 kg/ha), and P (12.5 kg/ha), and medium in K (245 kg/ha).
Cropping History and Variety
The field had mung bean and fallow in 2023-24, with maize in kharif 2024. The variety used was DHM 117, a mediumduration hybrid (90-100 days) with high yield potential (80 q/ha), tolerant to stalk rot and foliar diseases. RDF+ Soil application FeSO4@ 25 kg/ha + 0.5% Foliar sprat at 45 DAS T9 RDF = Recommended dose of fertilizer (120 kg N +50 kg P2O5/ha+ 40 kg K2O
Treatments and
Treatments and
Cultural Practices
Land was prepared with two ploughings, harrowing, and planking. Seeds (25 kg/ha) were treated with Bavistin + Captan (2 g/kg) and Metalaxyl (4 g/kg), sown at 60 cm × 20 cm spacing. Thinning occurred at 15 DAS. Irrigation used check basin method during critical stages. Weeds were managed manually at 15-20 DAS and with Tembotrione (150 g a.i./ha) at 30 DAS. Pests were controlled with Chlorpyriphos (0.05%). Harvesting was manual, with grain yield adjusted to 15% moisture.
Observations
Growth parameters: Plant population (plants/m row at 30 DAS and harvest), height (cm at 30, 60, 90 DAS, harvest), dry matter (q/ha at 30, 60, 90 DAS, harvest), phenological stages (days to kneehigh, tasseling, silking, maturity). Yield attributes: Cobs/plant, rows/cob, grains/cob, seed index (g), cob length/diameter (cm with/without husk), grain/stover/biological yield (q/ha), harvest index (%). Nutrient analysis: N (Kjeldahl method), P, K content/uptake in grain/stover; protein (%) = N × 6.25. Economics: Gross/net returns, B:C ratio based on market prices.
Statistical Analysis
Data were analyzed using ANOVA, with significance at p≤ 0.05.
Results and Discussion
Results and Discussion
Growth Parameters
Plant population ranged from 6.22 (T1) to 8.28 plants/m row (T7) at 30 DAS (32.15% increase) and 6.02 to 8.12 at harvest (34.88% increase). T7 outperformed others due to Zn's role in auxin synthesis and Fe's in chlorophyll formation, enhancing seedling vigor (Prasad et al., 2014; Anwar et al., 2022) [12,2] .
Plant height increased significantly under T7 (up to 55.9% at harvest over T1), attributed to micronutrients' metabolic roles. Dry matter accumulation followed similar trends, with T7 showing 67.12% increase at harvest, reflecting improved photosynthesis (Kumar and Salakinkop, 2018) [10] . Phenological stages were prolonged under T7 (e.g., 10.74% delay to maturity), allowing extended biomass accumulation (Augustine and Kalyanasundaram, 2021).
Yield
4.1 Grain Yield (q/ha): According to Table, the grain yield ranged from 39.84 kg/ha (Control) to 74.84 kg/ha (RDF + Soil application ZnSO4 @20 kg/ha + 0.5% FeSO4 Foliar spray at 45 DAS), with the highest treatment increasing yield by 87.85% and the lowest (Control) at 0% increase. Other treatments showed yield increases from 37.05% (RDF + Soil application ZnSO4 @20 kg/ha) to 77.61% (RDF + Soil application ZnSO4 @20 kg/ha + 0.5% FeSO4 Foliar spray at 45 DAS) compared to the Control.
According to Table, the stover yield ranged from 105.79 kg/ha (Control) to 176.83 kg/ha (RDF + Soil application ZnSO4 @20 kg/ha + 0.5% FeSO4 Foliar spray at 45 DAS), with the highest treatment increasing yield by 67.14% and the lowest (Control) at 0% increase. Other treatments showed yield increases from 34.06% (RDF + Soil application ZnSO4 @20 kg/ha) to 62.81% (RDF + Soil application FeSO4@ 25 kg/ha + 0.5% ZnSO4 Foliar spray at 45 DAS) compared to the Control, with treatments 4 and 9 being statistically at par.
The biological yield ranged from 105.79 kg/ha (Control) to 176.83 kg/ha (RDF + Soil application ZnSO4 @20 kg/ha + 0.5% FeSO4 Foliar spray at 45 DAS), with the highest increase of 67.12% over the control for treatment 7 and the lowest increase of 33.92% for treatment 2. All treatments showed significant yield improvements over the control, with percentage increases ranging from 33.92% (treatment 2) to 67.12% (treatment 7), and treatment 9 being closest to par with a 50.21% increase.
The Harvest Index ranged from 37.65 (Control) to 42.32 (RDF + Soil application ZnSO4 @20 kg/ha + 0.5% FeSO4 Foliar spray at 45 DAS), with the highest increase of 12.35% over the control for treatment 7 and the lowest increase of 2.18% for treatment 2. All treatments improved the Harvest Index compared to the control, with percentage increases ranging from 2.18% (treatment 2) to 12.35% (treatment 7), and treatment 9 (5.82% increase) being closest to the median improvement. [6,11] .
Economics
Cost of cultivation ranged ₹52,862 (T 1 ) to ₹63,724.96 (T 9 ).
Gross returns peaked at ₹160,540 (T 7 , 78% over T 1 ), net returns ₹102,715.04 (175%), and B:C 1.77 (153%).
Integrated applications maximized profitability (Goyal et al., 2018) [8] .
Acknowledgement
Acknowledgement
Figures and tables from the paper
| S. No. | Treatments | Seed Yield (kg/ha.) | Stover yield (kg/ha.) | Biological yield (kg/ha.) | Harvest Index |
|---|---|---|---|---|---|
| 1 | Control | 39.84 | 65.95 | 105.79 | 37.65 |
| 2 | RDF + Soil application ZnSO4 @20 kg/ha | 54.58 | 87.27 | 141.85 | 38.47 |
| 3 | RDF + Soil application FeSO4@ 25 kg/ha | 54.96 | 88.15 | 143.11 | 38.4 |
| 4 | RDF + 0.5% ZnSO4 Foliar sprat at tillering stage (20-25 DAS) | 63.56 | 95.02 | 158.58 | 40.08 |
| 5 | RDF+ 0.5% FeSO4 Foliar spray at tillering stage (20-25 DAS) | 65.78 | 98.4 | 164.18 | 40.06 |
| 6 | RDF+ Soil application ZnSO4 @20 kg/ha +0.5% ZnSO4 Foliar spray at 45 DAS | 68.17 | 99.91 | 168.08 | 40.55 |
| 7 | RDF+Soil application ZnSO4 @20 kg/ha +0.5% FeSO4 Foliar spray at 45 DAS | 74.84 | 101.99 | 176.83 | 42.32 |
| 8 | RDF+ Soil application FeSO4@ 25 kg/ha + 0.5% ZnSO4 Foliar sprat at 45 DAS | 70.96 | 101.28 | 172.24 | 41.19 |
| 9 | RDF+ Soil application FeSO4@ 25 kg/ha + 0.5% Foliar sprat at 45 DAS | 63.32 | 95.59 | 158.91 | 39.84 |
| C.D. | 2.525 | 3.604 | 8.658 | 2.218 | |
| SE(m) | 0.835 | 1.192 | 2.863 | 0.734 | |
| C.V. | 2.341 | 2.229 | 3.212 | 3.189 |
Table text extracted from the original PDF; superscript letters are shown inline. The original table image is below.
View original table image
| S. No. | Treatments | Nitrogen Content (%) in | — | Nitrogen uptake (kg/ha.) in | — | Protein Content in seed (%) |
|---|---|---|---|---|---|---|
| Grain | Stover | Grain | Stover | |||
| 1 | Control | 1.3 | 0.52 | 51.79 | 34.29 | 8.12 |
| 2 | RDF + Soil application ZnSO4 @20 kg/ha | 1.42 | 0.62 | 77.5 | 54.1 | 8.87 |
| 3 | RDF + Soil application FeSO4@ 25 kg/ha | 1.43 | 0.63 | 78.59 | 55.53 | 8.93 |
| 4 | RDF + 0.5% ZnSO4 Foliar sprat at tillering stage (20-25 DAS) | 1.42 | 0.62 | 90.25 | 58.91 | 8.87 |
| 5 | RDF+ 0.5% FeSO4 Foliar spray at tillering stage (20-25 DAS) | 1.43 | 0.63 | 94.06 | 61.9 | 8.93 |
| 6 | RDF+ Soil application ZnSO4 @20 kg/ha +0.5% ZnSO4 Foliar spray at 45 DAS | 1.44 | 0.64 | 98.16 | 63.94 | 9 |
| 7 | RDF+Soil application ZnSO4 @20 kg/ha +0.5% FeSO4 Foliar spray at 45 DAS | 1.44 | 0.64 | 107.76 | 65.27 | 9 |
| 8 | RDF+ Soil application FeSO4@ 25 kg/ha + 0.5% ZnSO4 Foliar sprat at 45 DAS | 1.45 | 0.64 | 102.89 | 64.81 | 9.06 |
| 9 | RDF+ Soil application FeSO4@ 25 kg/ha + 0.5% Foliar sprat at 45 DAS | 1.42 | 0.62 | 89.91 | 59.26 | 8.87 |
| C.D. | 0.067 | 0.026 | 4.436 | 2.541 | 0.434 | |
| SE(m) | 0.022 | 0.009 | 1.467 | 0.84 | 0.144 | |
| C.V. | 2.725 | 2.386 | 2.892 | 2.529 | 2.81 |
Table text extracted from the original PDF; superscript letters are shown inline. The original table image is below.
View original table image
| S. No. | Treatments | Phosphorus Content (%) | — | Phosphorus uptake (kg/ha.) | — |
|---|---|---|---|---|---|
| Grain | Stover | Grain | Stover | ||
| 1 | Control | 1.16 | 0.68 | 46.21 | 44.84 |
| 2 | RDF + Soil application ZnSO4 @20 kg/ha | 1.22 | 0.76 | 66.58 | 66.32 |
| 3 | RDF + Soil application FeSO4@ 25 kg/ha | 1.3 | 0.84 | 71.44 | 74.04 |
| 4 | RDF + 0.5% ZnSO4 Foliar sprat at tillering stage (20-25 DAS) | 1.34 | 0.86 | 85.17 | 81.71 |
| 5 | RDF+ 0.5% FeSO4 Foliar spray at tillering stage (20-25 DAS) | 1.32 | 0.9 | 86.82 | 88.56 |
| 6 | RDF+ Soil application ZnSO4 @20 kg/ha +0.5% ZnSO4 Foliar spray at 45 DAS | 1.34 | 0.94 | 91.34 | 93.91 |
| 7 | RDF+Soil application ZnSO4 @20 kg/ha +0.5% FeSO4 Foliar spray at 45 DAS | 1.57 | 0.95 | 117.49 | 96.89 |
| 8 | RDF+ Soil application FeSO4@ 25 kg/ha + 0.5% ZnSO4 Foliar sprat at 45 DAS | 1.55 | 0.94 | 109.98 | 95.2 |
| 9 | RDF+ Soil application FeSO4@ 25 kg/ha + 0.5% Foliar sprat at 45 DAS | 1.33 | 0.79 | 84.21 | 75.51 |
| C.D. | 0.054 | 0.054 | 3.332 | 3.363 | |
| SE(m) | 0.018 | 0.018 | 1.102 | 1.112 | |
| C.V. | 2.303 | 3.627 | 2.262 | 2.418 |
Table text extracted from the original PDF; superscript letters are shown inline. The original table image is below.
View original table image
| S. No. | Treatments | Potassium Content (%) | — | Potassium uptake (kg/ha.) | — |
|---|---|---|---|---|---|
| Grain | Stover | Grain | Stover | ||
| 1 | Control | 0.3 | 0.152 | 11.95 | 10.02 |
| 2 | RDF + Soil application ZnSO4 @20 kg/ha | 0.32 | 0.162 | 17.46 | 14.13 |
| 3 | RDF + Soil application FeSO4@ 25 kg/ha | 0.33 | 0.165 | 18.13 | 14.54 |
| 4 | RDF + 0.5% ZnSO4 Foliar sprat at tillering stage (20-25 DAS) | 0.34 | 0.17 | 21.61 | 16.15 |
| 5 | RDF+ 0.5% FeSO4 Foliar spray at tillering stage (20-25 DAS) | 0.32 | 0.163 | 21.09 | 16.03 |
| 6 | RDF+ Soil application ZnSO4 @20 kg/ha +0.5% ZnSO4 Foliar spray at 45 DAS | 0.34 | 0.17 | 23.17 | 16.98 |
| 7 | RDF+Soil application ZnSO4 @20 kg/ha +0.5% FeSO4 Foliar spray at 45 DAS | 0.39 | 0.194 | 29.18 | 19.78 |
| 8 | RDF+ Soil application FeSO4@ 25 kg/ha + 0.5% ZnSO4 Foliar sprat at 45 DAS | 0.38 | 0.19 | 26.96 | 19.24 |
| 9 | RDF+ Soil application FeSO4@ 25 kg/ha + 0.5% Foliar sprat at 45 DAS | 0.33 | 0.167 | 20.89 | 15.963 |
| C.D. | 0.014 | 0.007 | 0.982 | 0.61 | |
| SE(m) | 0.005 | 0.002 | 0.325 | 0.202 | |
| C.V. | 2.365 | 2.48 | 2.658 | 2.201 |
Table text extracted from the original PDF; superscript letters are shown inline. The original table image is below.
View original table image
References
13 in the original paper- Anonymous. Unified Portal for Agricultural Statistics (UPAg). Department of Agriculture and Farmer Welfare, Government of India; 2024.
- Anwar Z, Basharat Z, Hafeez MB, Khan S, Zahra N, Rafique Z, Maqsood M. Biofortification of maize with zinc and iron not only enhances crop growth but also improves grain quality. Asian J Agric Biol. 2022;2022(2):1-9.
- Augustine R, Imayavaramban V. Agronomic biofortification through integrated nutrient management on maize (Zea mays L.) hybrids. Agric Sci Dig. 2022;42(2):187-91.
- Augustine R, Kalyanasundaram D. Effect of agronomic biofortification on growth, yield, uptake and quality characters of maize (Zea mays L.) through integrated management practices under North-eastern region of Tamil Nadu, India. J Appl Nat Sci. 2021;13(1):278-86.
- Bhardwaj AK, Chejara S, Malik K, Kumar R, Kumar A, Yadav RK. Agronomic biofortification of food crops: An emerging opportunity for global food and nutritional security. Front Plant Sci. 2022;13:1055278.
- Cakmak I. Enrichment of cereal grains with zinc: Agronomic or genetic biofortification? Plant Soil. 2008;302(1-2):1-17.
- Choudhary BL, Sharma PK, Mandeewal RL, Verma BL, Dudwal M. Response of iron and zinc on yield attributes, yield and economics of wheat (Triticum aestivum L.). Int J Plant Soil Sci. 2021;33(16):29-35.
- Goyal G, Verma VK, Pyare R, Verma M. Agronomic biofortification strategy through zinc and iron application in wheat (Triticum aestivum L.) varieties. Int J Chem Stud. 2018;6(5):2068-71.
- Kasania A, Sharma PK, Ola MP, Choudhary BL, Abhinav. Effect of bio-fortification in pearl millet (Pennisetum glaucum L.) through micronutrients. Front Crop Improv. 2023;11:1543-7.
- Kumar N, Salakinkop SR. Agronomic biofortification of maize with zinc and iron micronutrients. Mod Concepts Dev Agron. 2018;1(4):000522.
- Manzeke GM, Mapfumo P, Mtambanengwe F, et al. Zinc fertilization influence on maize productivity and International Journal of Agriculture and Nutrition https://www.agriculturejournal.net grain nutritional quality under integrated soil fertility management in Zimbabwe. Field Crops Res. 2020;246:107673.
- Prasad R, Shivay YS, Kumar D. Agronomic biofortification of cereal grains with iron and zinc. Adv Agron. 2014;125:55-91.
- Sakal R, Singh AP. Micronutrient in relation to response and quality of crop. J Agric Chem. 2001;14:45.