
Research article · 2025 · Full text
International Journal of Agriculture and Food ScienceOptimizing crop prediction, yield prediction and fertilizer recommendation with machine learning, feature selection, and sampling techniques for sustainable agriculture
Volume 7(8) · Pages 1245–1257 · DOI: 10.33545/2664844x.2025.v7.i8l.699 ↗
Research areasSmart Agriculture and AI
Abstract
Author-writtenFor modern farmers, predicting crop yields is essential to making data-driven choices that increase productivity and promote sustainable farming practices. In order to predict crop yields based on a number of crucial soil and environmental characteristics, this study will use the machine learning approach. Soil nutrient levels, weather, temperature, and precipitation are all factors that go into training the model. This study employs a stable prediction model that is built using the following machine learning algorithms: Random Forest, Decision Tree, Naive Bayes, KNN, and Support Vector Machine (SVM). It is suggested to preprocess the data using feature selection techniques like BORUTA and Recursive Feature Elimination (RFE) to remove multiple or unnecessary features. This improves the accuracy and efficiency of the model. The database was prepared and the model accuracy was improved using random oversampling (ROSE) and SMOTE methods. The system is also used to provide a fertilizer recommendation whereas the system uses information on the soil and crop types and suggests effective fertilizers to use hereby helping farmers choose the best fertilizers in terms of nutrient management.
Summary
Source-checkedPlain-language reading of the full paper, prepared with AI and checked against the text. Each point links to the authors' own words.
Why it matters
- Predicting crop yields is critical for modern farmers to make data-driven decisions that improve productivity and support sustainable agriculture. View evidence ↗
- Factors such as weather, temperature, precipitation, and soil nutrient levels are key variables used to train crop prediction models. View evidence ↗
The question
- The study aims to use machine learning to predict crop yields based on essential environmental and soil characteristics. View evidence ↗
What they did
- The research utilized a dataset containing 22 different crop types, including staples like rice, wheat, and maize. View evidence ↗
- To prevent sampling bias, the dataset was split into training and testing sets using an 80:20 ratio. View evidence ↗
- The system uses Recursive Feature Elimination (RFE) and BORUTA for feature selection, and SMOTE and ROSE for sampling, based on inputs like NPK values, pH, rainfall, moisture, and temperature. View evidence ↗
- The study evaluated five machine learning algorithms for prediction: Random Forest, Decision Tree, Naive Bayes, KNN, and Support Vector Machine (SVM). View evidence ↗
What they found
- Support Vector Machine (SVM) generally performed worse than other models regardless of the feature selection strategy used. View evidence ↗
- The ROSE sampling technique consistently resulted in slightly higher model performance across all metrics compared to SMOTE. View evidence ↗
- For yield regression, Random Forest was the top performer with an R² score of 91.616%, a Mean Absolute Error (MAE) of 3.681, and a Root Mean Squared Error (RMSE) of 4.606. View evidence ↗
What it means
- The current model is limited by its calibration on a restricted range of crops and conditions, which may hinder its transferability to diverse agricultural settings. View evidence ↗
Visual summary
2 visualsIllustrations explain the paper; charts are replotted from the paper's own table values.
Integrated Prediction Pipeline
AI-generated conceptual illustration (Agricultural soil and diverse crop plants). It explains the idea and does not show study data.
View source evidence ↗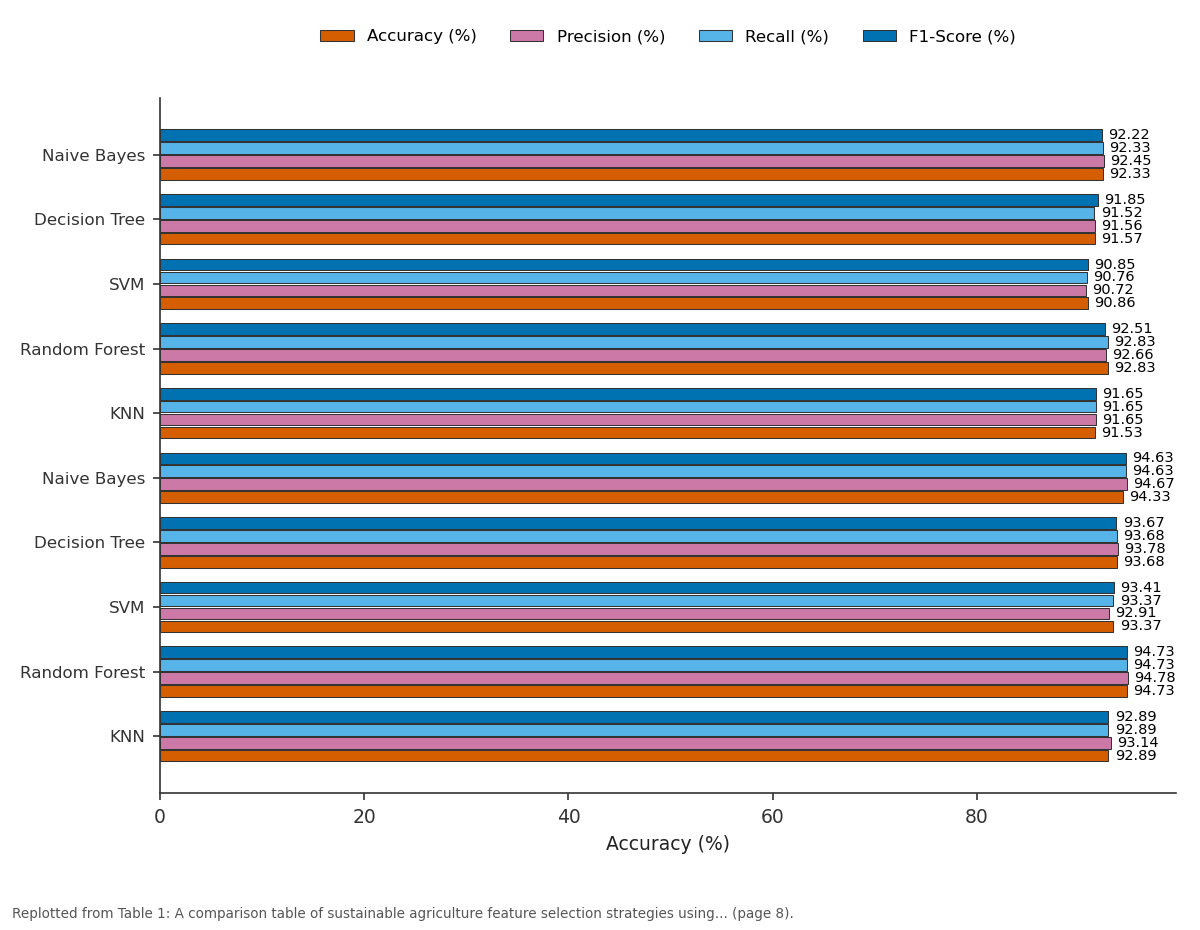
Accuracy (%) and Precision (%) and more: Naive Bayes vs Decision Tree vs SVM vs Random Forest vs KNN
Replotted from Table 1 (page 8) of the original paper. Every bar is the paper's own table value.
View source evidence ↗Figures & tables
From the original paper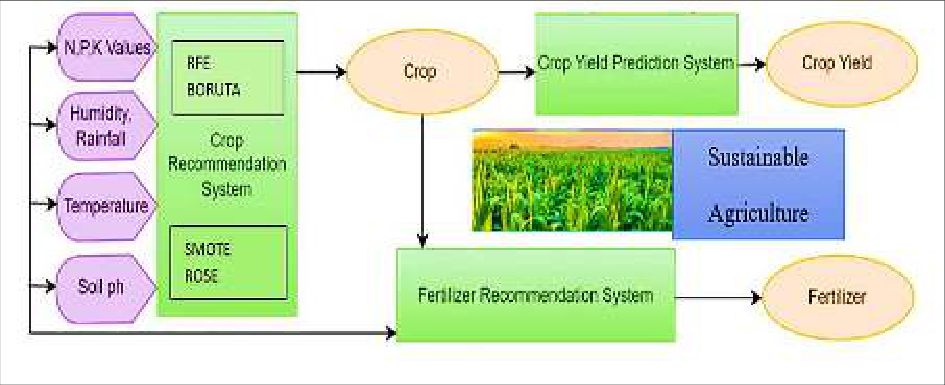 Figure 1
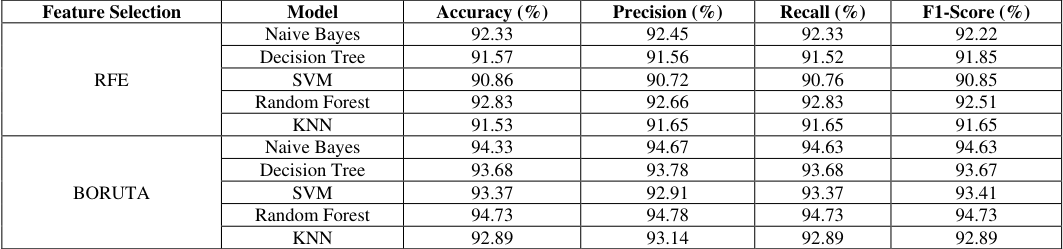 Table 1
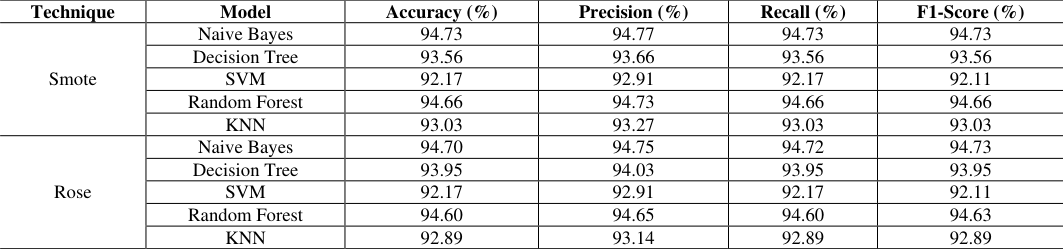 Table 2
 Table 3
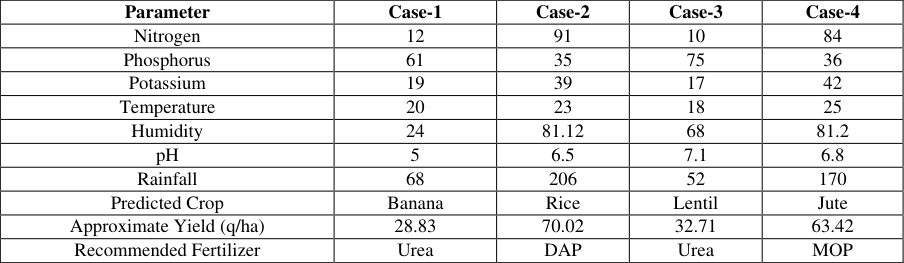 Table 4
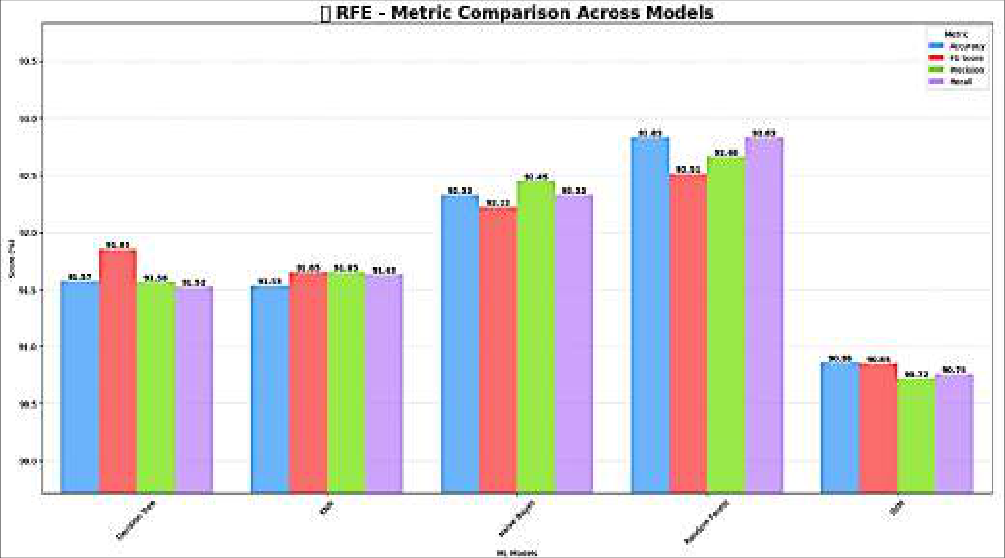 Figure 2
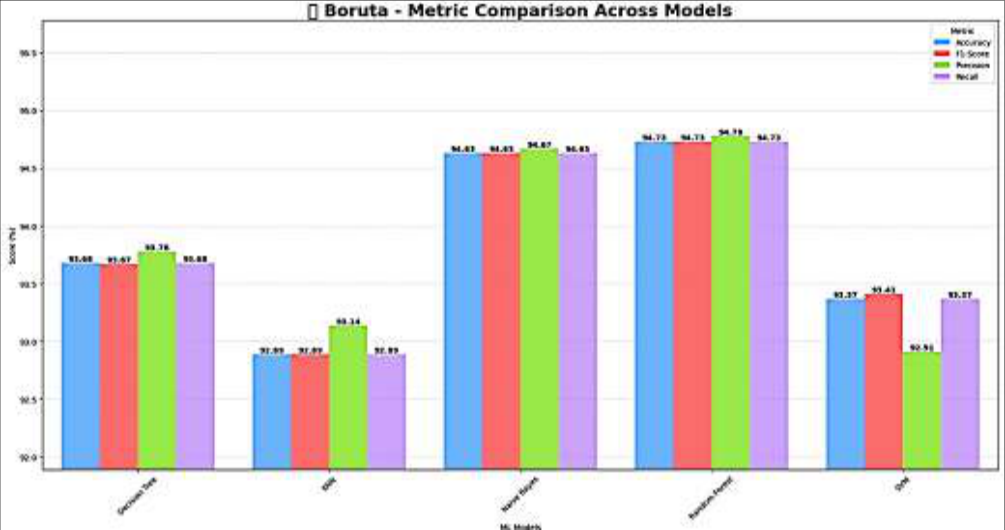 Figure 3
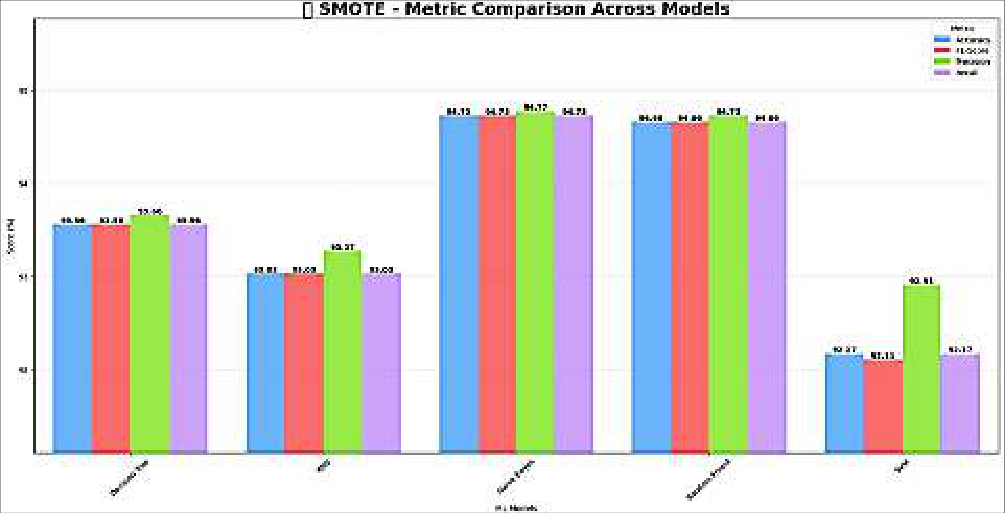 Figure 4
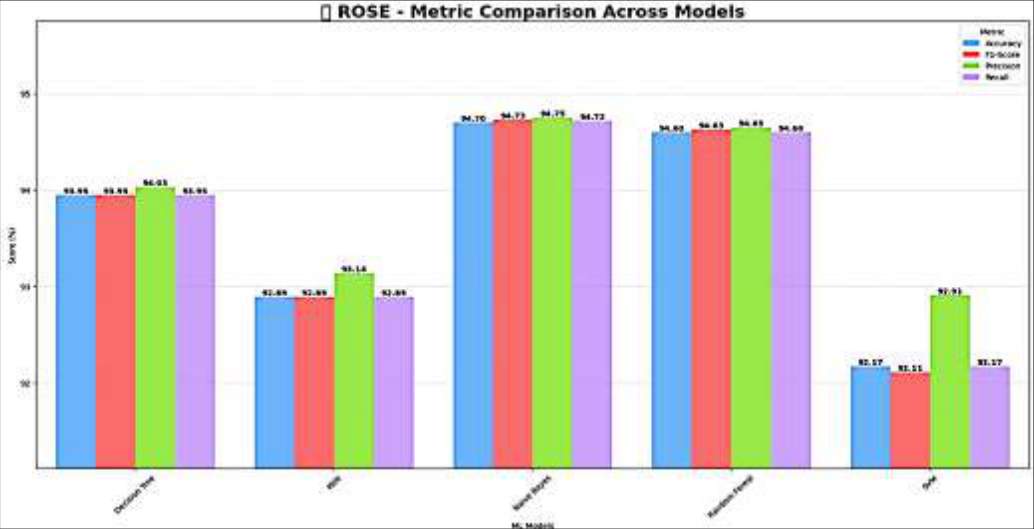 Figure 5
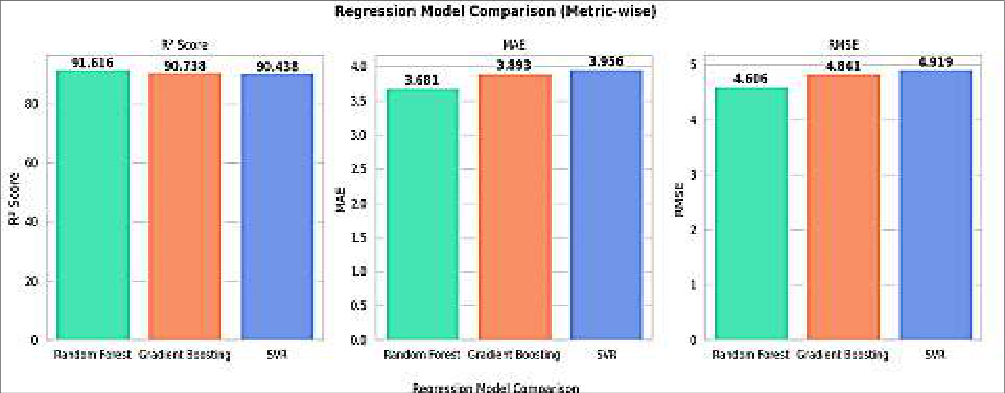 Figure 6
Introduction
Machine learning (ML) is playing a more and bigger role in the agricultural sector, with several useful applications such as crop forecasting, feature prediction, and fertilizer prescription. carried out one of the first investigations in this direction, erecting a classification scheme of significant soil and environmental attributes, namely pH, temperature, humidity, rainfall, phosphorus, potassium, and nitrogen. The paper highlighted the fact that feature selection is vital in improving model performance. The techniques most suited to filter the most important characteristics were Recursive Feature Elimination (RFE), Boruta, and MRFE. Comparison of classifiers revealed that Random Forest was more accurate and stable than defined traditional methods, basing on the necessity of more optimised models. Their strategy attained 99.3 percent precision in the 22 crop sets by types through the use of GA in adapting the model hyper-parameters. In enhancing clarity and confidence, explanable AI techniques such as LIME and SHAP were also employed to examine model judgments. Such ensemble learning with optimization demonstrated the effectiveness of adaptive algorithms in dealing with complex agricultural data [2] . proposed a use of two-model system of crop categorization and yield forecasting to meet the demands of both regression and classification. Several classifiers, including Random Forest, SVM, and Extra Trees, were evaluated with the dataset of 2,200 items consisting of soil and climatic variables; Random Forest achieved the best results. The authors used regressions on World Bank and FAO past data together with imputation of data using MICE to predict yield. They also applied Explainable AI (XAI) technologies including feature importance analysis and LIME to interpret their results. This is because the study again reinstated the essence of explainability, feature engineering, and data preparation in developing dependable machine learning models in agriculture [3] with the sole focus of the study being on rice yield prediction.
The model was constructed on an LSTM structure that was modified to feature a yield target and a custom lossed. With the use of data derived vegetation indices (NDVI, SAVI and MSR) from drone imagery, the model achieved a 95 percent classification accuracy and Kappa agreement value of 0.82. In this paper, the benefits of including temporal information as well as domain-specific objectives in deep learning frameworks to support yield forecasting were shown. Additionally, [4] Investigated yield prediction with temporal and multimodal data sources. And to identify intricate spatial and phenological patterns in agricultural data, they suggested a model that integrated Temporal Graph Neural Networks (TGNNs) with Meta-Transformers. Their approach achieved 97% classification accuracy by combining temporal data with RGB, infrared, and multispectral pictures. This method offered a scalable solution from small farms to national planning models by combining climatic and non-climatic parameters to deliver suggestions relevant to a certain area. Using a unique deep learning model named Target-Aware Yield Prediction (TAYP) [5] Concurrently, it has been demonstrated that incorporating multi-sensor data from remote monitoring platforms and IoT-enabled equipment greatly improves realtime agricultural analysis. In [6] Random Forest demonstrated its efficacy in multisource data situations by delivering the lowest error rates among the studied models. In addition to classification, this approach enables contextaware cultivation recommendations, facilitating better decision-making and increasing productivity in a range of circumstances. Hybrid deep learning architectures that combine temporal and spatial data representations have also recently led to advancements in yield prediction. Utilizing satellite and aerial data, a model that combines 3D Convolutional Neural Networks, ConvLSTM, and Vision Transformers (ViT) can extract vegetation indices, environmental stress signals, and subtle growth patterns. With significant gains in accuracy and resource planning, this combination allows for strong generalization across crops and geographical areas. The integration of selfattention mechanisms can be used in making fast cropmanagement decisions and to get real-time information to decide when to irrigate and fertilize. The combination of machine learning and multi-sensor data fusion in an environmental analysis such as growth stage or soil condition, or season makes High-precision crop classification possible, which is stated in [7] . The environmental factors such as the records of pesticides used and weather information are also crucial when predicting crop production. Embedding these features in logistic regression and gradient boosting models has resulted in predictability accuracy of almost perfection. These models offer cross-validated, scalable decision supports in yield forecasting against the use of pesticides and climatic variables of volatility, and the parameters against hyperparameters of the algorithm is adjusted [8] . Further, a different paper applied regression and deep learning models to predict crop production dynamics in agricultural regions in India and the inputs in that study were rainfall, farmed land, temperature, and crop type. Other methods are usually outperformed by Random Forests and Convolutional Neural Networks in terms of the level of accuracy and their being intelligible. In [9] , the findings highlight how advanced models may assist early crop planning, reduce losses, and contribute to national food security by guiding decisions at both the field and policy levels. Unsupervised domain adaptation using a Bayesian domain adversarial neural network (BDANN) to manage domain shift in agricultural yield modeling is discussed in reference [10] . The model uses a combination of Bayesian inference and a Domain Adversarial Neural Network (DANN) to evaluate prediction uncertainty and extract domain-invariant properties. A very successful deep learning model for canola crop production prediction is proposed in [11] using hyperspectral data collected by UAVs. To improve the basic 1D-CNN model (R² = 0.82) for deployment on resource-constrained edge devices like Raspberry Pi, we use SHAP-based feature selection, pruning, and quantization. This leads to a much lower model size (~93%). The study also investigates positive arithmetic as a substitute for floating-point formats, obtaining a 94% model size reduction and an R² of 0.772 [12] . This study shows how clever model compression techniques allow precision agriculture to monitor crops in real-time, at a cheap cost, and with high accuracy, and shows the model performance.
B. Based On Climatic Conditions
A yield projection model isn't complete without including the influence of weather on crop development [15] . used a combination of climate and NDVI data to estimate wheat yield in Pakistan's Multan district. The model improved prediction accuracy by incorporating climate parameters like wind speed, precipitation, and temperature, as well as satellite-derived vegetation indices. Random Forest, SVM, and LASSO resulted in an R² score of up to 0.88, with Random Forest outperforming the others [16] . Researched the use of big data analytics for weather-based crop prediction in India, taking into account a wide range of meteorological variables like temperature, humidity, rainfall, and solar radiation across different districts. The model was evaluated on major crops such as rice, wheat, and sugarcane, and the addition of real-time meteorological inputs resulted in considerable increases in forecast accuracy [17] . Using an interpretable machine learning approach, climate variables, soil characteristics, and satellite-derived indices were combined to forecast cotton yield. The most important climatic element that affected yield throughout the bollsetting stage was precipitation, particularly between June and August. The majority of predictive power was attributed to climate-related variables, underscoring the close relationship between seasonal weather fluctuations and cotton productivity. By analyzing several environmental elements such soil type, pH, temperature, rainfall, humidity, sunshine hours, and fertilizer usage, machine learning enables accurate and early crop output prediction [18] . Yield estimate makes use of a wide variety of techniques, such as RNNs, Boosted Regression Trees, Support Vector Regression (SVR), and Random Forest (RF). By combining the SAR interferometric coherence of Sentinel-1 and the optical vegetation indices of Sentinel-2, machine learning was used in [19] to predict rice yield using Gaussian kernel regression (GKR). In [20] , Multiple Instance Regression (MIR) and Online Dictionary Learning (ODL) were applied to improve county-level maize yield predictions using machine learning. The model achieved high prediction accuracy and regional generalization by addressing issues such as geographical heterogeneity and mixed pixels in satellite imagery by transforming pixel-level remote sensing inputs into sparse codes [21] . Through the analysis of data including soil characteristics, climatic variables, and satellite or drone imagery, machine learning is frequently used to predict crop production. Using vegetation indices produced from remote sensing data, one may track the health of crops and their growth patterns. To make very accurate yield predictions, these features are then incorporated into models such as deep learning networks, random forests, or linear regression.
C. Machine Learning Use For Crop Yield Prediction
Utilizing machine learning methods allows for the prediction of agricultural yields [22] . is aSubfield agricultural yields were predicted using machine learning, more especially LSTM networks, and supplemental data such as soil, weather, and topography, as well as satellite images. Sentinel-2 time-series data was analyzed to identify trends in crop growth, and pixel-by-pixel predictions were generated. Shapley values and other feature attribution techniques were used to determine the most significant spectral bands and growth stages to improve interpretability. [23] . Using sensor data such as temperature, humidity, and CO₂, machine learning in this study allows for precise, realtime soybean quality prediction. It enhances grain transportation and storage decision-making and lowers postharvest losses [24] . This paper discusses numerous Random Forest is one of several machine learning algorithms for predicting agricultural production, ANN, CNN-RNN, and XGBoost, stressing their importance in palm oil yield estimation using data such as weather, soil, and remote sensing indices [25] . The study uses agro meteorological and satellite data to estimate tea yield using models such as Decision Trees, SVR, XGBoost, and a deep neural network optimized using Neural Architecture Search, with great accuracy (R² = 0.99) [26] . This paper uses satellitederived phenological profiles and integrates them with FAO's Aqua Crop model and agro-ecological zoning to estimate maize and wheat yields, exhibiting a hybrid remote sensing and modeling technique [27] . This study uses ensemble machine learning (Cubist, Random Forest, XGBoost) and multisource data (NDVI, weather, soil) to downscale U.S. soybean and corn yield data to 1-km grids and achieves excellent spatiotemporal accuracy for largescale yield prediction [28] . The study improves yield prediction in intercropping systems utilizing an optimized Feedback Neural Network (FNN) paired with advanced loss functions like HAEL, DML, and QL, capturing agronomic complexity and increasing forecast accuracy beyond typical MSE-based models [29] . By modeling both deep features and spatial consistency, a 3D CNN may better forecast wheat yield in China by extracting spatial-spectral characteristics from the various. Multispectral pictures and fusing them using a multikernel Gaussian process [30] . In this pilot work, cranberry yield is noninvasively estimated using microwave sensing and machine learning (PCA + LDA). By comparing backscatter signals with ground-truth data, high prediction accuracy (avg. error < 1.3%) is achieved [31] . By guaranteeing ideal light availability for crops like Andrographis paniculata, the study optimizes PV tilt angles in agrivoltaic systems using simulation-based modeling and predictive analytics, hence indirectly increasing crop productivity [32] . By identifying spatiotemporal patterns in vegetation growth data, Spiking Neural Networks (SNNs) are used to estimate winter wheat yield in China using NDVI time series from MODIS. They achieve 95.6% accuracy [33] . This paper proposes a soil fertility mapping system that provides fertilizer recommendations based on crop type, soil type, and realtime soil NPK levels using the Internet of Things in combination with machine learning models like Gaussian Naive Bayes, SVM, KNN, and Logistic Regression. With 94% testing accuracy and 96% training accuracy, Gaussian Naïve Bayes was the most effective model in the test for forecasting fertilizer. These smart systems make sure that fertilizer is used in the best way possible, which lowers the impact on the environment while increasing agricultural yield and resource efficiency.
Methodology A. Dataset Description
The dataset encompasses a diverse range of 22 unique crop types, such as rice, wheat, maize, banana, apple, grapes, mung beans, chickpeas, cotton, and soybeans, among others. This study makes use of the Crop Yield Fertilizer dataset, which is available at Hugging Face Datasets Hub [34] . This dataset includes basic agricultural characteristics such as soil pH, temperature, moisture, and nitrogen, phosphorus, and potassium quantities. Additionally, it includes yield values (in tons per hectare) and the type of fertilizer applied,
B. Pre-Processing
The first stage in preparing the Crop Yield Fertilizer dataset for analysis was extensive data cleaning and examination. The Hugging Face datasets library was used to load the dataset, which was then turned into a pandas Data Frame for easy processing. It was revealed by an exploratory check that was conducted to identify missing values, inconsistencies and repetitive information. Numerical values left unencrypted were calculated using the median to keep data intact and prevent probability that may result in bias and with the duplicated assignments removed to ensure the data points' quality and uniqueness. Then categorical variables such as form of fertilizer and the type of crops were converted into numeric forms so that they could be used in machine learning tools. The label encoding was applied to fertilizers types and crop labels in the case of each unique designation into an integer. This encoding phase is required to allow the models to properly read category variables while avoiding bias caused by arbitrary numerical assignments. This dataset was divided into training and testing subsets in a ratio of 80:20 to eliminate sampling bias and maintain class distribution. The planned work's work flow is depicted in Figure 1. Among the feature selection approaches that are mostly used are the filter, wrapper and embedding. The wrapper strategies used in this work are very effective in identifying the most salient and pertinent aspects that contribute to predictive accuracy because they assess subsets of the features according to model performance. Besides feature selection, sampling techniques are a must to enhance model performance, with unbalanced or sparse data. In order not to induce bias to the majority classes in the model. The proposed framework combines both feature selection (RFE, BORUTA) and sample collection (SMOTE, ROSE) to build an efficient crop recommendation system based on input parameters such as N, P, K value, pH, rainfall, moisture, and temperature. The suggested crop is thereafter deployed in two parallel frameworks; the production of crop yields and fertilizer recommendation. This integrated model provides a proper prediction of crops and yields besides recommending the best fertilizer that would eventually increase productivity. In general, the model increases sustainability of agriculture and enhances its level of decision-making and avoids wastage of resources by using smart data-based insights. The system architecture of the proposed crop, yield and fertilizer recommendation scheme is motivated by, and slight adaptations of AgroAdvisor base framework proposed in [35] .
C. Feature Selection Techniques
The feature selection is the procedure of separating and retaining most pertinent qualities of a dataset to enhance the proficiency and effectiveness of a model. It reduces dimensionality and eliminates noise as well as the possibility of overfitting. The feature selection improves computer performance and makes it possible for the model to capture more meaningful patterns leading to improved generalization on the new data.
Recursive
Feature Elimination (RFE): A wrapper technique for feature selection called "redundant feature elimination" (RFE) estimates the most important aspects of a reinforcement machine learning model. It is achieved by training model repeatedly and removing minimal important features until an optimal set is recovered. In contrast to filter methods, which do not take account of the context of the learning algorithm, RFE measures feature importances (iterative weights as applied to each feature), thereby performing better analysis of feature interactions. The approach simplifies the model form, increases accuracy and safeguards against overfitting by eliminating unnecessary or irrelevant input. Working is done in stages at RFE. First, all the The model is trained with features. The model assessment is then used to rank the features' relevance. (For instance, the linear models' coefficients or the tree-based models' feature significance). The smallest feature (s) are removed and the remainder retrained. Until the required amount of characteristics remain, this process is repeated. In order to streamline it further, RFE can be combined with cross-validation, which is also referred to as RFECV that will automatically determine how many features should be retained and which model set should be used by comparing the performance of the models on individual subsets. That is why RFE is a successful and flexible method of feature selection. The ability of RFE to enhance model interpretability and effectiveness is among the most significant benefits of the technique, especially when direction through high-dimensional data around. It guarantees that relevant ones only will be retained, which lowers the training time and computing cost and generalizes
Boruta
Boruta is an extensive feature selection algorithm, which relies on the Random Forest algorithm. In contrast to methods focusing on finding the optimal minimal combination of characteristic, Boruta aims at finding not just any subset of features, which is significant in predicting outcome. It is particularly helpful in the cases when it is vital to not miss any seminal variables, even the interrelated ones. Boruta is based on a wrapper method and is distinctive in that it identifies important variables in messy, highdimensional data.
The following procedures make up the Boruta algorithm:
1. Extend the dataset by adding shadow attributes (shuffled copies of the original features), usually five at a time. 2. Shuffle the shadow characteristics to eliminate any association with the target variable. 3. Train a Random Forest model and calculate Z-scores (importance scores) for each feature. 4. Determine the maximum Z score among the shadow attributes (MZSA). 5. Give a "hit" to any original feature that has a higher Z score than the MZSA. 6. For features of unknown importance, run a two-sided statistical test. 7. Marks ranks substantially lower than MZSA as unimportant, and they are eliminated. 8. Mark is rated substantially higher than MZSA as important. 9. Remove any shadow characteristics from the dataset. 10. Repeat this method until all trails have been evaluated as important or unimportant.
Boruta is particularly successful in agricultural applications for understanding that agricultural yield, disease prevalence, and site appropriateness are influenced by a variety of environmental, climatic, and soil-based variables. For instance, Boruta may be used to determine important variables like temperature, rainfall, NDVI, soil pH, moisture content, and nutrient levels when predicting crop production. Boruta in models offering improved generalization and more information on the different factors affecting agricultural results because of considering all important factors.
D. Sampling Techniques
In dealing with imbalanced dataset, sampling techniques play a remarkable role, To prevent the machine learning model from being biased towards the majority class, they increase the level of prediction, recall, and equitability, especially to the underrepresented population. They enable classification of crops, production forecasting and fertilizer recommendations in sectors like agriculture among others. They help in constructing more inclusive and data-driven solutions.
E. Machine Learning Algorithms 1. Naïve Bayes(NB)
Naive Bayes is a probabilistic generalization based on the Naivete Theorem a Bayesian classifier that can be used to conclude the probability of a category to appear given the presence of a set of predetermined features. It is referred to as naïve because, given the class level, it assumes that every feature is independent of every other feature. This high assumption often works very well in practical real-world classification scenarios to the point of achieving astonishing results. Bayes Theorem is mathematically stated as in (Eq 1).
Naive Bayes is used by first transforming the data in the form of a frequency table and then it is used to calculate the probabilities of each type of class based on observed values of features. The output prediction is equal to the class of the largest posterior probability. Naive Bayes algorithms exist in various forms; Gaussian works on continuous data, Multinomial on count data and Bernoulli on binary features. Labelling of crop types can be accomplished in agriculture based on environmental conditions concerning type of soil, rainfall and temperatures using Naive Bayes. It is also able to help presage the presence of diseases using symptoms or past conditions. Its strongest suits are ease of use, fast, and it works well with small data sets.
Decision Tree
The decision tree is a type of tree model that may be used for regression and classification. It partitions the data nodes based on the condition imposed on the features value, in some attempt to make their decisions as clean as possible, i.e., to contain as many or as many of the data points most or all in the same category. The internal nodes test an attribute, each branch Garcia et al. represents a decision result, with each leaf node standing for a prediction or class label. The Gini Index and Information Gain are two quantitative metrics that help choose which characteristic should be used to effect the splitting. Tree building usually starts with a root node and recursively partitions (or splits) the data, until the termination conditions are satisfied (e.g. maximum depth or pure nodes). Due to its simplicity and interpretability, decision trees may be used in the actual world of decisionmaking. They tend, however, to suffer overfitting, particularly as the tree becomes over-complex, and may be easily destabilized by small data changes. In agriculture, Decision trees could be used to determine the most suitable crop to plant relying on the soil conditions and weather conditions or to determine soil type in the field so different crops can be irrigated with different irrigation systems. They may also apply in the prediction or the pest control plan of a disease.
Support Vector Machine (SVM)
Support vector machines (SVMs) are often used as supervised learning techniques, although they can also handle regression and classification problems. SVMs determine the optimal plane by classifying data points into groups based on a maximum margin. This margin is the distance between the support vectors -the closest data points from each class -and the plane. SVMs use a technique called the kernel trick to transform the input data into a higher-dimensional space, which can be distinguished when a linear partition of the data is not possible. Regular kernels include linear, polynomial, and diagonal basis functions (RBFs).The goal is to identify the best hyperplane in this transformed space that divides the classes.
K-Nearest Neighbors (KNN)
Regression and classification are two applications of the non-parametric K-Nearest Neighbors (KNN) algorithm. It functions on the presumption that comparable data points are located in feature space near one another. If you ask KNN to predict anything, it will use the labels of the "k" training samples that are geographically nearest to the query location to achieve its forecast. To put a number on how close something is, people often utilize distance metrics such as the Manhattan, Minkowski, or even the Euclidean distance. A lazy learner is the name given to KNN due to the fact that it does not pre-train a model. In fact, it stores all of the training data and makes a decision only when requested to make a forecast. The result is decided by averaging the labels of the closest neighbors (regression) or by holding a majority vote (classification). Agricultural applications of KNN include crop production prediction using weather, soil moisture, and temperature as inputs.
Random Forest (RF)
Random Forest is an efficient ensemble learning method that generates multiple decision trees and pools their data to provide more accurate and reliable predictions. It operates on a technique referred to as bootstrap aggregating, where the sample is taken to build using replacement. some subgroups of the original data. A distinct decision tree is trained with each subset. In addition, at Only a random subsample of characteristics is taken into account for each node during splitting in a tree, further contributing to the heterogeneity of the trees. This randomness reduces the risks of overfitting and ensures that the trees are less correlated. The results of each of the trees are added together after the tree is trained to give the final prediction by the Random Forest. It uses majority voting in the classification problem; the output given in the end is the class on which most of the trees predict. It averages the meaning of regression operations of each tree. This ensemble method generates a higher overall performance by reducing the variance and maintaining the low bias.
Regressor Algorithms
Our results were estimated using several machine learning algorithms and evaluated to ensure maximum efficiency. In this study, we used several machine learning methods to predict agricultural productivity. The hyperparameter adjustment algorithm based on optimizers was implemented in our study so that machine learning algorithms would perform better. We also performed a comparative study between these models, which comprise:
Random Forest Regressor (RFR) Rationale:
The ability to learn the ensemble that the Random Forest Regressor (RFR) has to make prediction is more correct and more permanent than the single decision trees, and thus the use of Random Forest Regressor (RFR).
Being able to process large datasets that contain many input variables, it can be of great use in predicting agricultural productivity. Use Case: RFR applies to the high-dimensional complicated data in which there is a diversity of interconnected agricultural features such as crop types, soil, and the weather. It provides accurate and consistent yield forecasts even in case noisy data exists.
Advantages
Advantages
Optimization:
The RFR was improved by varying the minimum number of samples required to split or generate a leaf (min_samples_split, min_samples_leaf), the number of trees (n_estimators), the tree depth (max_depth), and the number of features considered at each split (max_features).
To determine the optimal settings, five-fold cross-validation was facilitated by grid search and random search.
Gradient Boosting Regressor (GBR)
Rationale: I used Gradient Boosting Regressor (GBR) because it uses the outstanding ability to build strong predictive models through sequential correction of the errors made by the previous models. On that basis, it is fairly efficient in predicting complex patterns in data sets pertaining to agriculture.
Advantages: GBR is an efficient method of ensembles which employ a scheme of boosting to combine weak learners, which are typically decision trees. The purpose of training every tree can be to decrease the remaining errors of its ancestors. GBR better models non-linear relationship compared to the bagging methods due to the sequential learning nature of GBR. When regularization and early halting are applied adequately, then it is not prone to over fit in comparison to conventional models.
Application: GBR is suitable to estimation of agricultural productivity in tough situations. It also turns out to be particularly good on data on which small improvements in accuracy of prediction might be yielded by learning about the future of the residuals using the prior predictions.
Optimization: GBR was optimized using hyper parameters n_estimators, learning rate, max_depth, and subsampling ratio.
Support Vector Regressor (SVR)
Support Because it can handle high-dimensional data and describe non-linear interactions between features and targets using kernel functions, the Vector Regressor (SVR) is used. It particularly does well in a case where the number of characteristics in the data is huge as compared to the samples.
Advantages:
SVR is predictive in nature and can be reliably applied to any given data set as it establishes a perfect hyperplane in a high-dimensional space by fitting the training data with a certain tolerance (epsilon). It supports a variety of kernel functions (linear, polynomial, and RBF), allowing it to capture both linear and nonlinear interactions.
Use Case:
Agricultural yield datasets with complex, non-linear connections between crop production and environmental factors may be effectively modeled using SVR. It shines when working with standardized or normalized features.
Optimization:
Optimization involves tuning key hyperparameters such as kernel type (linear, polynomial, or RBF), regularization parameter C, epsilon (ε), and gamma (γ). The kernel transforms data into higher dimensions, while C balances margin width and error. ε establishes the margin of tolerance, while γ affects model adaptability. Grid
Search and Random Search, coupled with 5-fold crossvalidation, were employed to determine the best parameter combination to avoid overfitting and improve predictive accuracy.
F. Performance Metrics
The efficacy of feature selection and classification algorithms were assessed in this work using the F1-score, recall, accuracy, and precision measures. The regression approaches for yield were tested using the metrics R² score, MAE, and RMSE, as shown below.
Accuracy
In classification tasks, accuracy is a crucial metric as it shows what proportion of guesses were right relative to the total number of predictions. As a whole, it shows how well the model is doing by showing how often it occurs. Regardless of the distribution of classes, the model consistently produces correct forecasts.
Precision
Accuracy is obtained when the number of correct predictions is divided by the total number of positive events predicted. The number of correct predictions of positive outcomes is shown. When a model has excessive accuracy, it generates few false positives, which is particularly noteworthy in situations when there is a substantial penalty for producing an incorrect positive prediction.
Recall
The sensitivity, true positive rate, or recall of a model is a measure of how well it can detect real positive instances. When it's important to catch every instance of a certain class, it helps cut down on false negatives.
F1-Score
The F1 score is the outcome of harmonically averaging recall and accuracy. It gives an even measure that takes both the good and negative sides of the coin into consideration. When working with imbalanced datasets, where accuracy alone might be deceiving, the F1-score comes in handy.
R² Score
R2 is a statistic that measures how well a model fits the data. It indicates how well the independent variables can predict the variation in the dependent variable. A range of 0 to 1 is used, where 1 corresponds to a perfect forecast and 0 means that the there is no variation explained by this model.
Mean Absolute Error (MAE)
The MAE is the mean value of the size of errors in a set of forecasts and does not put importance on their way. It is the average of absolute projection-actual differences. In notation, MAE = (1/n) 01 i=1 n(y i -yi).
Root Mean Squared Error (RMSE)
RMSE is determined by calculating the square root of the average of the squared differences between the predicted and observed values. It is more prone to outliers since it is harsh on larger errors than is the case with MAE. The equation is:
RMSE is very beneficial in prediction tasks when big errors are undesirable.
Experimental Results and Analysis
The experimental setup and results based on the use of various machine learning models for yield prediction in agriculture are presented here. The evaluation of the models involved the use of complex feature selection methods and sampling in order to resolve to enhance the level of performance output using imbalanced datasets. To carry out a comparison study, the experimental results with key performance measures are listed in a systematic order as below. These findings shed light on the efficiency of each strategy in improving prediction accuracy and model robustness. The two top choices here, Random Forest and Naive Bayes, have extremely consistent and almost identical performance across all relevant assessment parameters. Decision Tree's performance is good, but it is not up to par with the best two models. A modest level of performance is shown by K-Nearest Neighbors, with noticeable variances in balance and overall scores. While Support Vector Machine does somewhat better in terms of accuracy, its reliability is worse because to its poor performance in other domains. When combined with effective feature selection methods, probabilistic and ensemble models prove to be quite beneficial. See Figure 3 for the Random Forest with a 94.73% accuracy rate. Consistently, when SMOTE is used, the most comprehensive and successful outcomes according to all pertinent criteria are produced by Random Forest (94.66% accuracy) and Naive Bayes (94.73% accuracy). Decision Tree shows a little decline in performance compared to the top models, but it still does quite well overall. In terms of overall effectiveness and balance, K-Nearest Neighbors is still behind, albeit making considerable improvements. Support Vector Machine remains the least effective model, with significant variance across measures. This suggests that, as seen in Figure 4, Although certain models may perform better with synthetic oversampling, more generalizable models show the most gains. The very constant and better performance of the Random Forest and Naive Bayes models across all assessment metrics, with accuracies of 94.70% and 94.60% when employing the ROSE sampling strategy, strongly indicates dependability. As a result, the Decision Tree maintains its competitive edge and ranks second with balanced scores, while other algorithms such as SVM and K-Nearest Neighbors only show marginal improvement. Despite improvements, Support Vector Machine continues to lag behind competing models because to its unpredictable metrics. Figure 5 shows that ROSE improves the performance of models with significant generalization capabilities, reaffirming the superiority of ensemble and probabilistic approaches.
Conclusion and Future Scope 1. Conclusion
The project has been exemplified in the way that it has used machine learning as an application in agriculture to be more data-driven and knowledgeable. The categorization models showed a good level of performance in providing a recommendation on the appropriate crop to grow and regression model was also good in determining the 2. Future Scope 1. Future work possibilities include an increase in the amount of data, adding more crop varieties, regional variances, and the current weather curve. At present, the model is calibrated on a restricted range of crops and conditions and might not be easily transferred to a wide range of agricultural settings. Using data across geographical zones and crop growing seasons, the model may be able to learn larger incoming trends and adjusted to agricultural practices that are unique to each location helping to increase its applicability to a greater variety of farming situations. 2. Complementary, better results could be obtained by testing more powerful machine learning methods. Although standard models (e.g., decision trees and linear regression) can be interpreted, more complex algorithms (e.g., ensemble learning, gradient boosting (e.g., XGBoost, LightGBM), and deep learning models (e.g., artificial neural networks, LSTM networks)) can potentially be more accurate and/or robust. The above approaches are particularly useful in the analysis of interactions and non-linear correlations between variables, very common in agricultural data. Another way in which predictive performance may be improved is through exploring a model stacking or hybrid approach to combining the different strengths of different algorithms.
Figures and tables from the paper
| Feature Selection | Model | Accuracy (%) | Precision (%) | Recall (%) | F1-Score (%) |
|---|---|---|---|---|---|
| RFE | Naive Bayes | 92.33 | 92.45 | 92.33 | 92.22 |
| Decision Tree | 91.57 | 91.56 | 91.52 | 91.85 | |
| SVM | 90.86 | 90.72 | 90.76 | 90.85 | |
| Random Forest | 92.83 | 92.66 | 92.83 | 92.51 | |
| KNN | 91.53 | 91.65 | 91.65 | 91.65 | |
| BORUTA | Naive Bayes | 94.33 | 94.67 | 94.63 | 94.63 |
| Decision Tree | 93.68 | 93.78 | 93.68 | 93.67 | |
| SVM | 93.37 | 92.91 | 93.37 | 93.41 | |
| Random Forest | 94.73 | 94.78 | 94.73 | 94.73 | |
| KNN | 92.89 | 93.14 | 92.89 | 92.89 |
Table text extracted from the original PDF; superscript letters are shown inline. The original table image is below.
View original table image
| Technique | Model | Accuracy (%) | Precision (%) | Recall (%) | F1-Score (%) |
|---|---|---|---|---|---|
| Smote | Naive Bayes | 94.73 | 94.77 | 94.73 | 94.73 |
| Decision Tree | 93.56 | 93.66 | 93.56 | 93.56 | |
| SVM | 92.17 | 92.91 | 92.17 | 92.11 | |
| Random Forest | 94.66 | 94.73 | 94.66 | 94.66 | |
| KNN | 93.03 | 93.27 | 93.03 | 93.03 | |
| Rose | Naive Bayes | 94.70 | 94.75 | 94.72 | 94.73 |
| Decision Tree | 93.95 | 94.03 | 93.95 | 93.95 | |
| SVM | 92.17 | 92.91 | 92.17 | 92.11 | |
| Random Forest | 94.60 | 94.65 | 94.60 | 94.63 | |
| KNN | 92.89 | 93.14 | 92.89 | 92.89 |
Table text extracted from the original PDF; superscript letters are shown inline. The original table image is below.
View original table image
| Model | R² Score | MAE | RMSE |
|---|---|---|---|
| Random Forest | 91.616 | 3.681 | 4.606 |
| Gradient Boosting | 90.738 | 3.893 | 4.841 |
| SVR | 90.438 | 3.956 | 4.919 |
Table text extracted from the original PDF; superscript letters are shown inline. The original table image is below.
View original table image
| Parameter | Case-1 | Case-2 | Case-3 | Case-4 |
|---|---|---|---|---|
| Nitrogen | 12 | 91 | 10 | 84 |
| Phosphorus | 61 | 35 | 75 | 36 |
| Potassium | 19 | 39 | 17 | 42 |
| Temperature | 20 | 23 | 18 | 25 |
| Humidity | 24 | 81.12 | 68 | 81.2 |
| pH | 5 | 6.5 | 7.1 | 6.8 |
| Rainfall | 68 | 206 | 52 | 170 |
| Predicted Crop | Banana | Rice | Lentil | Jute |
| Approximate Yield (q/ha) | 28.83 | 70.02 | 32.71 | 63.42 |
| Recommended Fertilizer | Urea | DAP | Urea | MOP |
Table text extracted from the original PDF; superscript letters are shown inline. The original table image is below.
View original table image
References
35 in the original paper- Raja SP, Sawicka B, Stamenkovic Z, Mariammal G. Crop prediction based on characteristics of the agricultural environment using various feature selection techniques and classifiers. IEEE Access. 2022;10:23625-41. doi:10.1109/ACCESS.2022.3154350.
- Mahmud T, et al. An approach for crop prediction in agriculture: integrating genetic algorithms and machine learning. IEEE Access. 2024;12:1-12. doi:10.1109/ACCESS.2024.3478739.
- Rasheed N, Khan SA, Hassan A, Safdar S. A decision support framework for national crop production planning. IEEE Access. 2021;9:133402-15. doi:10.1109/ACCESS.2021.3115801.
- Badshah A, Alkazemi BY, Din F, Zamli KZ, Haris M. Crop classification and yield prediction using robust machine learning models for agricultural sustainability. IEEE Access. 2024;12:1-14. doi:10.1109/ACCESS.2024.3486653.
- Chang YJ, Lai MH, Wang CH, Huang YS, Lin J. Target-aware yield prediction (TAYP) model used to improve agriculture crop productivity. IEEE Trans Geosci Remote Sens. 2024;62:1-11. doi:10.1109/TGRS.2024.3376078.
- Mirhoseini Nejad SM, Abbasi-Moghadam D, Sharifi A. ConvLSTM-ViT: A deep neural network for crop yield prediction using earth observations and remotely sensed data. IEEE J Sel Top Appl Earth Obs Remote Sens. 2024;17:1-15. doi:10.1109/JSTARS.2024.3464411.
- Reyana A, Kautish S, Karthik PMS, Al-Baltah IA, Jasser MB, Mohamed AW. Accelerating crop yield: multisensor data fusion and machine learning for agriculture text classification. IEEE Access. 2023;11:20795-805. doi:10.1109/ACCESS.2023.3249205.
- Jiabul Hoque MD, et al. Incorporating meteorological data and pesticide information to forecast crop yields using machine learning. IEEE Access. 2024;12:4776886. doi:10.1109/ACCESS.2024.3383309.
- Sharma P, Dadheech P, Aneja N, Aneja S. Predicting agriculture yields based on machine learning using regression and deep learning. IEEE Access. 2023;11:111255-64. doi:10.1109/ACCESS.2023.3321861.
- Ma Y, Zhang Z. A Bayesian domain adversarial neural network for Zea mays (corn) yield prediction. IEEE Geosci Remote Sens Lett. 2022;19:1-5. doi:10.1109/LGRS.2022.3211444.
- Valarezo-Plaza S, Torres-Tello J, Singh KD, Shirtliffe SJ, Deivalakshmi S, Ko SB. A novel optimized deep learning model for canola crop yield prediction on edge devices. IEEE Trans AgriFood Electron. 2024;1:1-9. doi:10.1109/TAFE.2024.3414953.
- Mitra A, et al. Cotton (Gossypium spp.) yield prediction: a machine learning approach with field and synthetic data. IEEE Access. 2024;12:101273-88. doi:10.1109/ACCESS.2024.3418139.
- Martinez-Ferrer L, Piles M, Camps-Valls G. Crop yield estimation and interpretability with Gaussian processes. IEEE Geosci Remote Sens Lett. 2021;18(12):2043-7. doi:10.1109/LGRS.2020.3016140.
- Elavarasan D, Vincent PMD. Crop yield prediction using deep reinforcement learning model for sustainable agrarian applications. IEEE Access. 2020;8:86886-901. doi:10.1109/ACCESS.2020.2992480.
- Ashfaq M, Khan I, Alzahrani A, Tariq MU, Khan H, Ghani A. Accurate wheat yield prediction using machine learning and climate-NDVI data fusion. IEEE Access. 2024;12:40947-61. doi:10.1109/ACCESS.2024.3376735.
- Gupta R, et al. WB-CPI: Weather based crop prediction in India using big data analytics. IEEE Access. 2021;9:137869-85. doi:10.1109/ACCESS.2021.3117247.
- Celik MF, Isik MS, Taskin G, Erten E, Camps-Valls G. Explainable artificial intelligence for cotton (Gossypium spp.) yield prediction with multisource data. IEEE Geosci Remote Sens Lett. 2023;20:1-5. doi:10.1109/LGRS.2023.3303643.
- Sharma A, Jain A, Gupta P, Chowdary V. Machine learning applications for precision agriculture: a comprehensive review. IEEE Access. 2021;9:1-30. doi:10.1109/ACCESS.2020.3048415.
- Alebele Y, et al. Estimation of crop yield from combined optical and SAR imagery using Gaussian kernel regression. IEEE J Sel Top Appl Earth Obs Remote Sens. 2021;14:10520-34. doi:10.1109/JSTARS.2021.3118707. International Journal of Agriculture and Food Science https://www.agriculturaljournals.com
- Huang R, Chen S, Li X, Cao Z. A multiple instance dictionary learning approach for Zea mays (corn) yield prediction from remote sensing data. IEEE Sens J. 2024;24:1-10. doi:10.1109/JSEN.2024.3488085.
- Shafi U, et al. Tackling food insecurity using remote sensing and machine learning-based crop yield prediction. IEEE Access. 2023;11:108640-57. doi:10.1109/ACCESS.2023.3321020.
- Najjar H, Miranda M, Nuske M, Roscher R, Dengel A. Explainability of sub-field level crop yield prediction using remote sensing. IEEE J Sel Top Appl Earth Obs Remote Sens. 2024;17:1-12. doi:10.1109/JSTARS.2025.3528068.
- Jaques LBA, et al. Nondestructive technology for realtime monitoring and prediction of soybean (Glycine max) quality using machine learning for a bulk transport simulation. IEEE Sens J. 2023;23(3):3028-40. doi:10.1109/JSEN.2022.3226168.
- Rashid M, Bari BS, Yusup Y, Kamaruddin MA, Khan N. A comprehensive review of crop yield prediction using machine learning approaches with special emphasis on palm oil yield prediction. IEEE Access. 2021;9:1-20. doi:10.1109/ACCESS.2021.3075159.
- Ramzan Z, Asif HMS, Yousuf I, Shahbaz M. A multimodal data fusion and deep neural networks based technique for tea yield estimation in Pakistan using satellite imagery. IEEE Access. 2023;11:42578-94. doi:10.1109/ACCESS.2023.3271410.
- Luciani R, Laneve G, Jahjah M. Agricultural monitoring, an automatic procedure for crop mapping and yield estimation: the Great Rift Valley of Kenya case. IEEE J Sel Top Appl Earth Obs Remote Sens. 2019;12(7):2196-208. doi:10.1109/JSTARS.2019.2921437.
- Pei J, et al. Downscaling administrative-level crop yield statistics to 1 km grids using multisource remote sensing data and ensemble machine learning. IEEE J Sel Top Appl Earth Obs Remote Sens. 2024;17:1443753. doi:10.1109/JSTARS.2024.3441252.
- Ikram A, Aslam W. Enhancing intercropping yield predictability using optimally driven feedback neural network and loss functions. IEEE Access. 2024;12:162769-87. doi:10.1109/ACCESS.2024.3486101.
- Qiao M, et al. Exploiting hierarchical features for crop yield prediction based on 3-D convolutional neural networks and multikernel Gaussian process. IEEE J Sel Top Appl Earth Obs Remote Sens. 2021;14:4476-89. doi:10.1109/JSTARS.2021.3073149.
- Haufler AF, Booske JH, Hagness SC. Microwave sensing for estimating cranberry (Vaccinium macrocarpon) crop yield: a pilot study using simulated canopies and field measurement testbeds. IEEE Trans Geosci Remote Sens. 2022;60:1-12. doi:10.1109/TGRS.2021.3050171.
- Abidin MAZ, Mahyuddin MN, Zainuri MAA. Optimal efficient energy production by PV module tiltorientation prediction without compromising crop-light demands in agrivoltaic systems. IEEE Access. 2023;11:71557-72. doi:10.1109/ACCESS.2023.3293850.
- Bose P, Kasabov NK, Bruzzone L, Hartono RN. Spiking neural networks for crop yield estimation based on spatiotemporal analysis of image time series. IEEE Trans Geosci Remote Sens. 2016;54(11):6563-73. doi:10.1109/TGRS.2016.2586602.
- Khan AA, Faheem M, Bashir RN, Wechtaisong C, Abbas MZ. Internet of Things (IoT)-assisted context aware fertilizer recommendation. IEEE Access. 2022;10:129505-19. doi:10.1109/ACCESS.2022.3228160.
- Hills J. Crop Yield Fertilizer Dataset [dataset]. HuggingFace. 2023. https://huggingface.co/datasets/Jakehills/Crop_Yield_F ertilizer
- Kukkar A, Mohana R, Sharma A, Mallik S, Shah MA. AgroAdvisor: crop yield prediction, crop and fertilizer recommendation system using random forest with gradient boosting and DeepFM for precise agriculture. Preprint. 2024. https://doi.org/10.21203/rs.3.rs4099720/v1
Cited by 2
From OpenAlex, OpenCitations and reference lists read by Scinovex
- AI-Driven Hybrid Model for Crop and Fertilizer Prediction ↗
Nakuluri Anilkumar, Korra Bharath, Kashodan Shivam Gupta, Vaddepally Pavan Sai, Mudusu Rambabu · 2026
❝ 0 - Real-Time Multi-Crop Recommendation using Machine Learning for Intercropping Optimization ↗
Godhandaraman T, M. Manikandan, Joshuva Arockia Dhanraj, Murugan Lakshmanan, Sriramkumar R, JoshuvaArockia Dhanraj · 2026
❝ 0